What is Stata Used For: A Comprehensive Overview|2025
What is Stata Used For: A Comprehensive Overview explains the key applications of Stata in data analysis, research, and statistical modeling. Discover its features and how it supports advanced analytics.
Stata is a powerful statistical software package widely used by researchers, data analysts, and academics across various disciplines. Renowned for its versatility, Stata provides an integrated suite of tools for data analysis, data management, and graphical representation. This paper explores the multifaceted uses of Stata, delving into its applications in statistics, research, and data analysis. Additionally, it examines comparisons with other software such as SPSS and R, addresses questions about cost and licensing, and clarifies the meaning of “Stata” as a term.
What is Stata Used for in Statistics?
Stata is a cornerstone in statistical computing, providing a comprehensive platform for analyzing and interpreting data. Its robust functionality supports a wide range of statistical methods, from basic descriptive statistics to complex econometric models.
Descriptive Statistics
Stata facilitates the computation of measures such as mean, median, standard deviation, and variance. Users can quickly generate summaries and tabulations, allowing them to explore data distributions and detect patterns.
Inferential Statistics
Stata excels in hypothesis testing, confidence interval estimation, and regression analysis. It supports parametric and non-parametric methods, making it suitable for diverse datasets.
Advanced Statistical Modeling
The software’s capabilities extend to multivariate analysis, survival analysis, time series analysis, and structural equation modeling. These features make it indispensable for professionals working in finance, healthcare, and social sciences.
What is Stata Used for in Research?
Stata’s role in research is unparalleled, providing tools to streamline every stage of the research process. It is widely used in academic, government, and industry settings to ensure accurate and reproducible results.
Data Management
One of Stata’s core strengths lies in its ability to handle large datasets efficiently. Researchers can merge, append, reshape, and clean data seamlessly. Features like automated data validation and error checking ensure data integrity.
Statistical Analysis
Researchers use Stata to apply complex statistical techniques to their data. Its command-based interface allows for precise control over analytical procedures, enabling users to replicate analyses with minimal effort.
Visualization
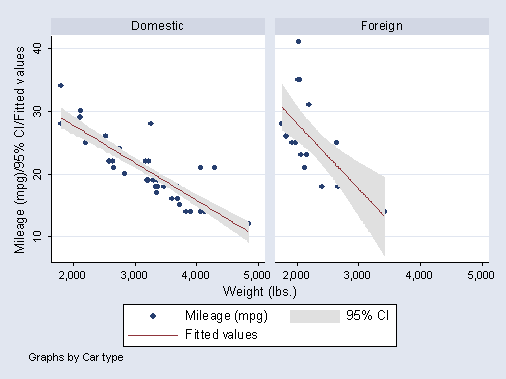
Stata provides robust tools for creating high-quality graphs and visualizations. Researchers can generate scatter plots, histograms, time series charts, and more. The software’s customization options allow users to tailor visual outputs for publications and presentations.
Documentation and Reproducibility
Reproducibility is critical in research, and Stata supports this through its do-files and log files. Do-files allow users to script and save commands, while log files capture outputs, ensuring transparency and repeatability in research workflows.
How to Use Stata for Data Analysis
Using Stata for data analysis involves several key steps, from importing datasets to interpreting results. Here is an overview of how to leverage Stata’s capabilities effectively:
Importing Data
Stata supports various data formats, including CSV, Excel, and databases. The import command allows users to load data into the software easily.
Cleaning and Preparing Data
Before analysis, data often require cleaning. Stata provides tools for:
- Handling missing values.
- Filtering and sorting data.
- Recoding variables.
- Creating new variables using mathematical expressions.
Exploring Data
Exploratory data analysis (EDA) is a crucial step. Commands like summarize, tabulate, and browse help users understand their data’s structure and distribution.
Performing Statistical Analysis
Stata’s statistical procedures cover a wide range of methods. For instance:
- Use
regressfor linear regression. - Use
logitorprobitfor binary outcomes. - Apply
xtsetfor panel data analysis. - Utilize
tssetfor time series analysis.
Visualizing Results
The graph command family enables users to create tailored visualizations. By specifying parameters and options, users can produce publication-ready graphics.
Exporting Results
Stata allows users to export tables, graphs, and datasets to external formats like Word, Excel, and PDF for reporting and dissemination.
Stata vs SPSS
Stata and SPSS are both popular statistical tools, but they cater to different audiences and needs. Understanding their differences can help users choose the appropriate software for their projects.
User Interface
- Stata: Primarily command-driven but also includes a user-friendly point-and-click interface. Ideal for users comfortable with scripting and coding.
- SPSS: Highly graphical and intuitive, making it more accessible to beginners.
Flexibility
- Stata: Offers greater flexibility and control for advanced statistical modeling and customization.
- SPSS: Designed for ease of use, but its customization options are more limited.
Data Management
- Stata: Handles large datasets efficiently, especially panel and time series data.
- SPSS: Also supports large datasets but can be slower with complex manipulations.
Cost
- Stata: Generally more affordable for academic institutions and comes with tiered pricing based on user needs.
- SPSS: Often more expensive, especially when additional modules are required.
Community and Support
- Stata: Strong user community with active forums and extensive online documentation.
- SPSS: Backed by IBM with robust customer support and training resources.
Is Stata Free?
Stata is not free software. It is a proprietary product developed by StataCorp, and users must purchase a license to access its features. However, the pricing structure is tiered, offering options for students, academics, and professionals. Here are the key licensing models:
- Student Licenses: Significantly discounted rates for students.
- Academic Licenses: Affordable pricing for universities and research institutions.
- Professional Licenses: Higher cost but includes additional features and support.
- Perpetual vs. Subscription: Users can choose between perpetual licenses (one-time purchase) or subscription-based models (annual fees).
For those seeking free alternatives, R and Python are open-source options worth exploring.
Stata Full Form
The term “Stata” does not have a universally agreed-upon full form. StataCorp has stated that the name is a combination of “statistics” and “data,” reflecting the software’s primary focus. While some users speculate about other meanings, the consensus remains tied to its statistical and data-driven origins.
Stata vs R
Stata and R are both powerful tools for statistical analysis, but they differ significantly in terms of functionality, ease of use, and flexibility. Here’s a comparison:
Learning Curve
- Stata: Easier to learn, with intuitive commands and extensive documentation.
- R: Steeper learning curve due to its programming-centric approach.
Flexibility and Customization
- Stata: Limited to built-in commands and modules but ensures reliability and ease of use.
- R: Highly customizable with thousands of packages available for specialized tasks.
Community and Support
- Stata: Strong support from StataCorp and an active user forum.
- R: Massive open-source community with extensive resources, tutorials, and forums.
Cost
- Stata: Proprietary and requires a paid license.
- R: Completely free and open-source.
Use Cases
- Stata: Preferred by economists, sociologists, and researchers for its streamlined workflow.
- R: Popular among data scientists and statisticians for its advanced capabilities and integration with other programming tools.
Conclusion
Stata is an essential tool for statistics, research, and data analysis, offering a robust suite of features for data management, analysis, and visualization. While it is not free, its cost is justified by its reliability and ease of use. Compared to other software like SPSS and R, Stata strikes a balance between functionality and user-friendliness, making it a popular choice among academics and professionals.
Whether you are conducting a simple statistical test or building complex econometric models, Stata provides the tools and support needed to achieve accurate and reproducible results. By understanding its capabilities and comparing it with alternatives, users can make informed decisions about incorporating Stata into their workflows.
Needs help with similar assignment?
We are available 24x7 to deliver the best services and assignment ready within 3-4 hours? Order a custom-written, plagiarism-free paper


