How to Perform Logistic Regression in Stata|2025
/in STATA Articles /by BesttutorHow to Perform Logistic Regression in Stata provides a comprehensive guide to conducting logistic regression analysis. Learn the steps, commands, and interpretation techniques to analyze binary outcomes with Stata.
Logistic regression is a statistical method used for analyzing datasets where the dependent variable is categorical, typically binary. In Stata, a popular statistical software, logistic regression can be easily performed using various commands. This paper will guide you through performing logistic regression in Stata, explaining key concepts and commands, with a special focus on interpreting the results. Additionally, we will address the difference between “logit” and “logistic” models, the treatment of categorical variables, and provide examples from a real dataset.
Table of Contents
ToggleIntroduction to Logistic Regression
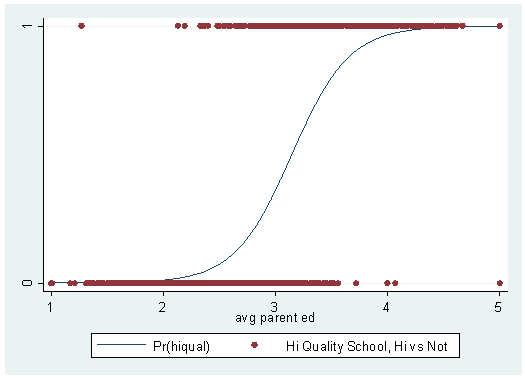
Logistic regression is used when the dependent variable is binary or dichotomous, meaning it has only two possible outcomes. For example, it could represent the likelihood of an event happening (1) or not happening (0). Logistic regression is applied in a variety of fields, such as medicine, economics, and social sciences, to model the probability of an event occurring based on one or more predictor variables.
The logistic regression model estimates the probability P(Y=1∣X)P(Y=1|X)P(Y=1∣X), where YYY is the dependent variable, and XXX represents the predictor variables (independent variables). The model assumes the log-odds of the dependent variable being equal to 1 are linearly related to the independent variables.
The logistic regression equation in its basic form is:
log(P(Y=1∣X)1−P(Y=1∣X))=β0+β1X1+β2X2+⋯+βkXk\log \left( \frac{P(Y=1|X)}{1-P(Y=1|X)} \right) = \beta_0 + \beta_1 X_1 + \beta_2 X_2 + \dots + \beta_k X_klog(1−P(Y=1∣X)P(Y=1∣X))=β0+β1X1+β2X2+⋯+βkXkWhere:
- P(Y=1∣X)P(Y=1|X)P(Y=1∣X) is the probability of the event occurring.
- β0\beta_0β0 is the intercept.
- β1,…,βk\beta_1, \dots, \beta_kβ1,…,βk are the coefficients for the predictor variables.
- X1,X2,…,XkX_1, X_2, \dots, X_kX1,X2,…,Xk are the predictor variables.
Stata provides an efficient way to conduct logistic regression with a range of functionalities, including the ability to handle categorical variables, calculate odds ratios, and assess model fit.
Preparing the Data for Logistic Regression
Before running any logistic regression model, it is crucial to prepare the dataset. In Stata, you can load a dataset using the use command or import a file using the import command. For the purposes of this example, let’s assume we are working with a dataset where the dependent variable is binary (e.g., whether a person has a disease: 1 for yes, 0 for no), and the independent variables include age, gender, and income.
For demonstration, consider the following variables:
disease: Binary dependent variable (1 if the person has the disease, 0 otherwise).age: Age of the person.gender: Categorical variable (1 for male, 0 for female).income: Income of the person.
use dataset.dta, clear
Running Logistic Regression in Stata
The basic command to perform logistic regression in Stata is logit. The general syntax for logistic regression is:
logit dependent_variable independent_variables
For example, to analyze the relationship between disease and the independent variables age, gender, and income, you would run the following command:
logit disease age gender income
This will run a binary logistic regression where the log-odds of the outcome (disease) are modeled as a linear combination of the predictors (age, gender, and income).
Interpreting the Logistic Regression Output
After running the logistic regression command, Stata will display output with several statistics. Here’s a breakdown of the key components of the output:
- Coefficients (
_b): These represent the change in the log-odds of the dependent variable for a one-unit change in the predictor variable. - Standard Errors (
Std. Err.): These indicate the standard error for each coefficient, which measures the precision of the estimate. - z-Statistic: This is the ratio of the coefficient to its standard error, used to test the null hypothesis that the coefficient is zero.
- P-value: This indicates the statistical significance of each predictor variable. A p-value less than 0.05 typically suggests that the predictor is statistically significant.
- Odds Ratio (OR): By default, Stata reports coefficients, but you can also calculate the odds ratios. The odds ratio represents the change in the odds of the outcome per unit change in the predictor. It is derived by taking the exponential of the coefficient.
You can calculate the odds ratio using the or option:
logit disease age gender income, or
The odds ratio for each variable will be displayed. For instance, an odds ratio greater than 1 suggests that as the predictor increases, the odds of the outcome occurring increase, while an odds ratio less than 1 indicates the opposite.
Logistic Regression with Categorical Variables
Categorical variables can be included in logistic regression models in Stata using dummy coding (i.e., converting categorical variables into binary indicator variables). For example, if gender is a categorical variable with two categories (male and female), you can include it in the model as a dummy variable. Stata automatically handles this process when you specify a categorical variable using i. notation.
For example:
logit disease age i.gender income
Here, i.gender tells Stata to treat gender as a categorical variable and create the necessary dummy variables. The coefficient for i.gender will indicate the effect of being male (compared to the baseline category, female) on the log-odds of having the disease.
Multivariable Logistic Regression in Stata
In many research scenarios, you may want to control for multiple variables simultaneously to avoid confounding. This is known as multivariable logistic regression, and it can be done easily in Stata by including multiple independent variables in the model.
For example:
logit disease age i.gender income
This will estimate the effect of age, gender, and income on the likelihood of having the disease, controlling for the other variables. In multivariable logistic regression, the interpretation of the coefficients changes, as each coefficient represents the effect of the corresponding variable while holding the others constant.
Logit vs Logistic in Stata
The terms “logit” and “logistic” are often used interchangeably but refer to different aspects of logistic regression in Stata:
- The
logitcommand in Stata estimates the log-odds of the dependent variable being 1 (i.e., the log of the odds ratio). This is the default method in Stata for logistic regression. - The
logisticcommand, on the other hand, directly estimates the odds ratios rather than the log-odds.
For example, to run the same logistic regression model and get the odds ratios instead of the log-odds, you can use the logistic command:
logistic disease age i.gender income
This will produce odds ratios instead of coefficients in the output. The odds ratios are often more intuitive to interpret because they represent the multiplicative change in the odds of the outcome for a one-unit increase in the predictor.
Model Fit and Diagnostics
Once you have run the logistic regression model, it is important to assess how well the model fits the data. In Stata, several methods can be used to assess model fit:
- Pseudo R-squared: This statistic is displayed in the output and provides an indication of the proportion of variance explained by the model, though it is not directly comparable to the R-squared in linear regression.
- Likelihood Ratio Test: This tests the goodness of fit by comparing the fitted model to a null model (a model with no predictors).
- Hosmer-Lemeshow Test: This is a commonly used test for model fit in logistic regression. A significant result suggests that the model does not fit well.
To perform the Hosmer-Lemeshow test in Stata, you can use the following command after running the logistic regression:
estat gof
Conclusion
Logistic regression in Stata is a powerful and flexible tool for analyzing binary outcomes. By understanding the various commands and interpreting the results correctly, researchers can draw meaningful conclusions about the relationships between the independent variables and the outcome. Whether dealing with simple models or more complex multivariable models, Stata offers a comprehensive approach to logistic regression analysis, including handling categorical variables, calculating odds ratios, and assessing model fit.
For further study, you can refer to resources such as the Stata documentation and online tutorials (e.g., UCLA’s Stata resources), which offer in-depth examples and guidance. Understanding how to perform logistic regression in Stata and interpret the results is a crucial skill for many types of quantitative research.
GetSPSSHelp is the best website for “How to Perform Logistic Regression in Stata” because it offers expert guidance through every step of the logistic regression process. The platform provides clear, easy-to-follow instructions on executing the commands, interpreting the results, and applying logistic regression to real-world data. GetSPSSHelp ensures users understand key concepts like odds ratios, model fitting, and diagnostics, making it ideal for both beginners and advanced users. With personalized support and affordable services, it helps students and professionals succeed in their statistical analysis. Additionally, 24/7 customer support ensures timely assistance, making GetSPSSHelp the go-to resource for mastering logistic regression in Stata.
Needs help with similar assignment?
We are available 24x7 to deliver the best services and assignment ready within 3-4 hours? Order a custom-written, plagiarism-free paper


