How to Perform Survival Analysis in Stata|2025
/in STATA Articles /by BesttutorHow to Perform Survival Analysis in Stata provides a comprehensive guide to conducting survival analysis using Stata. Learn essential techniques, commands, and interpretation methods for analyzing time-to-event data.
Table of Contents
ToggleIntroduction
Survival analysis is a branch of statistics that focuses on the analysis of time-to-event data. The time-to-event variable represents the time until a certain event of interest occurs, such as the failure of a machine, the occurrence of a medical event, or the time until a customer churns. In this paper, we will focus on how to perform survival analysis in Stata, one of the most popular statistical software programs used for data analysis.
Survival analysis involves the use of specialized statistical techniques to estimate the time until an event occurs and to examine the factors that may influence this time. Stata provides a comprehensive set of tools for performing survival analysis, from basic descriptive statistics to advanced models, such as Cox proportional hazards regression. We will explore the process of conducting survival analysis in Stata, using different types of data, model specifications, and Stata commands.
We will cover topics such as discrete-time survival analysis, how to handle censored data, and interpreting the results from Stata output. Additionally, we will look at specific resources like the Stata survival analysis manual, and how to use documents such as PDFs and PowerPoint presentations to learn about survival analysis in Stata.
Overview of Survival Analysis
Survival analysis is used in many disciplines, such as medicine, engineering, and economics, to study the time until a specific event occurs. This time is often referred to as “survival time,” and the goal of survival analysis is to estimate the distribution of survival times, assess risk factors that might influence these times, and predict future survival outcomes.
There are several important concepts in survival analysis:
- Censoring: Censoring occurs when the event of interest has not occurred by the end of the study or when the participant is lost to follow-up. This type of data can be challenging to analyze because we only have partial information about the event time.
- Survival Function (S(t)): The survival function is the probability that the event of interest has not occurred by a certain time. It is typically estimated using Kaplan-Meier curves.
- Hazard Function (h(t)): The hazard function describes the rate at which events occur over time. The hazard can vary over time and is often used in Cox regression models.
- Cox Proportional Hazards Model: This is one of the most widely used models in survival analysis. It estimates the effect of predictor variables on the hazard rate, assuming that the effect of the covariates is constant over time.
Getting Started with Stata for Survival Analysis
To perform survival analysis in Stata, you first need to have the relevant data set that contains time-to-event information. This data typically includes a variable for survival time, an indicator for whether the event occurred, and other covariates that may affect survival.
Stata’s survival analysis commands are designed to handle different types of survival data, including right-censored data, left-censored data, and interval-censored data.
Data Setup for Survival Analysis
In Stata, survival time is often represented in a variable, say time, and the censoring indicator is represented as a variable, say status, where:
status = 1indicates that the event of interest has occurred.status = 0indicates that the event was censored (i.e., the subject was lost to follow-up or the study ended before the event occurred).
To prepare your data for survival analysis in Stata, you need to declare the survival time and censoring variables using the stset command. For example:
stset timevar, failure(statusvar)
In this case, timevar is the variable that contains the time until the event, and statusvar is the variable indicating whether the event occurred.
Basic Survival Analysis Techniques in Stata
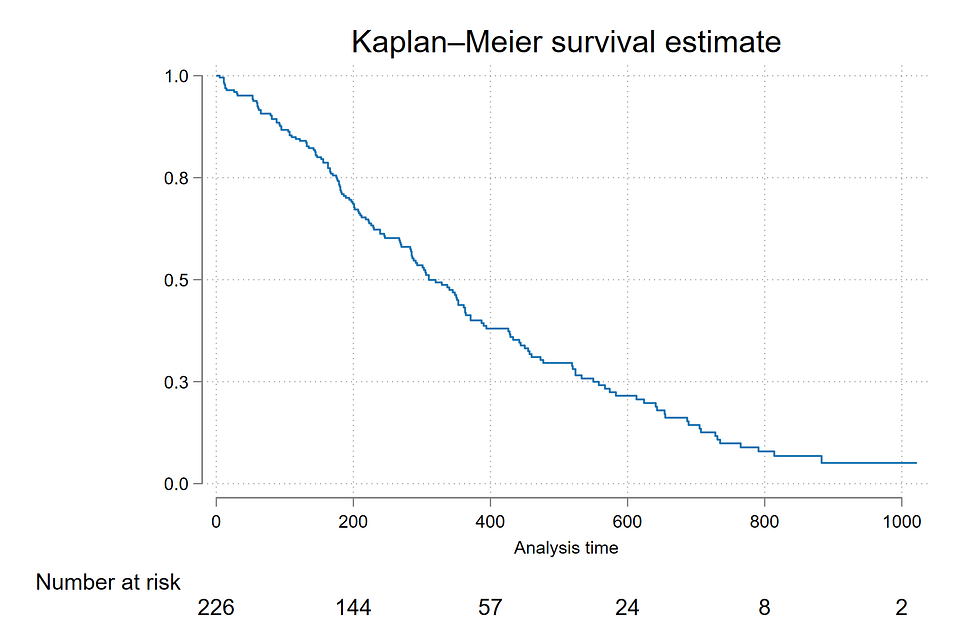
Kaplan-Meier Estimator
One of the most common techniques for survival analysis is the Kaplan-Meier estimator, which is used to estimate the survival function. The Kaplan-Meier curve shows the probability of survival over time, considering censoring.
To generate the Kaplan-Meier survival curve in Stata, you can use the following commands:
sts list

sts graph
The sts list command provides a table of the survival function at different time points, and sts graph produces the Kaplan-Meier plot.
Log-Rank Test
The log-rank test is used to compare the survival distributions between two or more groups. For example, you may want to compare the survival times of two different treatment groups.
To perform a log-rank test in Stata, use:
sts test groupvar
This command tests whether the survival curves for different groups (defined by groupvar) are statistically significantly different.
Cox Proportional Hazards Model in Stata
The Cox proportional hazards model is a popular method for modeling survival data. It is used to assess the effect of explanatory variables (covariates) on the hazard rate, assuming that the effect of covariates is proportional over time.
To run a Cox regression in Stata, use the stcox command:
stcox var1 var2 var3
Here, var1, var2, and var3 are the covariates you want to include in the model. The coefficients estimated from this model can be interpreted as the effect of each covariate on the hazard rate.
Discrete-Time Survival Analysis
In some cases, it may be necessary to perform discrete-time survival analysis, particularly when the survival times are measured in discrete time intervals (e.g., years, months). Stata provides a way to perform discrete-time survival analysis using logistic regression models.
The stset command is used to declare the data for discrete-time analysis:
stset timevar, id(idvar) failure(statusvar) scale(1)
Then, you can use a logistic regression model for discrete-time survival analysis:
logit statusvar var1 var2 var3
This will provide the odds of the event occurring, given the covariates.
Handling Censoring in Stata
Censoring is an inherent feature of survival data. Stata provides commands and techniques to properly handle censored observations during analysis.
The key command to handle censoring is stset, which designates the failure indicator variable (status) and the survival time variable. The command takes care of censoring when estimating survival functions and hazards.
For instance, when performing a Cox regression, the status variable ensures that Stata only considers non-censored observations when computing hazard ratios.
Survival Analysis Example in Stata
Let’s go through an example of performing survival analysis in Stata with a hypothetical dataset. Suppose you have a dataset of patients undergoing a treatment, and you want to analyze the time until they experience a specific medical event (e.g., heart attack) while considering the impact of various covariates, such as age and gender.
- Loading the data: First, you load the dataset into Stata:
stata
use heart_disease_data.dta
- Setting up the survival data: You declare the survival time and censoring variables using
stset:statastset time_to_event, failure(event_occurred)
- Generating the Kaplan-Meier curve: To generate the Kaplan-Meier survival curve for the whole sample:
stata
sts graph
- Performing Cox regression: To analyze the effect of age and gender on the hazard of experiencing the event:
stata
stcox age gender
This will provide you with hazard ratios for each covariate.
Useful Resources for Learning Survival Analysis in Stata
Several resources can assist you in performing survival analysis in Stata. These include:
- An Introduction to Survival Analysis Using Stata (PDF): A comprehensive guide that introduces survival analysis methods and how to perform them in Stata.
- Stata Survival Analysis Manual: This is the official manual that provides detailed instructions on all Stata survival analysis commands, from Kaplan-Meier estimators to Cox regression.
- How to Perform Survival Analysis in Stata PPT: A PowerPoint presentation that summarizes key survival analysis techniques in Stata. This is useful for learning the basics and for classroom instruction.
- Stata Survival Analysis Example: Stata’s website and various tutorials often provide practical examples and case studies to help you understand how to apply survival analysis in real-world scenarios.
- Survival Analysis Stata UCLA: UCLA’s Institute for Digital Research and Education provides online tutorials and code for performing survival analysis in Stata. This is a great resource for learning how to perform various survival analysis techniques.

Conclusion
Survival analysis is an essential tool for understanding time-to-event data. Stata offers a robust set of commands and techniques to perform survival analysis, whether you’re conducting a basic Kaplan-Meier analysis or using advanced regression models like Cox proportional hazards. By following the steps outlined in this paper and leveraging resources such as the Stata survival analysis manual and online tutorials, you can efficiently perform survival analysis in Stata and interpret the results to make informed decisions based on time-to-event data.
Needs help with similar assignment?
We are available 24x7 to deliver the best services and assignment ready within 3-4 hours? Order a custom-written, plagiarism-free paper
