How to Perform Spearman Correlation in R|2025
/in R Articles /by BesttutorLearn How to Perform Spearman Correlation in R with step-by-step instructions. Discover how to measure relationships between variables using R programming.
Spearman correlation, also known as Spearman’s rank correlation coefficient, is a statistical measure used to assess the strength and direction of the association between two variables. Unlike Pearson’s correlation, which measures linear relationships, Spearman’s correlation is a non-parametric measure, meaning it does not require the data to be normally distributed. It is used primarily when the relationship between the variables is monotonic (either increasing or decreasing), and it measures the degree to which the ranks of the two variables are related.
In this paper, we will discuss how to perform Spearman correlation in R, how to visualize the correlation using plots, how to interpret the results, and the conditions under which Spearman correlation is appropriate. Additionally, we will explore how to perform this correlation in other statistical software like SPSS and SPS, as well as how to interpret the results when multiple variables are involved.
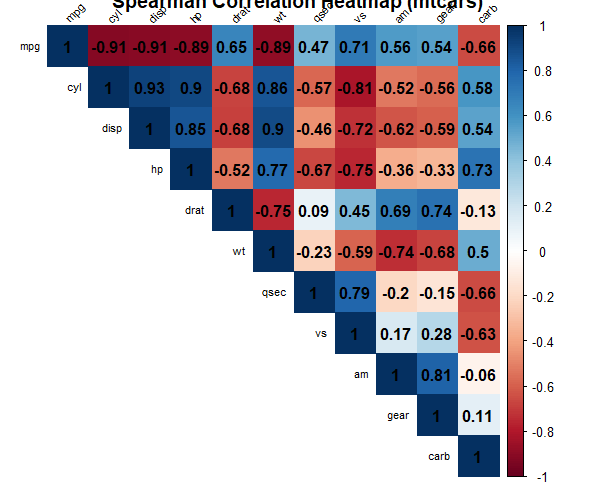
Table of Contents
ToggleUnderstanding Spearman Correlation
Before diving into the technicalities of performing Spearman correlation in R, it is important to understand the underlying concept. Spearman’s rank correlation coefficient, denoted as ρ\rhoρ, is a measure of correlation based on the ranked values of the data, rather than the raw values themselves.
Mathematically, Spearman’s rank correlation is calculated using the following formula:
ρ=1−6∑di2n(n2−1)\rho = 1 – \frac{6 \sum d_i^2}{n(n^2-1)}ρ=1−n(n2−1)6∑di2Where:
- did_idi is the difference between the ranks of the two variables for each observation.
- nnn is the number of observations.
Why Use Spearman Correlation?
Spearman correlation is particularly useful in situations where the data is not normally distributed or when the relationship between variables is not linear. It is also a good choice when dealing with ordinal data or when the assumption of homoscedasticity (constant variance) is violated, which is a requirement for Pearson’s correlation.
In addition, Spearman correlation is useful in cases where:
- The data includes outliers, which can heavily influence Pearson’s correlation.
- The relationship between the variables is non-linear but still monotonic (i.e., consistently increasing or decreasing).
How to Perform Spearman Correlation in R
To perform Spearman correlation in R, you can use the cor() function, which calculates the correlation between two variables. The syntax for Spearman correlation in R is as follows:
cor(x, y, method = "spearman")
Here:
xandyare the variables you want to correlate.- The
methodparameter specifies the correlation method. To calculate Spearman correlation, usemethod = "spearman".
Example: Performing Spearman Correlation in R
Let’s assume you have a dataset of two variables, x and y, and you want to calculate the Spearman correlation between them.
# Example dataset

x <- c(1, 2, 3, 4, 5)

y <- c(5, 4, 3, 2, 1)correlation <- cor(x, y, method = “spearman”)
print(correlation)
In this example, the variables x and y are perfectly negatively correlated, so the Spearman correlation coefficient will be close to -1.
How to Perform Spearman Correlation in SPSS
In SPSS, Spearman correlation can be calculated through the following steps:
- Open your dataset in SPSS.
- Click on Analyze > Correlate > Bivariate.
- In the Bivariate Correlations dialog box, select the variables for which you want to compute the Spearman correlation.
- Under the Correlation Coefficients section, check the Spearman option.
- Click OK to run the analysis.
SPSS will then generate a correlation matrix showing the Spearman correlation coefficient between the selected variables.
How to Plot Spearman Correlation in R
Visualizing the correlation between two variables can help in understanding the nature of their relationship. In R, you can plot the relationship between two variables using the plot() function, but to visualize the Spearman correlation more clearly, a scatter plot with a smooth line or a correlation heatmap is typically used.
Scatter Plot Example
Here is an example of plotting a scatter plot in R to visualize the Spearman correlation:
# Example dataset

x <- c(1, 2, 3, 4, 5)

y <- c(5, 4, 3, 2, 1)plot(x, y, main = “Spearman Correlation”, xlab = “X”, ylab = “Y”, pch = 19, col = “blue”)
abline(lm(y ~ x), col = “red”)
This will create a scatter plot of the two variables with a red line representing the relationship. The Spearman correlation can be visually interpreted by the trend in the plot (whether the points show a monotonic increase or decrease).
Correlation Matrix Heatmap
If you are dealing with multiple variables and want to visualize the Spearman correlation between all pairs of variables, you can create a correlation matrix heatmap.
# Example dataset with multiple variables

data <- data.frame(

x = c(1, 2, 3, 4, 5),

y = c(5, 4, 3, 2, 1),

z = c(2, 3, 4, 5, 6)

)cor_matrix <- cor(data, method = “spearman”)
install.packages(“corrplot”)
library(corrplot)
corrplot(cor_matrix, method = “circle”, type = “lower”, order = “hclust”,
col = colorRampPalette(c(“red”, “white”, “blue”))(200))
This will generate a heatmap showing the correlation coefficients between all pairs of variables, with colors indicating the strength of the correlation.
Spearman Correlation for Multiple Variables
When dealing with multiple variables, you may want to calculate the Spearman correlation for all pairs of variables in your dataset. You can use the cor() function to compute a correlation matrix for all variables at once.
# Example dataset with multiple variables

data <- data.frame(

x = c(1, 2, 3, 4, 5),

y = c(5, 4, 3, 2, 1),

z = c(2, 3, 4, 5, 6)

)cor_matrix <- cor(data, method = “spearman”)
print(cor_matrix)
This will output a correlation matrix where each cell represents the Spearman correlation coefficient between the corresponding variables.
Spearman Correlation Interpretation
The Spearman correlation coefficient ranges from -1 to +1:
- A coefficient of +1 indicates a perfect positive monotonic relationship (as one variable increases, the other also increases).
- A coefficient of -1 indicates a perfect negative monotonic relationship (as one variable increases, the other decreases).
- A coefficient of 0 indicates no monotonic relationship.
The closer the coefficient is to +1 or -1, the stronger the monotonic relationship between the two variables.
Example of Interpretation
Let’s consider the following Spearman correlation results:
- Correlation between
xandy: -1 - Correlation between
xandz: +0.8 - Correlation between
yandz: -0.6
From this, we can interpret:
xandyhave a perfect negative monotonic relationship.xandzhave a strong positive monotonic relationship.yandzhave a moderate negative monotonic relationship.
When to Use Spearman Correlation
Spearman correlation is suitable in the following situations:
- When the data is ordinal (i.e., the values have a meaningful order but not necessarily a consistent interval).
- When the relationship between variables is monotonic but not necessarily linear.
- When the data contains outliers that might distort Pearson’s correlation.
- When the data does not meet the assumptions of normality or linearity required for Pearson’s correlation.
It is important to note that Spearman correlation only measures the strength and direction of a monotonic relationship. It does not capture non-monotonic relationships, nor does it imply causation.
Conclusion
Spearman correlation is a valuable tool in statistics when dealing with non-parametric data or when the relationship between variables is not linear. In R, performing Spearman correlation is straightforward using the cor() function, and visualizing the correlation can be done using scatter plots or correlation matrix heatmaps. Understanding how to interpret the correlation results is crucial for drawing meaningful conclusions about the relationships between variables.
When performing statistical analyses, it is important to choose the appropriate correlation method based on the nature of your data and the assumptions underlying the test. Spearman correlation is a versatile method that can be applied to a wide range of datasets and research questions, making it a useful tool in many fields of study.
By following the steps outlined in this paper, you can confidently perform and interpret Spearman correlation in R, SPSS, or other statistical software.
Needs help with similar assignment?
We are available 24x7 to deliver the best services and assignment ready within 3-4 hours? Order a custom-written, plagiarism-free paper
