Using Power Query in Excel for Data Transformation and Analysis|2025
Master using Power Query in Excel for data transformation and analysis. Learn how to clean, merge, and shape data efficiently to streamline your analysis and enhance your Excel projects!
Microsoft Excel’s Power Query is a robust tool for data transformation and analysis. With its intuitive interface and powerful capabilities, Power Query simplifies the process of importing, cleaning, and analyzing data from various sources. In this comprehensive guide, we’ll cover how to use Power Query effectively, provide examples, and address common questions like “How to open Power Query in Excel” and “How to add Power Query in Excel.” For additional resources, explore PDFs like “Using Power Query in Excel for Data Transformation and Analysis PDF.”
What Is Power Query?
Power Query is a data connectivity and transformation tool in Excel. It enables users to import data from multiple sources, clean and transform it, and load it into Excel for further analysis. With features tailored for repetitive tasks, Power Query can save time and enhance productivity.
Key Features
- Connects to various data sources, including databases, web pages, and Excel files.
- Offers powerful transformation capabilities without needing advanced coding skills.
- Automates repetitive tasks using saved queries.
How to Add Power Query in Excel
Depending on your Excel version, Power Query may already be available. Here’s how to ensure it’s set up:
Excel 2016 and Later
- Power Query is integrated into the Data tab under the Get & Transform section.
Excel 2013 and 2010
- Download and install the Power Query add-in from the Microsoft website.
- After installation, you’ll find it in the Power Query tab.
How to Open Power Query in Excel
To start using Power Query:
- Go to the Data tab.
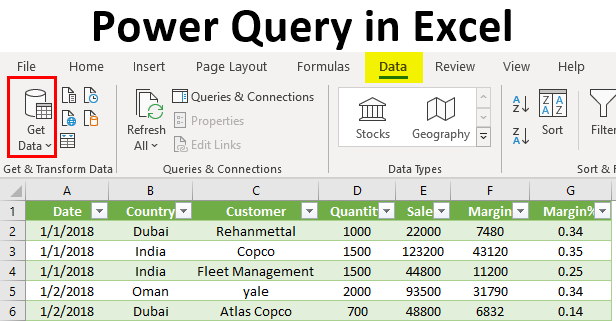
- Click on Get Data to access various data sources.
- Select Launch Power Query Editor to open the interface for transformations.
Using Power Query in Excel for Data Transformation and Analysis
Power Query simplifies complex data manipulation tasks. Here are key steps:
Import Data
- Click Get Data from the Data tab.
- Choose a source (e.g., Excel file, database, or web).
- Preview and select the data to load.
Transform Data
Use the Power Query Editor to:
- Remove Duplicates: Eliminate redundant rows.
- Split Columns: Divide data using delimiters like commas or spaces.
- Merge Queries: Combine datasets from different sources.
- Replace Values: Automatically clean erroneous or missing values.
Load Data
After transforming, load the data into Excel:
- Click Close & Load to export it into a worksheet.
Using Power Query in Excel for Data Transformation and Analysis Examples
Example 1: Cleaning Sales Data
Scenario: A company’s sales data includes duplicates and missing values.
Steps:
- Import the sales dataset.
- Remove duplicates using the Remove Rows feature.
- Fill missing values using Fill Down or Replace Values.
- Load the cleaned data back into Excel.
Example 2: Combining Data from Multiple Files
Scenario: Monthly reports are stored in separate Excel files.
Steps:
- Use Get Data → From Folder to import all files.
- Combine files using the Combine & Transform option.
- Apply transformations and load the data into a new worksheet.
Using Power Query in Excel for Data Transformation and Analysis Formula
Power Query uses the M language for advanced transformations. Some commonly used formulas include:
Add Column Formula
- To calculate a new column:
= Table.AddColumn(Source, "NewColumn", each [Column1] + [Column2])
Replace Values
- Replace errors:
= Table.ReplaceErrorValues(Source, {"ColumnName", "ReplacementValue"})
Filter Rows
- Filter data:
= Table.SelectRows(Source, each [ColumnName] > 100)
Power Query Excel Examples
Merging Customer Data
Scenario: Merge customer details from two tables. Steps:
- Load both tables into Power Query.
- Use the Merge Queries option, selecting a common column (e.g., Customer ID).
- Expand the merged data to include desired fields.
Creating a Sales Forecast
Scenario: Predict sales trends. Steps:
- Import historical sales data.
- Create a Custom Column for forecast calculations.
- Load the processed data for visualization in PivotTables.
Power Query Tutorial PDF
For offline learning, search for tutorials and guides like “Power Query Tutorial PDF.” These resources offer step-by-step instructions and practical examples to enhance your skills.
Benefits of Power Query for Data Transformation
Automation
Power Query saves time by automating repetitive tasks. Once a query is created, it can be reused with updated data.
Scalability
Handle large datasets with ease, leveraging Power Query’s efficiency to process millions of rows.
Integration
Seamlessly integrate data from multiple sources, creating a unified dataset for analysis.
How to Use Power Query in Excel for Business Insights
Data Consolidation
Combine sales, inventory, and customer feedback data for holistic business insights.
Trend Analysis
Transform raw data into actionable insights by visualizing trends over time.
Reporting
Prepare cleaned and consolidated datasets for dynamic reporting using PivotTables and dashboards.
Final Thoughts
Power Query in Excel is a game-changer for data transformation and analysis. Whether you’re cleaning data, merging files, or creating advanced transformations, Power Query makes it intuitive and efficient. Enhance your skills further by exploring resources like “Using Power Query in Excel for Data Transformation and Analysis PDF” or “Power Query Tutorial PDF.”
For assistance with Excel assignments or case studies, visit GetSPSSHelp.com. Our experts are ready to guide you through complex tasks, ensuring you maximize Power Query’s potential.
Needs help with similar assignment?
We are available 24x7 to deliver the best services and assignment ready within 3-4 hours? Order a custom-written, plagiarism-free paper


