How to Create Interactive Reports Using Excel for Your Advanced Assignments|2025
Learn how to create interactive reports using Excel. Discover powerful techniques for building dynamic, data-driven reports with interactive charts, slicers, and pivot tables for better insights and decision-making. Excel is a versatile tool that can transform raw data into compelling, interactive reports. With features such as dashboards, charts, and automation, Excel enables users to present data insights effectively. This guide explores how to create interactive reports in Excel for advanced assignments, offering step-by-step instructions and examples to help you succeed.
Understanding Interactive Reports in Excel
Interactive reports are dynamic tools that allow users to manipulate data views without altering the underlying data. They provide:
- Real-time insights: Updated automatically based on data changes.
- User engagement: Enable filters, slicers, and buttons for exploration.
- Professional presentation: Visually appealing and informative layouts.
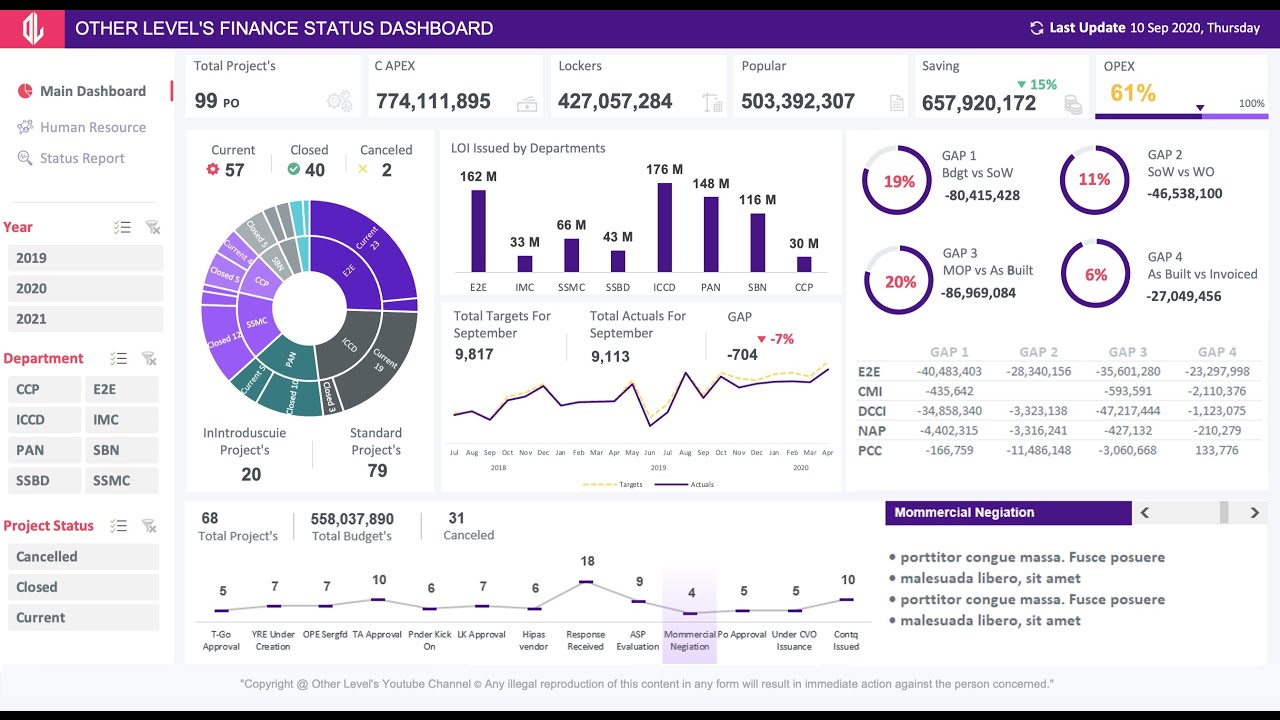
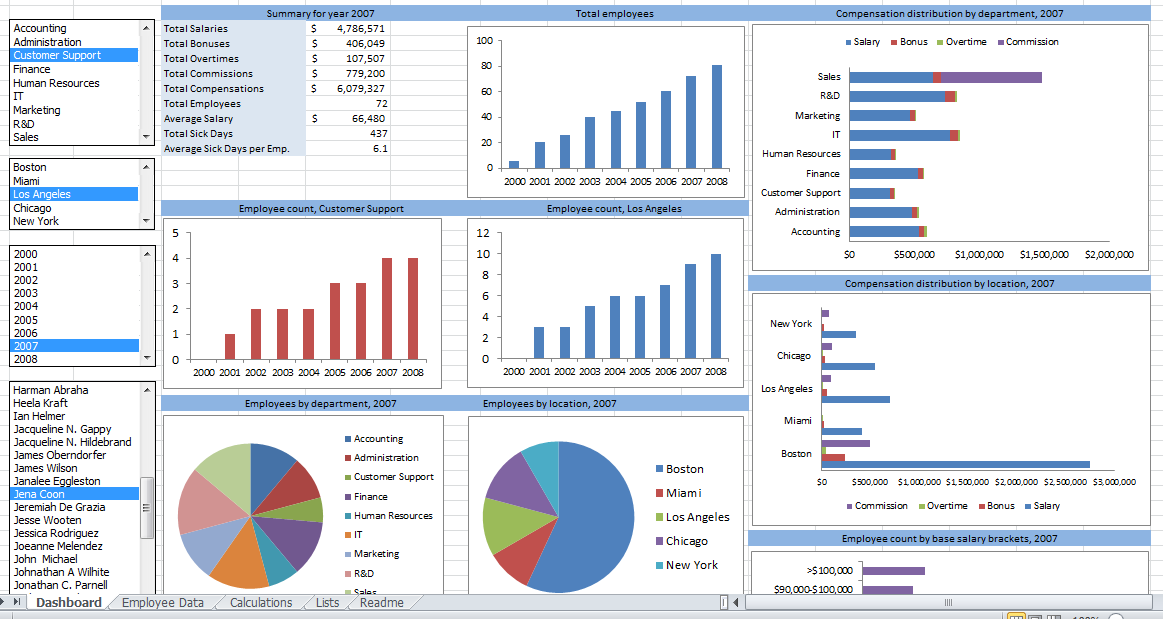
How to Create a Dashboard in Excel That Updates Automatically
Step-by-Step Process:
- Organize Your Data:
- Use structured tables for consistency.
- Ensure data is clean, with no empty rows or columns.
- Create a Data Model:
- Import data from multiple sources if needed.
- Use
Power Queryto transform and clean data.
- Design the Dashboard Layout:
- Plan sections for charts, KPIs, and filters.
- Reserve space for user controls (e.g., slicers).
- Add Interactive Elements:
- Use slicers for filtering data.
- Insert dropdown menus or form controls for dynamic inputs.
- Automate Updates:
- Link charts and tables to your data model.
- Enable auto-refresh for external data sources.
How to Create a Dashboard in Excel Without Pivot Tables
While Pivot Tables are powerful, dashboards can also be built without them:
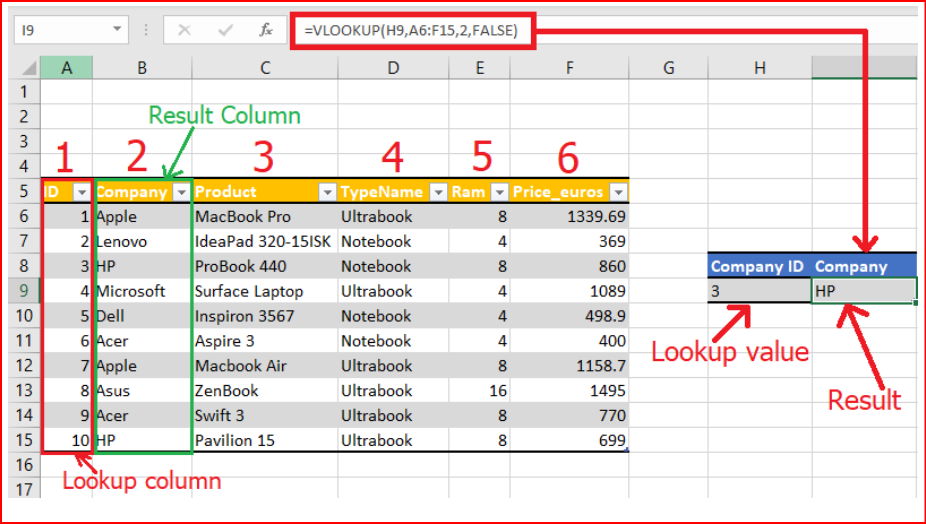
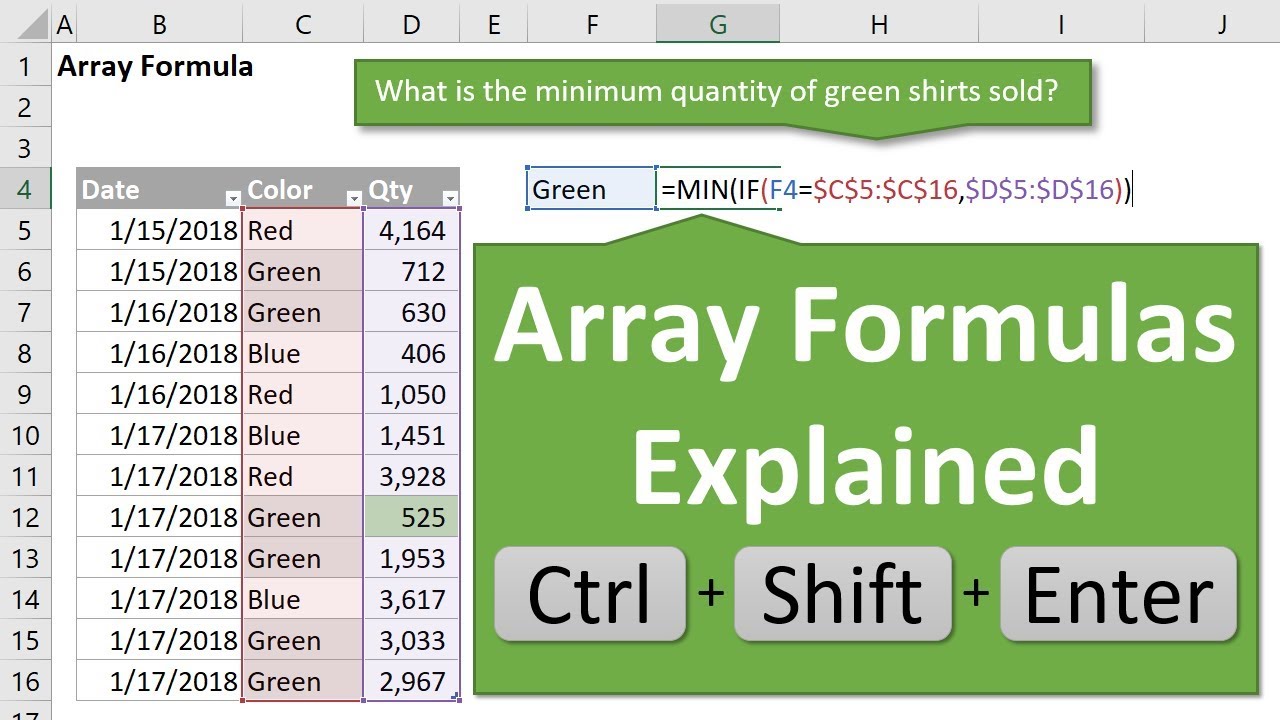
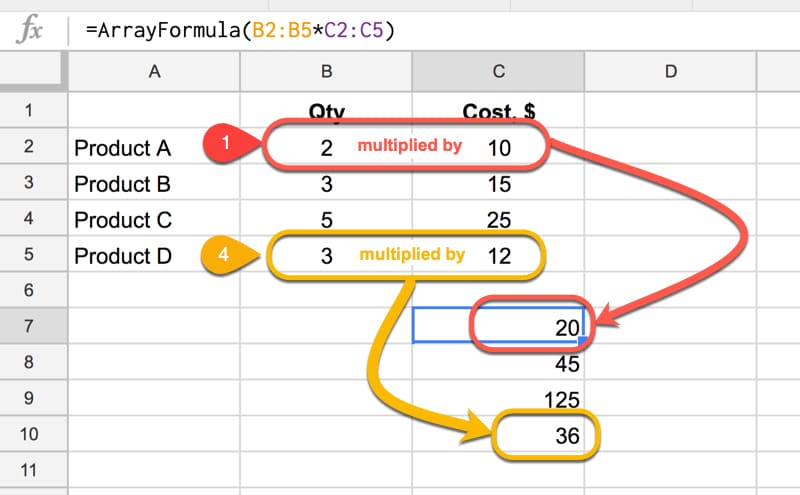
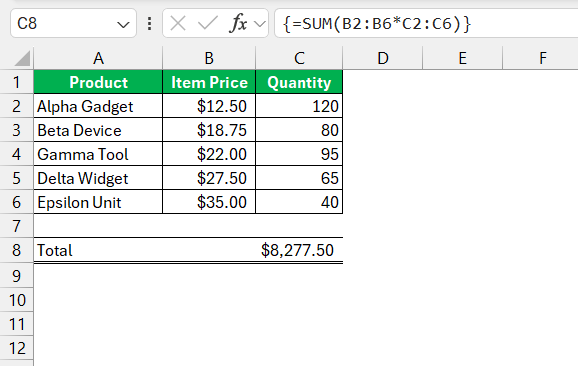
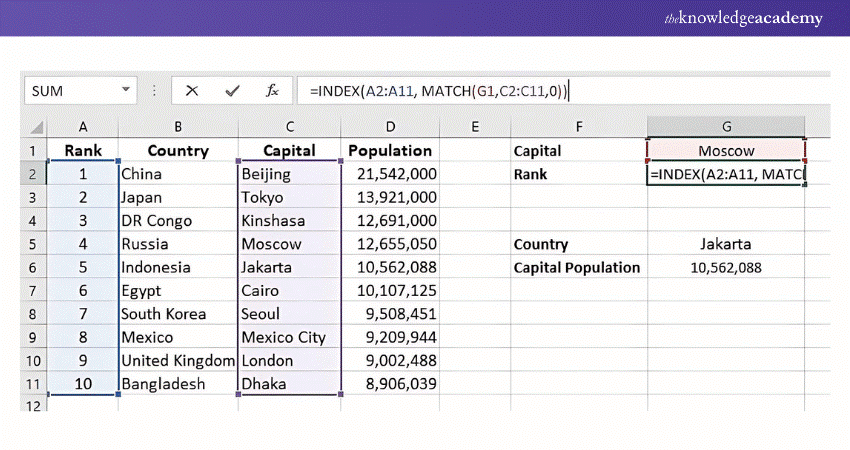
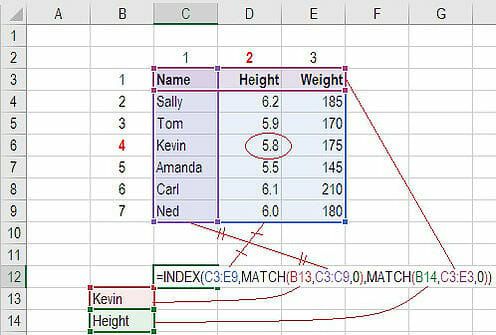
- Use Formulas: Employ
SUMIF,COUNTIF, andINDEX-MATCHto summarize data. - Dynamic Ranges: Create dynamic named ranges for scalable reports.
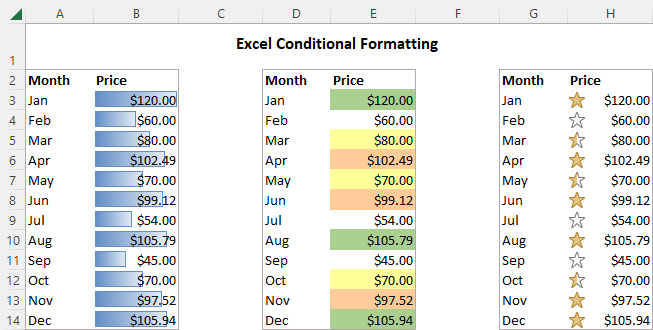
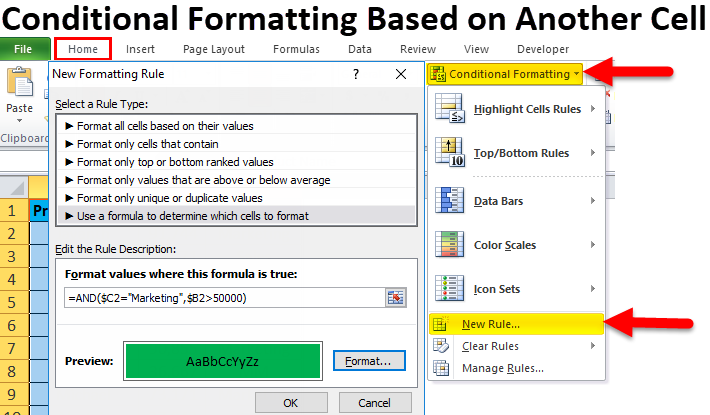
- Conditional Formatting: Highlight key metrics dynamically.
Excel Dashboard Templates Free
Templates simplify the creation process:
- Downloadable Templates: Access pre-built Excel dashboards for:
- Sales performance.
- Financial analysis.
- Project management.
- Customization Tips: Modify colors, charts, and formulas to suit your needs.

How to Create an Excel Dashboard for Beginners
Easy-to-Follow Steps:
- Start Simple: Focus on one data source and key metrics.
- Choose the Right Visuals: Use bar charts, pie charts, and line graphs.
- Use Built-In Features:
- Apply slicers to filter data.
- Use
Data Validationfor dropdown menus.
- Test Your Dashboard: Ensure all elements respond correctly to user inputs.
Create Dashboard in Excel Using Pivot Tables
Pivot Tables offer flexibility for summarizing data:
- Insert Pivot Table: Select your data range and choose “Insert Pivot Table.”
- Customize Fields: Drag and drop fields into rows, columns, and values.
- Create Charts: Convert Pivot Table outputs into dynamic visuals.
- Link Slicers: Connect multiple Pivot Tables to slicers for unified control.
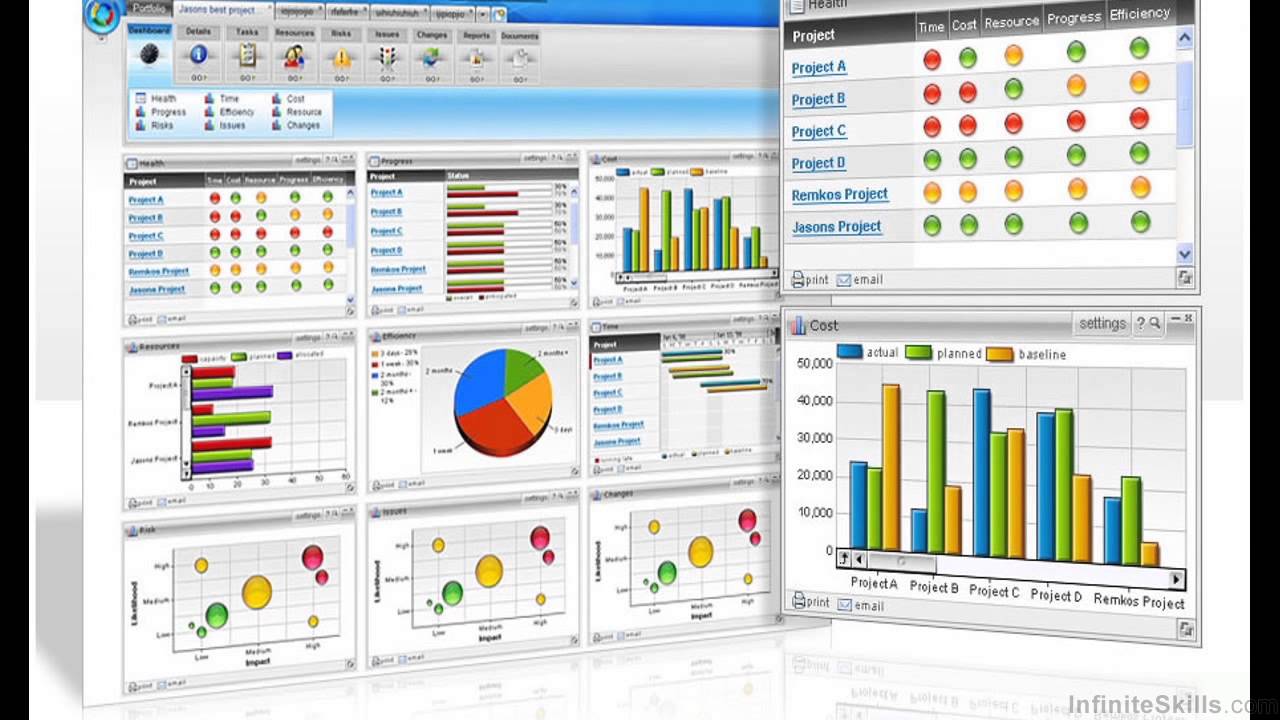
Dynamic Dashboard in Excel
Dynamic dashboards respond instantly to data changes. Key techniques include:
- Using
OFFSETandINDIRECTFunctions: Create dynamic ranges for charts and tables. - Automation with Macros: Write VBA scripts to update dashboards.
- Interactive Buttons: Add buttons for navigation or resetting filters.
Advanced Tools for Interactive Reporting
Power Query:
- Clean, combine, and transform data seamlessly.
- Automate data refresh with minimal effort.
Power Pivot:
- Manage large datasets using the Data Model.
- Create relationships between tables for advanced analysis.
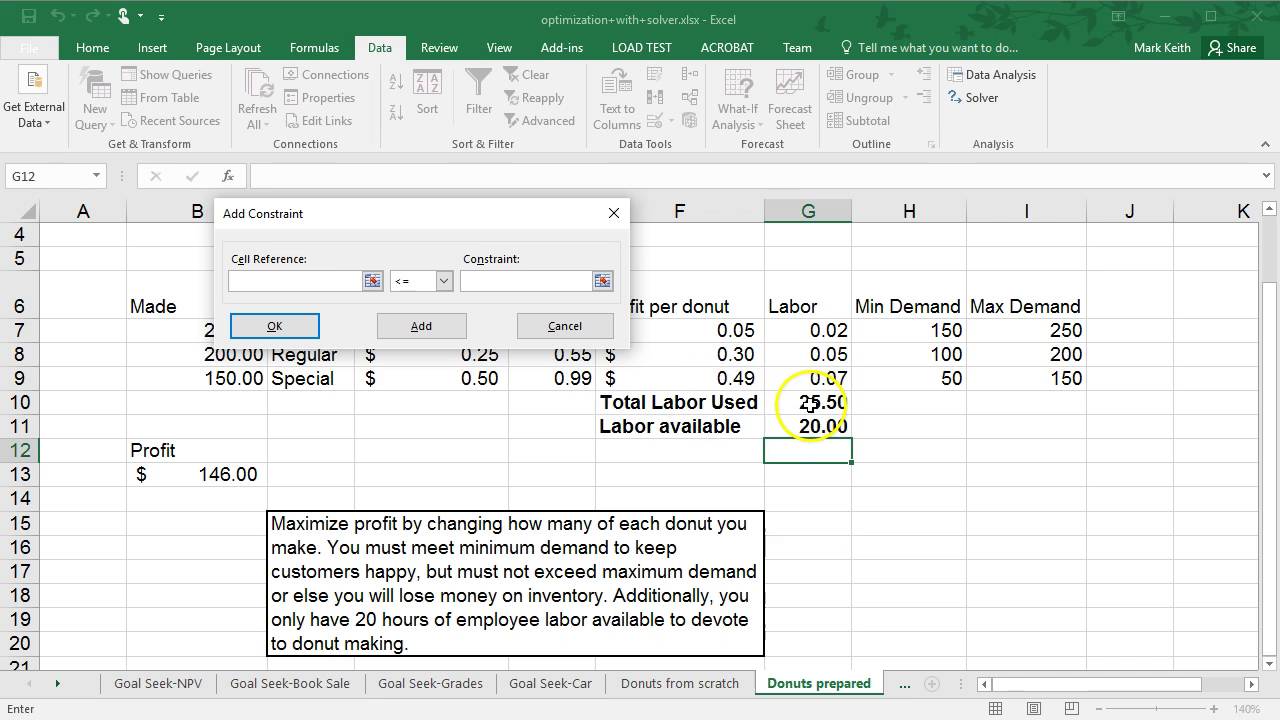
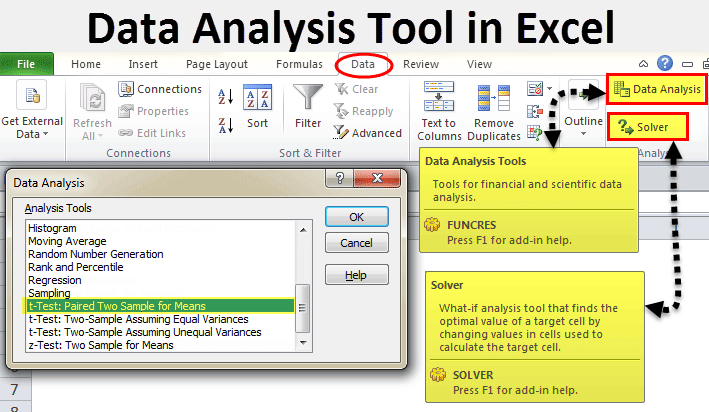
Excel Add-Ins:
- Enhance functionality with add-ins like
SolverorAnalysis ToolPak.

How to Create Dashboard in Excel – YouTube Tutorials
Benefits of Video Learning:
- Visual demonstrations of complex techniques.
- Step-by-step guides tailored to specific use cases.
Recommended Channels:
- “Microsoft Excel Tutorials” for comprehensive lessons.
- “ExcelIsFun” for detailed walkthroughs.
Why Choose GetSPSSHelp.com for Advanced Excel Assignments?
Expertise You Can Trust:
- Our professionals excel in creating interactive reports and dashboards.
- We handle complex requirements with precision and efficiency.
Comprehensive Support:
- Access personalized guidance for your assignments.
- Download exclusive templates, tutorials, and PDFs.
Affordable Pricing:
- Competitive rates for students and professionals.
- Discounts for bulk assignments or recurring clients.
Proven Track Record:
- Thousands of satisfied clients across industries and academia.
- Fast turnaround times to meet tight deadlines.
24/7 Availability:
- Reach us anytime for assistance with Excel-related challenges.
- Utilize our live chat, email, or phone support options.
Final Thoughts
Creating interactive reports using Excel is a valuable skill for any advanced assignment. From automated dashboards to dynamic data visuals, the possibilities are endless. If you need expert help, visit GetSPSSHelp.com today. Let us make your Excel assignments seamless and professional!
Needs help with similar assignment?
We are available 24x7 to deliver the best services and assignment ready within 3-4 hours? Order a custom-written, plagiarism-free paper