R Programming Assignment Help: Exploring Resources and Solutions|2025

Get expert R Programming Assignment Help for data analysis, statistics, and coding solutions. Ace your assignments with step-by-step guidance from professionals.

R programming is a widely-used language for statistical computing and data analysis. Its powerful statistical capabilities, combined with its rich ecosystem of libraries, make it an essential tool for students, professionals, and researchers in the field of data science, machine learning, and statistical analysis. However, mastering R programming can be challenging due to its extensive syntax, packages, and application areas. For many students, seeking help with R programming assignments becomes necessary to ensure a thorough understanding of the concepts.

In this paper, we will explore various ways to get R programming assignment help, ranging from free resources to professional tutoring services. We will also discuss some platforms offering R programming homework help and their significance in improving academic performance.


R Programming Assignment Help

The Importance of R Programming in Academia and Industry

R programming is a crucial tool in both academic research and professional industries. It is widely used for data analysis, statistical modeling, and graphical representation of data. Understanding R is often a requirement in fields such as:

  • Data Science: R is a fundamental language for data analysis and machine learning.
  • Statistics: It is the go-to language for statisticians due to its statistical computing capabilities.
  • Research: Academics in various domains leverage R for handling large datasets and conducting complex analyses.

For students, learning R is critical as it can influence their performance in coursework, research, and internships.


R Programming Assignment Help Free: Utilizing Open Resources

While professional help is a great option for those willing to pay, many students seek free R programming assignment help, especially when on a tight budget. There are several resources available online that provide free assistance, including:

  • Online Forums and Communities: Websites like Stack Overflow, Reddit (e.g., r/Rprogramming), and Cross Validated are rich sources of free help. Students can post their questions and receive assistance from experienced programmers and data scientists.
  • Open Educational Resources (OER): Many universities and educational institutions offer free learning materials on R programming. Websites like Coursera, edX, and Khan Academy offer free introductory courses and exercises in R.
  • R Documentation and Tutorials: The official R website provides a wealth of documentation, guides, and tutorials that can assist in understanding specific R functions and syntax. Comprehensive guides, like those found on R-bloggers, can serve as excellent free learning resources.

R Programming Assignment Help PDF: Offline Learning Materials

Another option for students who prefer offline learning materials is downloading R programming assignment help PDFs. There are several books and guides available for download that cater to students and beginners. Some notable resources include:

  • “R for Data Science” by Garrett Grolemund and Hadley Wickham: This free-to-download PDF book is an excellent guide for anyone starting with R programming. It covers fundamental topics such as data wrangling, visualization, and programming.
  • Online PDF repositories: Websites like GitHub, ResearchGate, and academic university websites often provide downloadable PDFs of R tutorials, assignments, and solutions. These PDFs can be used offline and referred to during practical R assignments.

By leveraging such resources, students can learn R programming step by step and work through assignments without relying on online platforms.


R Programming Assignment Help

R Assignments and Solutions: Why They Matter

Practicing R assignments and reviewing solutions is one of the most effective ways of mastering R programming. Many platforms provide solved R programming assignments, enabling students to better understand problem-solving techniques and coding practices in R. Solutions help students break down complex problems, observe the correct structure of the code, and learn best practices for writing efficient and readable R scripts.

Some platforms where students can access R assignments and solutions include:

  • W3Schools: Offers tutorials and sample exercises on R programming, covering a wide range of topics and problems.
  • GeeksforGeeks: Provides assignments and solutions focused on both R basics and advanced topics, along with explanations.
  • R Tutorials: Websites like RStudio’s official tutorial section offer a practical approach to learning R by providing assignments that come with detailed solutions.

Practicing assignments and reviewing the accompanying solutions helps students build confidence and familiarity with R’s functionality.


Java Assignment Help: A Comparison

Although this paper is focused on R programming, it is helpful to compare it with another popular programming language like Java. Many students studying computer science or software engineering may need Java assignment help as well. Java is a general-purpose programming language that is widely used for object-oriented programming, building applications, and Android development.

Java assignments often focus on concepts such as object creation, inheritance, polymorphism, and exception handling, which are fundamentally different from R’s focus on data manipulation, statistics, and visualization. Both languages, however, require a similar approach to problem-solving and debugging.

For students who face challenges in both Java and R, finding resources that help with both programming languages is crucial. Some websites offer multi-language support, making them useful for students working on assignments in both languages.


R Programming Help Online: Professional Support

R programming help online is widely available from various tutoring services. These platforms connect students with experts who can provide tailored solutions to specific assignments or clarify doubts related to R programming concepts. Some of the most popular online tutoring platforms include:

  • Chegg: A well-known academic assistance platform, Chegg offers R programming help online, providing solutions for students’ homework assignments, along with step-by-step explanations.
  • Wyzant: This platform allows students to connect with professional tutors, including R programming tutors near them. You can select tutors based on their expertise, reviews, and hourly rates.
  • Tutor.com: This service provides online R tutors who help students with programming assignments, offering personalized sessions to ensure a deep understanding of the topic.

Online help allows students to get instant assistance with their assignments, offering the flexibility of choosing tutors based on their schedules and needs.


R Programming Tutors Near Me: Finding Local Experts

For students who prefer face-to-face learning or require personalized attention, searching for R programming tutors near me is a viable option. Many universities and educational centers offer local tutoring services in various programming languages, including R.

Local tutors can offer:

  • In-Person Assistance: Personalized face-to-face sessions that make learning more interactive.
  • Specialized Focus: Tutors specializing in data science, statistics, or machine learning can provide niche help tailored to specific areas of R programming.
  • Customized Learning Paths: Tutors can tailor sessions based on a student’s proficiency, enabling them to work through challenging topics at their own pace.

Local tutoring services also offer the advantage of building a personal connection with the tutor, allowing for a more comfortable and productive learning experience.


R Programming Assignment Help

R Homework Help: Completing Assignments Efficiently

R homework help is essential for students to complete their assignments on time and accurately. Many students struggle with the complexity of data analysis problems or statistical models that require advanced R functions. When faced with these challenges, students often seek help online to solve homework efficiently.

Some strategies for efficient R homework completion include:

  • Break Down the Problem: Divide the assignment into smaller tasks, such as data import, cleaning, analysis, and visualization.
  • Use RStudio: RStudio is an integrated development environment (IDE) that simplifies coding and debugging for R programming. It provides essential features like syntax highlighting, autocompletion, and error tracking, making it easier for students to complete assignments.
  • Collaborate with Peers: Discussing problems with peers or online communities can provide new insights into solving homework assignments.

Platforms offering homework help ensure that students can complete their tasks with correct and optimized R code.


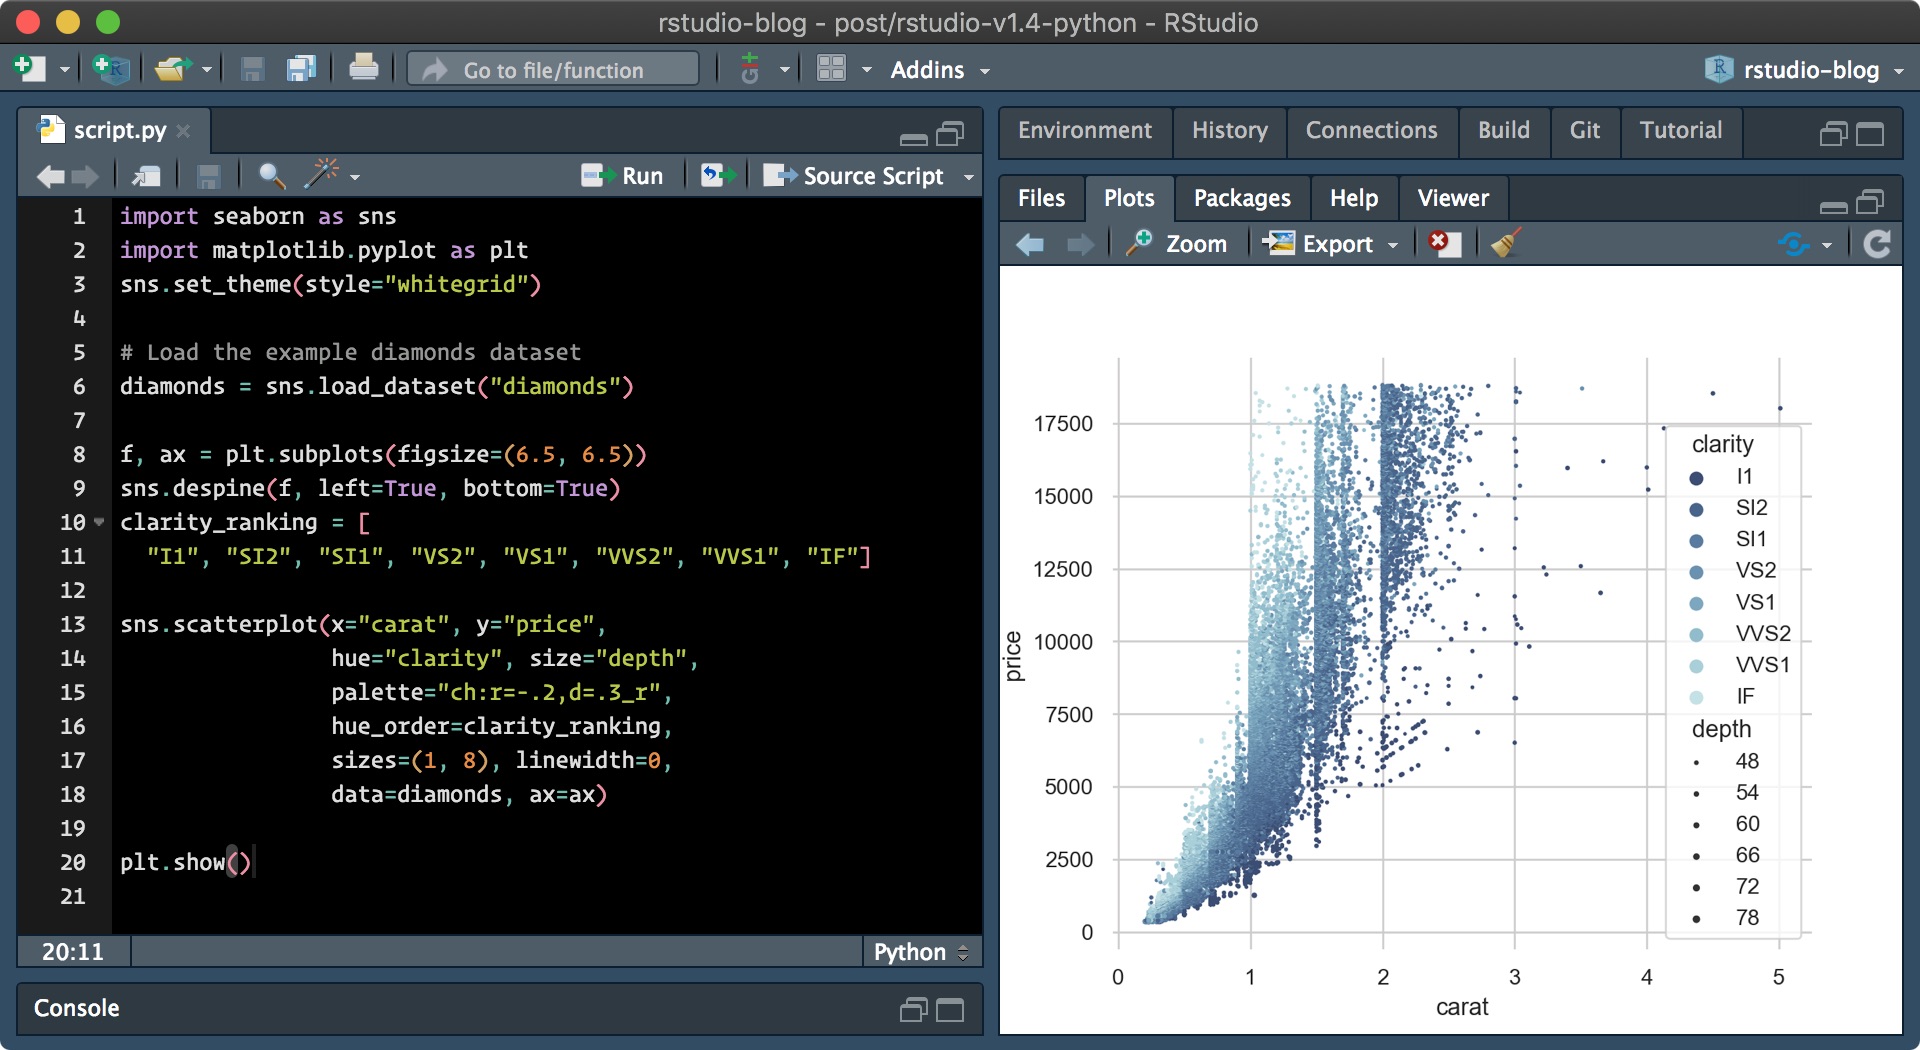
R Studio: A Powerful Tool for R Programming

R Studio is an open-source IDE specifically designed for R programming. It provides an environment that streamlines coding, debugging, and visualization processes, making it a valuable tool for students working on R assignments.

Key features of RStudio that benefit students include:

  • Integrated Environment: The console, script editor, and output viewer are combined in a single window, making it easier to interact with the code.
  • Debugging and Error Handling: RStudio’s debugging tools allow users to step through the code, identify errors, and fix them.
  • Visualization Tools: Students can easily create high-quality plots and graphs to visualize their data using libraries such as ggplot2 and plotly.

Using RStudio makes learning R more intuitive and efficient, especially for students who need to complete assignments with data analysis and graphical representations.

Order Now Images – Browse 36,320 Stock Photos, Vectors, and ...

Conclusion

R programming is a critical skill in data science, statistics, and academic research. However, students often face difficulties when completing R programming assignments due to the complexity of the language and its various applications. Fortunately, there are numerous resources available to assist students in mastering R, including free online forums, downloadable PDFs, tutoring services, and professional help platforms. By utilizing these resources, students can efficiently tackle R programming assignments, gain deeper insights into data analysis, and ultimately improve their academic performance.

Whether seeking free resources or professional tutoring, the key to success in R programming is consistent practice, problem-solving, and utilizing the right tools, such as RStudio. Through dedicated effort and leveraging the support available, students can confidently navigate the world of R programming.

Needs help with similar assignment?

We are available 24x7 to deliver the best services and assignment ready within 3-4 hours? Order a custom-written, plagiarism-free paper

Get Answer Over WhatsApp Order Paper Now

How to Perform Repeated Measures ANOVA in R|2025

Learn How to Perform Repeated Measures ANOVA in R with step-by-step guidance. Analyze within-subject data, test differences, and interpret results accurately.

Repeated Measures Analysis of Variance (ANOVA) is a statistical technique used when the same subjects are repeatedly measured under different conditions or over time. This approach is useful when dealing with data collected from the same subjects multiple times, ensuring that any variance between measurements due to different conditions can be accurately analyzed. In R, repeated measures ANOVA can be performed using various functions and packages, providing flexible options for conducting statistical analysis in a variety of research settings.

In this paper, we will explore the process of performing repeated measures ANOVA in R, including one-way, two-way, and three-way repeated measures designs. We will also demonstrate how to conduct within-subjects ANOVA in R and compare this method to other platforms like SPSS. The examples provided will guide the reader on how to implement repeated measures ANOVA in R using relevant functions.

How to Perform Repeated Measures ANOVA in R

Types of Repeated Measures ANOVA

One-Way Repeated Measures ANOVA

A one-way repeated measures ANOVA is used when there is one independent variable with multiple levels (conditions) measured within the same subjects. The purpose is to assess whether there is a significant difference in means across the different levels of the independent variable. In R, this can be performed using the aov() function, which is part of the base R package.

Example: One-Way Repeated Measures ANOVA in R

Consider a study measuring the effect of different teaching methods on students’ scores. The independent variable, “teaching method,” has three levels (Method A, Method B, Method C), and each student is tested using all three methods.

r
# Example data
students <- rep(1:10, each=3) # 10 students, each tested under 3 methods
method <- factor(rep(c("Method A", "Method B", "Method C"), times=10)) # Teaching methods
score <- c(80, 85, 88, 75, 80, 82, 90, 92, 94, 70, 78, 85, 88, 91, 93, 85, 86, 89, 95, 97, 85, 89, 92, 93, 98, 100, 85, 88, 90, 92)
# Data frame
data <- data.frame(students, method, score)# Perform one-way repeated measures ANOVA
anova_result <- aov(score ~ method + Error(students / method), data=data)
summary(anova_result)

In the above example, we use the Error() function to specify that the measurements are repeated within subjects, which is essential for conducting repeated measures ANOVA. The result will provide an F-value and p-value, helping us determine whether there is a significant effect of teaching method on students’ scores.

Two-Way Repeated Measures ANOVA

A two-way repeated measures ANOVA is used when there are two independent variables with multiple levels, and both factors are measured within the same subjects. This type of analysis allows researchers to assess both the main effects of each independent variable and the interaction effect between them.

Example: Two-Way Repeated Measures ANOVA in R

Imagine a study analyzing the effects of teaching method (Method A, B, C) and time (pre-test, post-test) on students’ scores.

r
# Example data for two-way repeated measures ANOVA
students <- rep(1:10, each=6)
method <- factor(rep(c("Method A", "Method B", "Method C"), each=2, times=10))
time <- factor(rep(c("Pre-test", "Post-test"), times=30))
score <- c(80, 85, 90, 92, 94, 98, 75, 78, 81, 86, 88, 92, 90, 92, 95, 93, 95, 97, 85, 87, 92, 94, 98, 100, 85, 90, 92, 93, 95, 100, 91, 93, 96, 99, 94, 95, 97)
# Data frame
data <- data.frame(students, method, time, score)# Perform two-way repeated measures ANOVA
anova_result_2way <- aov(score ~ method * time + Error(students / (method * time)), data=data)
summary(anova_result_2way)

Here, the model tests the interaction effect between the teaching method and time, alongside their individual main effects. The output will allow us to identify whether there are significant differences in the students’ scores due to either teaching method, time, or the interaction between both factors.

How to Perform Repeated Measures ANOVA in R

Three-Way Repeated Measures ANOVA

A three-way repeated measures ANOVA involves three independent variables, each with multiple levels. This is appropriate when researchers wish to investigate the interaction between three factors and their combined effect on the dependent variable.

Example: Three-Way Repeated Measures ANOVA in R

Imagine a scenario where researchers are studying the effects of teaching method (Method A, B, C), time (pre-test, post-test), and gender (Male, Female) on students’ scores.

r
# Example data for three-way repeated measures ANOVA
students <- rep(1:10, each=12)
method <- factor(rep(c("Method A", "Method B", "Method C"), each=4, times=10))
time <- factor(rep(c("Pre-test", "Post-test"), each=6, times=10))
gender <- factor(rep(c("Male", "Female"), each=12, times=5))
score <- c(80, 85, 88, 90, 92, 94, 85, 88, 89, 93, 95, 97, 75, 78, 80, 84, 86, 88, 70, 72, 74, 76, 78, 80, 85, 88, 90, 92, 91, 94, 95, 97, 78, 80, 82, 85, 87, 89)
# Data frame
data <- data.frame(students, method, time, gender, score)# Perform three-way repeated measures ANOVA
anova_result_3way <- aov(score ~ method * time * gender + Error(students / (method * time * gender)), data=data)
summary(anova_result_3way)

This model tests the three-way interaction between teaching method, time, and gender, as well as the main effects of each variable. By analyzing the output, researchers can determine the most significant factors affecting students’ scores.

How to Perform Repeated Measures ANOVA in R

Performing Repeated Measures ANOVA Online

There are several online tools and platforms available for performing repeated measures ANOVA. Some of these platforms provide easy-to-use interfaces that can be accessed without the need for programming knowledge. Examples include:

  • SPSS: A powerful software for statistical analysis that allows researchers to perform repeated measures ANOVA through a graphical interface. It is widely used in social science research and provides extensive options for analyzing complex data.
  • JASP: An open-source statistics software that provides a user-friendly interface for repeated measures ANOVA. It offers Bayesian statistics as well as frequentist methods.
  • RStudio Cloud: RStudio’s cloud-based platform can be used to run R scripts, including repeated measures ANOVA, in an online environment. This allows users to access R and RStudio without needing to install them locally.

Repeated Measures ANOVA in SPSS

While R provides a flexible and powerful platform for repeated measures ANOVA, SPSS is another popular tool widely used in various disciplines. To perform repeated measures ANOVA in SPSS, follow these steps:

  1. Enter Data: Organize your data such that each condition or time point is in a separate column.
  2. Analyze: Navigate to the “Analyze” menu, select “General Linear Model,” and then choose “Repeated Measures.”
  3. Define Within-Subjects Factor: Specify the within-subjects factor (e.g., time or condition) and the number of levels.
  4. Add Variables: Assign the variables to the appropriate within-subjects factor.
  5. Run the Analysis: Click “OK” to run the analysis and view the results, which include the main effects and interactions.

Within-Subjects ANOVA in R

A within-subjects design refers to an experiment where each participant is exposed to all conditions or measurements. This type of design is a common application of repeated measures ANOVA. In R, performing within-subjects ANOVA is similar to the examples provided above, with the key difference being the focus on analyzing the differences within the same participants across conditions or time points.

r
# Example for within-subjects ANOVA in R
students <- rep(1:10, each=3)
condition <- factor(rep(c("Condition A", "Condition B", "Condition C"), times=10))
score <- c(80, 85, 90, 75, 78, 82, 85, 88, 90, 78, 82, 85, 80, 85, 87, 90, 92, 95, 88, 91, 94, 96, 82, 84, 87, 88, 91, 95)
# Data frame
data <- data.frame(students, condition, score)# Perform within-subjects ANOVA
anova_result_within <- aov(score ~ condition + Error(students / condition), data=data)
summary(anova_result_within)

This analysis assesses whether the different conditions (e.g., Condition A, B, and C) significantly impact the scores of participants while controlling for individual differences.

How to Perform Repeated Measures ANOVA in R

Conclusion

Repeated measures ANOVA is a valuable statistical tool for analyzing data from repeated observations or measurements on the same subjects. In R, this technique can be performed using functions like aov() in one-way, two-way, and three-way designs. These designs help researchers assess the effects of one or more independent variables on a dependent variable, considering both main and interaction effects.

By understanding how to perform repeated measures ANOVA in R, researchers can gain insights into the complex dynamics between variables in within-subjects designs, contributing to a deeper understanding of their study’s phenomena. While R offers a powerful and flexible platform, alternatives like SPSS and online tools provide convenient ways to perform similar analyses.

Needs help with similar assignment?

We are available 24x7 to deliver the best services and assignment ready within 3-4 hours? Order a custom-written, plagiarism-free paper

Get Answer Over WhatsApp Order Paper Now

How to Perform Paired Samples t-Test in R: A Comprehensive Guide|2025

Learn How to Perform Paired Samples t-Test in R with step-by-step instructions. Analyze dependent data, compare means, and interpret results accurately.

The paired samples t-test is a statistical method used to compare two related groups or measurements. It is commonly employed in situations where researchers are comparing the means of two related variables, such as pre- and post-treatment measurements, or measurements from the same subjects under different conditions. In R, the paired t-test can be performed using a variety of methods, and this paper will explore the steps involved in conducting a paired samples t-test in R. We will also delve into additional considerations, such as performing paired t-tests by group, dealing with multiple paired t-tests, and understanding Cohen’s d for paired t-tests.

How to Perform Paired Samples t-Test in R

Introduction to Paired Samples t-Test

A paired samples t-test (also known as the dependent samples t-test) is used when the observations in one sample are paired or matched with observations in another sample. For instance, a researcher may measure the same individuals at two different points in time, before and after an intervention. The goal is to determine whether there is a significant difference in the means between the two sets of observations.

The paired t-test assumes that the differences between the paired observations are approximately normally distributed. The test calculates the difference between each pair of observations, and then it evaluates whether the average difference is significantly different from zero. If the p-value is smaller than the chosen significance level (typically 0.05), the null hypothesis that there is no difference in means can be rejected.

Steps for Performing a Paired Samples t-Test in R

Preparing the Data

Before performing a paired t-test in R, the data must be in an appropriate format. The paired t-test requires two variables, where each observation in one variable has a corresponding observation in the other variable. The data should either be in wide format or long format.

  • Wide format: This format has two columns, each representing one of the paired variables (e.g., pre-test and post-test scores).
  • Long format: This format has a single column for the paired variable and a separate grouping variable indicating which of the two conditions the value represents (e.g., a “time” variable with values like pre-test and post-test).

The first step is to load the necessary data and check its structure using the str() function in R.

r
# Example data
data <- data.frame(
pre_test = c(56, 78, 65, 55, 89),
post_test = c(62, 80, 72, 60, 91)
)
# Checking the structure of the data
str(data)

Conducting a Paired Samples t-Test

Once the data is prepared, the paired samples t-test can be conducted using the t.test() function in R. The general syntax for the paired t-test is as follows:

r
t.test(x, y, paired = TRUE)

Here, x and y are the two variables representing the paired observations. The paired = TRUE argument specifies that the test is for paired data.

r
# Conducting the paired samples t-test
result <- t.test(data$pre_test, data$post_test, paired = TRUE)
# Displaying the results
print(result)

The output from this test will include the t-statistic, degrees of freedom (df), p-value, and the confidence interval for the mean difference. The key piece of information here is the p-value, which will help determine whether there is a statistically significant difference between the two sets of data.

How to Perform Paired Samples t-Test in R

Understanding the Output

The output from the paired samples t-test will contain several components:

  • t-value: This is the test statistic calculated from the data.
  • df (degrees of freedom): This is the number of paired observations minus one.
  • p-value: This tells us whether the difference between the means is statistically significant.
  • Confidence Interval: This provides the range within which the true mean difference lies, with a specified level of confidence (usually 95%).

For example, the output might look like this:

r

Paired t-test

data: data$pre_test and data$post_test
t = 3.7222, df = 4, pvalue = 0.016
alternative hypothesis: true difference in means is not equal to 0
95 percent confidence interval:
10.98 1.02
sample estimates:
mean of the differences
5.98

In this case, the p-value is 0.016, which is less than 0.05, indicating that there is a statistically significant difference between the pre-test and post-test scores.

Conducting a Paired t-Test by Group

Sometimes, it may be necessary to perform a paired t-test within different groups of a dataset. For instance, you might want to perform a paired t-test separately for males and females or other subgroups. In this case, you can subset the data and perform the paired t-test for each group.

r
# Example dataset with group variable
data <- data.frame(
gender = c("Male", "Male", "Female", "Female", "Male"),
pre_test = c(56, 78, 65, 55, 89),
post_test = c(62, 80, 72, 60, 91)
)
# Perform paired t-test by gender
t.test(data$pre_test[data$gender == “Male”], data$post_test[data$gender == “Male”], paired = TRUE)
t.test(data$pre_test[data$gender == “Female”], data$post_test[data$gender == “Female”], paired = TRUE)

This will perform a separate paired t-test for males and females, allowing for a more detailed comparison.

Multiple Paired t-Tests in R

If you need to conduct multiple paired t-tests, it’s important to adjust for the possibility of Type I errors (false positives). A common approach is to apply a correction method such as the Bonferroni correction or the Holm method to adjust the p-values.

r
# Performing multiple paired t-tests
result1 <- t.test(data$pre_test, data$post_test, paired = TRUE)
result2 <- t.test(data$pre_test, data$post_test + 5, paired = TRUE)
# Applying Bonferroni correction
p_values <- c(result1$p.value, result2$p.value)
p_adjusted <- p.adjust(p_values, method = “bonferroni”)
print(p_adjusted)

How to Perform Paired Samples t-Test in R

Independent t-Test in R

An independent t-test is used when comparing the means of two independent groups. Unlike the paired t-test, which is used for related samples, the independent t-test is used when the samples are independent of each other. The t.test() function can also be used to perform an independent t-test by setting the paired argument to FALSE.

r
# Independent t-test
t.test(data$pre_test, data$post_test, paired = FALSE)

This test will assess whether there is a significant difference in the means of the two independent groups.

Cohen’s d for Paired t-Test in R

Cohen’s d is a measure of effect size that quantifies the magnitude of the difference between two groups. For a paired t-test, Cohen’s d is calculated as the mean difference divided by the standard deviation of the differences.

r
# Calculating Cohen's d for paired t-test
diff <- data$pre_test - data$post_test
cohen_d <- mean(diff) / sd(diff)
print(cohen_d)

A Cohen’s d value of 0.2 is considered a small effect, 0.5 is medium, and 0.8 is large.

R Paired t-Test Long Format

When the data is in long format, the paired t-test can still be performed by reshaping the data appropriately. The reshape() function in R can be used to convert long format data to wide format, or you can use the ggplot2 package to visualize the results before testing.

r
# Example long format data
data_long <- data.frame(
id = rep(1:5, each = 2),
time = rep(c("pre", "post"), 5),
score = c(56, 62, 78, 80, 65, 72, 55, 60, 89, 91)
)
# Reshaping data to wide format
data_wide <- reshape(data_long, timevar = “time”, idvar = “id”, direction = “wide”)
print(data_wide)# Perform paired t-test on reshaped data
t.test(data_wide$score.pre, data_wide$score.post, paired = TRUE)

How to Perform Paired Samples t-Test in R

Common Error: “Cannot Use ‘Paired’ in Formula Method”

A common issue when performing a paired t-test in R is encountering the error message: “cannot use ‘paired’ in formula method.” This happens when the data is not properly structured for a paired test. To resolve this, ensure that the two variables being compared are passed directly to the t.test() function, rather than using a formula interface.

r
# Incorrect usage
t.test(score ~ time, data = data_long, paired = TRUE)
# Correct usage
t.test(data_wide$score.pre, data_wide$score.post, paired = TRUE)

Conclusion

The paired samples t-test is a powerful tool for comparing two related sets of data, and R provides a flexible and easy way to perform these analyses. By preparing the data in an appropriate format, using the t.test() function, and understanding the output, researchers can draw meaningful conclusions about the differences between paired observations. In addition, performing paired t-tests by group, conducting multiple t-tests, calculating Cohen’s d for effect size, and handling long format data are all essential skills for conducting comprehensive statistical analyses.

Needs help with similar assignment?

We are available 24x7 to deliver the best services and assignment ready within 3-4 hours? Order a custom-written, plagiarism-free paper

Get Answer Over WhatsApp Order Paper Now

How to Perform an Independent Sample T-Test in R|2025

Learn How to Perform an Independent Sample T-Test in R with step-by-step instructions. Analyze group differences and interpret results accurately using R.

The independent sample t-test is a statistical method used to determine if there are any statistically significant differences between the means of two independent groups. This test is widely used in various fields, including psychology, healthcare, and social sciences, to analyze experimental and observational data. In this paper, we will explore how to perform an independent sample t-test in R, a powerful statistical computing software, and contrast it with similar functions found in SPSS and other software packages. Additionally, we will provide examples and the essential steps involved in performing this test.


How to Perform an Independent Sample T-Test in R

Understanding the Independent Sample T-Test

An independent sample t-test, also called a two-sample t-test, compares the means of two independent groups to determine if there is a significant difference between them. It assumes that:

  1. The two samples are independent of each other.
  2. The data is approximately normally distributed.
  3. The variances of the two groups are equal (though this can be relaxed using Welch’s t-test).

A classic example of an independent sample t-test is comparing the mean test scores of two different groups of students, say, one group taught with traditional methods and the other using online learning techniques.

Key Terminology:

  • Null Hypothesis (H₀): There is no significant difference between the means of the two groups.
  • Alternative Hypothesis (H₁): There is a significant difference between the means of the two groups.
  • P-value: A probability that helps in making inferences about the null hypothesis. If the p-value is less than the significance level (usually 0.05), we reject the null hypothesis.

How to Perform an Independent Sample T-Test in R

R is a versatile tool for statistical analysis, offering several functions and packages that can perform an independent sample t-test. Let’s break down the steps involved in performing an independent sample t-test in R.

Step 1: Install Necessary Packages (If Required)

In most cases, you won’t need to install additional packages for performing the t-test, as R’s base package provides the necessary functions. However, for more advanced visualizations or data manipulation, you might want to use ggplot2, dplyr, or tidyr.

R
install.packages("ggplot2")
install.packages("dplyr")

You can load these packages using:

R
library(ggplot2)
library(dplyr)

Step 2: Data Preparation

For an independent sample t-test, you need two independent groups with numeric values. Let’s consider an example where we are comparing the scores of two different teaching methods. You might have the following data:

R
# Example dataset
group1 <- c(80, 85, 90, 92, 88, 79, 84, 93, 95)
group2 <- c(72, 76, 74, 77, 70, 78, 71, 73, 69)

These two vectors represent the scores of Group 1 and Group 2, respectively. Make sure the data is cleaned and formatted before performing the test.

Step 3: Perform the Independent Sample T-Test

R offers the t.test() function to perform a t-test. You need to specify the two groups you want to compare. For an independent sample t-test, you simply pass the two vectors as arguments.

R
# Perform the independent sample t-test
result <- t.test(group1, group2)
print(result)

The function returns several key statistics, including:

  • t-value: The test statistic
  • df: The degrees of freedom
  • p-value: The probability of observing the data under the null hypothesis
  • Confidence Interval: The range of values where the true population mean difference likely falls
  • Mean of Group 1 and Group 2

How to Perform an Independent Sample T-Test in R

Step 4: Check for Assumptions

Before interpreting the t-test result, it’s essential to check if the assumptions for performing an independent sample t-test are met:

  1. Normality: Both groups should be approximately normally distributed. You can use visualizations like histograms or Q-Q plots to assess normality.
R
# Plotting histograms for each group
hist(group1, main="Group 1", xlab="Scores", col="lightblue")
hist(group2, main="Group 2", xlab="Scores", col="lightgreen")
  1. Equal Variances: Check if the variances of the two groups are equal using the var.test() function. If the p-value is greater than 0.05, you can assume that the variances are equal.
R
# Test for equal variances
var_test_result <- var.test(group1, group2)
print(var_test_result)

If the assumption of equal variances is violated, use Welch’s t-test by setting var.equal = FALSE in the t.test() function:

R
# Welch's t-test (if variances are unequal)
result <- t.test(group1, group2, var.equal = FALSE)
print(result)

Step 5: Interpreting Results

The t.test() function output includes:

  • t-value: The calculated t-statistic
  • df (degrees of freedom): The number of independent values that can vary in the analysis
  • p-value: If less than 0.05, reject the null hypothesis
  • Confidence Interval: The range in which the true mean difference likely lies
  • Means of both groups: Compare the average scores of each group.

A typical result might look like this:

R

Two Sample t-test

data: group1 and group2
t = 2.5037, df = 14.963, pvalue = 0.02534
alternative hypothesis: true difference in means is not equal to 0
95 percent confidence interval:
0.673 10.927
sample estimates:
mean of x mean of y
86.25 73.75

In this case, the p-value is 0.02534, which is less than the 0.05 significance level, indicating a statistically significant difference between the two groups.


How to Perform an Independent Sample T-Test in R

Independent Sample T-Test in SPSS

In addition to R, SPSS is another popular tool for statistical analysis, and performing an independent sample t-test in SPSS is straightforward. To run an independent sample t-test in SPSS:

  1. Go to Analyze > Compare Means > Independent-Samples T Test.
  2. Move the dependent variable (e.g., test scores) into the Test Variable box.
  3. Move the grouping variable (e.g., teaching method) into the Grouping Variable box.
  4. Define the groups by clicking Define Groups and specifying the two groups.
  5. Click OK to generate the output.

SPSS will return a table with the t-statistic, degrees of freedom, and p-value, similar to R’s output.


Paired Sample T-Test in R

While the independent sample t-test compares two independent groups, the paired sample t-test is used when there are two related groups. For example, comparing pre-test and post-test scores of the same individuals. The process for performing a paired sample t-test in R is similar:

R
# Example paired data
pre_test <- c(70, 80, 85, 90, 75)
post_test <- c(75, 85, 90, 95, 80)
# Perform paired sample t-test
result <- t.test(pre_test, post_test, paired = TRUE)
print(result)

This will return the t-statistic, degrees of freedom, p-value, and confidence interval for the paired data.


Example of Two Independent Sample T-Test

Here’s an example of how to interpret an independent sample t-test for two independent groups:

  • Group 1 (New Teaching Method): Scores = [80, 85, 90, 92, 88, 79, 84, 93, 95]
  • Group 2 (Traditional Teaching Method): Scores = [72, 76, 74, 77, 70, 78, 71, 73, 69]

The t-test shows a p-value of 0.02534, which means there is a statistically significant difference between the two teaching methods.


How to Perform an Independent Sample T-Test in R

Conclusion

The independent sample t-test in R is a powerful tool for comparing the means of two independent groups. By following the steps outlined above, you can perform an independent sample t-test in R, interpret the results, and draw meaningful conclusions. It is important to assess the assumptions of normality and equal variance before performing the test to ensure accurate results. Understanding how to use this test in different software tools, such as R and SPSS, will help you perform statistical analysis with confidence.

Needs help with similar assignment?

We are available 24x7 to deliver the best services and assignment ready within 3-4 hours? Order a custom-written, plagiarism-free paper

Get Answer Over WhatsApp Order Paper Now

How to Perform Spearman Correlation in R|2025

Learn How to Perform Spearman Correlation in R with step-by-step instructions. Discover how to measure relationships between variables using R programming.

Spearman correlation, also known as Spearman’s rank correlation coefficient, is a statistical measure used to assess the strength and direction of the association between two variables. Unlike Pearson’s correlation, which measures linear relationships, Spearman’s correlation is a non-parametric measure, meaning it does not require the data to be normally distributed. It is used primarily when the relationship between the variables is monotonic (either increasing or decreasing), and it measures the degree to which the ranks of the two variables are related.

In this paper, we will discuss how to perform Spearman correlation in R, how to visualize the correlation using plots, how to interpret the results, and the conditions under which Spearman correlation is appropriate. Additionally, we will explore how to perform this correlation in other statistical software like SPSS and SPS, as well as how to interpret the results when multiple variables are involved.

How to Perform Spearman Correlation in R

Understanding Spearman Correlation

Before diving into the technicalities of performing Spearman correlation in R, it is important to understand the underlying concept. Spearman’s rank correlation coefficient, denoted as ρ\rho, is a measure of correlation based on the ranked values of the data, rather than the raw values themselves.

Mathematically, Spearman’s rank correlation is calculated using the following formula:

ρ=1−6∑di2n(n2−1)\rho = 1 – \frac{6 \sum d_i^2}{n(n^2-1)}Where:

  • did_i is the difference between the ranks of the two variables for each observation.
  • nn is the number of observations.

Why Use Spearman Correlation?

Spearman correlation is particularly useful in situations where the data is not normally distributed or when the relationship between variables is not linear. It is also a good choice when dealing with ordinal data or when the assumption of homoscedasticity (constant variance) is violated, which is a requirement for Pearson’s correlation.

In addition, Spearman correlation is useful in cases where:

  • The data includes outliers, which can heavily influence Pearson’s correlation.
  • The relationship between the variables is non-linear but still monotonic (i.e., consistently increasing or decreasing).

How to Perform Spearman Correlation in R

To perform Spearman correlation in R, you can use the cor() function, which calculates the correlation between two variables. The syntax for Spearman correlation in R is as follows:

r
cor(x, y, method = "spearman")

Here:

  • x and y are the variables you want to correlate.
  • The method parameter specifies the correlation method. To calculate Spearman correlation, use method = "spearman".

Example: Performing Spearman Correlation in R

Let’s assume you have a dataset of two variables, x and y, and you want to calculate the Spearman correlation between them.

r
# Example dataset
x <- c(1, 2, 3, 4, 5)
y <- c(5, 4, 3, 2, 1)
# Calculate Spearman correlation
correlation <- cor(x, y, method = “spearman”)# Display the result
print(correlation)

In this example, the variables x and y are perfectly negatively correlated, so the Spearman correlation coefficient will be close to -1.

How to Perform Spearman Correlation in R

How to Perform Spearman Correlation in SPSS

In SPSS, Spearman correlation can be calculated through the following steps:

  1. Open your dataset in SPSS.
  2. Click on Analyze > Correlate > Bivariate.
  3. In the Bivariate Correlations dialog box, select the variables for which you want to compute the Spearman correlation.
  4. Under the Correlation Coefficients section, check the Spearman option.
  5. Click OK to run the analysis.

SPSS will then generate a correlation matrix showing the Spearman correlation coefficient between the selected variables.

How to Plot Spearman Correlation in R

Visualizing the correlation between two variables can help in understanding the nature of their relationship. In R, you can plot the relationship between two variables using the plot() function, but to visualize the Spearman correlation more clearly, a scatter plot with a smooth line or a correlation heatmap is typically used.

Scatter Plot Example

Here is an example of plotting a scatter plot in R to visualize the Spearman correlation:

r
# Example dataset
x <- c(1, 2, 3, 4, 5)
y <- c(5, 4, 3, 2, 1)
# Create a scatter plot
plot(x, y, main = “Spearman Correlation”, xlab = “X”, ylab = “Y”, pch = 19, col = “blue”)# Add a smooth line
abline(lm(y ~ x), col = “red”)

This will create a scatter plot of the two variables with a red line representing the relationship. The Spearman correlation can be visually interpreted by the trend in the plot (whether the points show a monotonic increase or decrease).

Correlation Matrix Heatmap

If you are dealing with multiple variables and want to visualize the Spearman correlation between all pairs of variables, you can create a correlation matrix heatmap.

r
# Example dataset with multiple variables
data <- data.frame(
x = c(1, 2, 3, 4, 5),
y = c(5, 4, 3, 2, 1),
z = c(2, 3, 4, 5, 6)
)
# Calculate Spearman correlation matrix
cor_matrix <- cor(data, method = “spearman”)# Install and load the ‘corrplot’ package for heatmap
install.packages(“corrplot”)
library(corrplot)

# Plot the correlation matrix
corrplot(cor_matrix, method = “circle”, type = “lower”, order = “hclust”,
col = colorRampPalette(c(“red”, “white”, “blue”))(200))

This will generate a heatmap showing the correlation coefficients between all pairs of variables, with colors indicating the strength of the correlation.

Spearman Correlation for Multiple Variables

When dealing with multiple variables, you may want to calculate the Spearman correlation for all pairs of variables in your dataset. You can use the cor() function to compute a correlation matrix for all variables at once.

r
# Example dataset with multiple variables
data <- data.frame(
x = c(1, 2, 3, 4, 5),
y = c(5, 4, 3, 2, 1),
z = c(2, 3, 4, 5, 6)
)
# Calculate Spearman correlation matrix for all variables
cor_matrix <- cor(data, method = “spearman”)# Display the correlation matrix
print(cor_matrix)

This will output a correlation matrix where each cell represents the Spearman correlation coefficient between the corresponding variables.

Spearman Correlation Interpretation

The Spearman correlation coefficient ranges from -1 to +1:

  • A coefficient of +1 indicates a perfect positive monotonic relationship (as one variable increases, the other also increases).
  • A coefficient of -1 indicates a perfect negative monotonic relationship (as one variable increases, the other decreases).
  • A coefficient of 0 indicates no monotonic relationship.

The closer the coefficient is to +1 or -1, the stronger the monotonic relationship between the two variables.

Example of Interpretation

Let’s consider the following Spearman correlation results:

  • Correlation between x and y: -1
  • Correlation between x and z: +0.8
  • Correlation between y and z: -0.6

From this, we can interpret:

  • x and y have a perfect negative monotonic relationship.
  • x and z have a strong positive monotonic relationship.
  • y and z have a moderate negative monotonic relationship.

How to Perform Spearman Correlation in R

When to Use Spearman Correlation

Spearman correlation is suitable in the following situations:

  • When the data is ordinal (i.e., the values have a meaningful order but not necessarily a consistent interval).
  • When the relationship between variables is monotonic but not necessarily linear.
  • When the data contains outliers that might distort Pearson’s correlation.
  • When the data does not meet the assumptions of normality or linearity required for Pearson’s correlation.

It is important to note that Spearman correlation only measures the strength and direction of a monotonic relationship. It does not capture non-monotonic relationships, nor does it imply causation.

Conclusion

Spearman correlation is a valuable tool in statistics when dealing with non-parametric data or when the relationship between variables is not linear. In R, performing Spearman correlation is straightforward using the cor() function, and visualizing the correlation can be done using scatter plots or correlation matrix heatmaps. Understanding how to interpret the correlation results is crucial for drawing meaningful conclusions about the relationships between variables.

When performing statistical analyses, it is important to choose the appropriate correlation method based on the nature of your data and the assumptions underlying the test. Spearman correlation is a versatile method that can be applied to a wide range of datasets and research questions, making it a useful tool in many fields of study.

By following the steps outlined in this paper, you can confidently perform and interpret Spearman correlation in R, SPSS, or other statistical software.

Needs help with similar assignment?

We are available 24x7 to deliver the best services and assignment ready within 3-4 hours? Order a custom-written, plagiarism-free paper

Get Answer Over WhatsApp Order Paper Now

How to Perform Multiple Linear Regression in R: A Step-by-Step Guide|2025

Learn How to Perform Multiple Linear Regression in R with step-by-step guidance. Discover key functions, interpretation, and best practices for accurate analysis.

Multiple linear regression is a statistical technique used to model the relationship between a dependent variable and two or more independent variables. The goal is to predict the value of the dependent variable based on the values of the independent variables. In R, performing multiple linear regression is straightforward and involves using a variety of packages and functions to analyze data. This paper walks through the process of performing multiple linear regression in R, including understanding the syntax, interpreting results, handling categorical variables, and visualizing the model.

How to Perform Multiple Linear Regression in R

Introduction to Multiple Linear Regression

Multiple linear regression is an extension of simple linear regression, where the dependent variable is modeled as a linear combination of multiple independent variables. This technique is widely used in fields like economics, healthcare, and social sciences to understand how different factors affect a particular outcome.

In the context of R, multiple linear regression can be performed easily using the lm() function, which stands for “linear model.” The general formula for multiple linear regression is as follows:

Y=β0+β1X1+β2X2+⋯+βnXn+ϵY = \beta_0 + \beta_1 X_1 + \beta_2 X_2 + \dots + \beta_n X_n + \epsilon

Where:

  • YY is the dependent variable
  • β0\beta_0 is the intercept
  • β1,β2,…,βn\beta_1, \beta_2, \dots, \beta_n are the coefficients of the independent variables X1,X2,…,XnX_1, X_2, \dots, X_n
  • ϵ\epsilon is the error term

How to Perform Multiple Linear Regression in R Step-by-Step

Step 1: Install and Load Necessary Packages

Before performing multiple linear regression, make sure that you have installed the necessary packages. Although the lm() function is part of base R, additional packages such as ggplot2 for visualization can be useful. To install these packages, use the following commands:

R
install.packages("ggplot2")
library(ggplot2)

Step 2: Load the Data

The next step is to load your dataset into R. For this example, we will use a built-in dataset called mtcars, which contains data about different car models, including variables like miles per gallon (mpg), horsepower, and weight. You can load your own dataset by using the read.csv() function.

R
data(mtcars)

Step 3: Inspect the Data

Before proceeding, it is crucial to inspect the data to understand its structure. Use functions like head(), summary(), and str() to take a quick look at the data.

R
head(mtcars)
summary(mtcars)
str(mtcars)

Step 4: Fit the Multiple Linear Regression Model

Now that you have your data, you can fit the multiple linear regression model using the lm() function. In this example, we want to predict the miles per gallon (mpg) based on the other variables in the dataset.

R
model <- lm(mpg ~ wt + hp + qsec + drat, data = mtcars)

In this command:

  • mpg is the dependent variable
  • wt, hp, qsec, and drat are the independent variables
  • data = mtcars specifies that the data is in the mtcars dataset

Step 5: View the Summary of the Model

Once the model is fitted, you can view a summary of the regression results by using the summary() function. This will show important statistics like the coefficients, p-values, R-squared, and adjusted R-squared.

R
summary(model)

The output will display the coefficients for each independent variable, as well as the statistical significance of these variables in predicting mpg.

How to Perform Multiple Linear Regression in R

How to Perform Multiple Linear Regression in R Using the lm() Function

The lm() function in R is a flexible way to perform multiple linear regression. The syntax for this function is as follows:

R
lm(formula, data)
  • formula: A symbolic description of the model (e.g., mpg ~ wt + hp)
  • data: The dataset containing the variables

In the previous example, the formula mpg ~ wt + hp + qsec + drat is used to predict mpg based on four predictors. The function will return a linear model object that contains the fitted regression coefficients and other important statistics.

Multiple Linear Regression in R with ggplot2

Visualizing the results of multiple linear regression can help understand the relationships between variables. ggplot2 is a powerful visualization package in R that can be used to create a range of plots, including those to visualize regression models.

Step 1: Basic Scatter Plot

A simple scatter plot can be created to visualize the relationship between the dependent and independent variables. For instance, to plot mpg against wt, use:

R
ggplot(mtcars, aes(x = wt, y = mpg)) +
geom_point() +
geom_smooth(method = "lm", se = FALSE)

In this plot:

  • aes(x = wt, y = mpg) defines the axes
  • geom_point() adds the scatter points
  • geom_smooth(method = "lm") adds the regression line

Step 2: Multiple Regression Plot

When dealing with multiple predictors, it can be challenging to visualize the relationship directly. However, you can create pair plots for a subset of variables to see how they relate to each other.

R
ggpairs(mtcars[, c("mpg", "wt", "hp", "qsec")])

This will generate a matrix of scatter plots, showing pairwise relationships between the selected variables.

How to Plot Multiple Linear Regression in R

To visualize a multiple linear regression model with more than one independent variable, you can plot residuals or use diagnostic plots. The plot() function in R allows you to generate residual plots, leverage plots, and Q-Q plots to evaluate the model’s fit.

R
plot(model)

This will display:

  • A residuals vs. fitted values plot
  • A normal Q-Q plot for the residuals
  • A scale-location plot
  • A Cook’s distance plot

These plots help identify problems like heteroscedasticity, non-normality, or influential data points.

Interpreting Multiple Linear Regression Results in R

Interpreting the results of a multiple linear regression involves understanding the coefficients, p-values, R-squared value, and residuals.

Coefficients

The coefficients represent the change in the dependent variable for a one-unit change in the independent variable. For example, if the coefficient for wt is -3.1, it means that for every unit increase in the weight of a car, the mpg decreases by 3.1 units.

P-values

The p-value tests the null hypothesis that a particular coefficient is zero. If the p-value is less than 0.05, you can reject the null hypothesis and conclude that the variable has a significant effect on the dependent variable.

R-squared

The R-squared value represents the proportion of the variance in the dependent variable that is explained by the independent variables. A higher R-squared value indicates a better fit of the model to the data.

Multiple Linear Regression in R with Categorical Variables

Multiple linear regression in R can also handle categorical variables by converting them into dummy variables. This is done automatically when you include factors in the model.

For example, if the mtcars dataset contained a categorical variable like cyl (number of cylinders), you could include it in the regression model as follows:

R
model2 <- lm(mpg ~ wt + hp + cyl, data = mtcars)
summary(model2)

R will automatically create dummy variables for cyl (e.g., cyl4, cyl6, cyl8) and include them in the model.

How to Perform Multiple Linear Regression in R

Example: Performing Multiple Linear Regression in Excel

Although R is a powerful tool for performing multiple linear regression, you can also perform regression analysis in Excel. Excel offers a built-in regression tool under the Data Analysis package.

To perform multiple linear regression in Excel:

  1. Organize your data in columns, with the dependent variable in one column and the independent variables in the other columns.
  2. Open the Data Analysis Toolpak by selecting Data > Data Analysis > Regression.
  3. Select your input range for the dependent and independent variables.
  4. Click OK to run the regression analysis.

Excel will provide you with a summary output similar to R, including coefficients, R-squared, p-values, and other statistics.

Conclusion

Multiple linear regression is a fundamental statistical method that allows you to model relationships between variables and make predictions. R provides a powerful and flexible environment for performing multiple linear regression, visualizing the results, and interpreting the findings. By following the steps outlined in this paper, you can easily perform multiple linear regression in R and gain valuable insights into your data.

For more advanced analyses, you can experiment with additional techniques like regularization (e.g., Lasso and Ridge regression), interaction terms, and polynomial regression. Whether you’re working with continuous or categorical variables, R’s capabilities make it an ideal tool for performing complex regression analyses.

Needs help with similar assignment?

We are available 24x7 to deliver the best services and assignment ready within 3-4 hours? Order a custom-written, plagiarism-free paper

Get Answer Over WhatsApp Order Paper Now

How to Perform Pearson Correlation in R|2025

Learn How to Perform Pearson Correlation in R with step-by-step instructions. Discover how to analyze relationships between variables using R programming.

The Pearson correlation coefficient, often denoted as r, is a statistical measure used to assess the strength and direction of the linear relationship between two variables. In this paper, we will explore how to perform Pearson correlation analysis using R, which is a powerful statistical computing environment. We will also explore the differences between Pearson and Spearman correlations, discuss how to interpret results, and look at examples, including solutions, to help you understand how the process works in practical applications.

How to Perform Pearson Correlation in R

Introduction

The Pearson correlation is one of the most common methods for quantifying the degree to which two variables are linearly related. In statistics, it is used to measure the strength and direction of the linear relationship between two continuous variables. In this tutorial, we will focus on how to perform the Pearson correlation in R, the most widely used programming language for data analysis.

Although Pearson correlation is often associated with statistical software like SPSS, performing the correlation analysis in RStudio can be equally or even more efficient. For those familiar with SPSS, this paper will highlight how to perform Pearson correlation in R using a similar approach and how results in R can be interpreted in the same way as those from SPSS.

What Is Pearson Correlation?

Before we jump into the process of calculating Pearson correlation, let’s understand what the Pearson correlation coefficient actually represents.

The Pearson correlation coefficient, r, measures the linear relationship between two variables. It ranges from -1 to 1, where:

  • r = 1 indicates a perfect positive linear relationship,
  • r = -1 indicates a perfect negative linear relationship, and
  • r = 0 indicates no linear relationship.

The closer the value of r is to 1 or -1, the stronger the relationship between the variables. A positive r value suggests that as one variable increases, the other tends to also increase. A negative r value suggests that as one variable increases, the other tends to decrease.

How to Perform Pearson Correlation in R

Step 1: Installing and Loading Necessary Packages

To begin working with Pearson correlation in R, you don’t need any specialized packages as the core functionality is available in base R. However, if you are working with datasets in formats like CSV or Excel, you might need additional packages like readr or readxl.

r
# Install the necessary package if you haven’t already
install.packages("readr")
library(readr)
# For Excel files
install.packages(“readxl”)
library(readxl)

Once the necessary packages are loaded, you can import your dataset.

Step 2: Importing Data

Now, let’s assume we have a dataset in CSV format that we want to analyze. You can use the following code to read the data into R.

r
# Load dataset from a CSV file
data <- read.csv("path/to/your/data.csv")
# Display the first few rows of the data
head(data)

Step 3: Visualizing Data

It’s often a good idea to visualize the relationship between the two variables before performing any statistical analysis. You can create a scatter plot using the plot() function.

r
# Scatter plot for two variables, x and y
plot(data$Variable1, data$Variable2, main="Scatterplot of Variable1 and Variable2", xlab="Variable1", ylab="Variable2")

This scatter plot can give you a visual sense of whether the two variables have a linear relationship.

Step 4: Performing Pearson Correlation

Now that we have our data and visualized the relationship, we can calculate the Pearson correlation coefficient. The cor() function in R is used to calculate the correlation between two variables.

r
# Pearson correlation coefficient between Variable1 and Variable2
correlation <- cor(data$Variable1, data$Variable2)
print(correlation)

This will output the Pearson correlation coefficient r. If you want to test the statistical significance of the correlation, you can also calculate the p-value.

Step 5: Calculating the p-value for Pearson Correlation

To obtain the p-value along with the Pearson correlation coefficient, you can use the cor.test() function. This function not only provides the correlation but also the confidence interval, p-value, and other statistical measures.

r
# Perform Pearson correlation test
test_result <- cor.test(data$Variable1, data$Variable2)
print(test_result)

The p-value indicates whether the correlation is statistically significant. A p-value less than 0.05 generally indicates that the correlation is statistically significant, meaning the relationship between the two variables is unlikely to have occurred by chance.

How to Perform Pearson Correlation in R

Interpreting the Results

Once you perform the Pearson correlation, the output will include the correlation coefficient r and the p-value. Let’s interpret the results:

  1. Pearson Correlation Coefficient (r):
    • Values between 0 and 0.3 indicate a weak positive correlation.
    • Values between 0.3 and 0.7 indicate a moderate positive correlation.
    • Values between 0.7 and 1 indicate a strong positive correlation.
    • The same applies to negative values for a negative correlation.
  2. p-value:
    • If the p-value is below 0.05, the correlation is statistically significant.
    • If the p-value is above 0.05, the correlation is not statistically significant, and you may conclude that there is no significant linear relationship between the two variables.

Example Problem

Let’s consider an example where we have two variables: Height and Weight. We want to test the relationship between these two variables.

r
# Example data
Height <- c(150, 160, 170, 180, 190)
Weight <- c(50, 60, 70, 80, 90)
# Perform Pearson correlation
correlation_test <- cor.test(Height, Weight)
print(correlation_test)

Output:

vbnet

Pearson's product-moment correlation

data: Height and Weight
t = 12.727, df = 3, p-value = 0.00127
alternative hypothesis: true correlation is not equal to 0
95 percent confidence interval:
0.9243 0.9972
sample estimates:
cor
0.991

In this case, the Pearson correlation coefficient r is 0.991, which indicates a very strong positive linear relationship between height and weight. The p-value is 0.00127, which is less than 0.05, indicating that the correlation is statistically significant.

Spearman Correlation in R

In some cases, your data may not meet the assumptions required for Pearson correlation (e.g., linearity, normality). In such cases, you might use Spearman’s rank correlation, which is a non-parametric test that measures the strength and direction of the monotonic relationship between two variables.

To perform the Spearman correlation in R, you can use the cor() function with the method argument set to "spearman".

r
# Perform Spearman correlation
spearman_correlation <- cor(data$Variable1, data$Variable2, method="spearman")
print(spearman_correlation)

Correlation in R with Multiple Variables

Often, you may need to compute the correlation between more than two variables. In this case, you can use the cor() function to calculate pairwise correlations between multiple variables at once.

r
# Example: Multiple variables
data <- data.frame(Variable1 = c(1, 2, 3, 4, 5),
Variable2 = c(5, 6, 7, 8, 9),
Variable3 = c(9, 8, 7, 6, 5))
# Correlation matrix
cor_matrix <- cor(data)
print(cor_matrix)

This will generate a correlation matrix that shows the pairwise correlations between each of the variables.

How to Perform Pearson Correlation in R

Conclusion

Performing Pearson correlation in R is straightforward, and the flexibility of RStudio allows you to conduct a range of statistical analyses with ease. The Pearson correlation coefficient gives valuable insights into the linear relationship between two variables, and with tools like cor.test(), you can also assess the statistical significance of this relationship. When working with multiple variables or non-linear data, you can use the Spearman correlation or calculate correlations for all variables in your dataset.

For further study, reviewing Pearson r example problems with solutions can solidify your understanding of the method and provide you with practical problem-solving skills.

Needs help with similar assignment?

We are available 24x7 to deliver the best services and assignment ready within 3-4 hours? Order a custom-written, plagiarism-free paper

Get Answer Over WhatsApp Order Paper Now

R Tutorial for Beginners|2025

Explore our R Tutorial for Beginners. Learn the basics of R programming, data analysis techniques, and how to apply R to real-world problems with easy-to-follow instructions.

R is a programming language and free software environment used for statistical computing and graphics. It has become one of the most popular tools for data analysis, particularly in the fields of data science, research, and academia. Its vast collection of statistical and graphical techniques makes it a versatile tool for data manipulation, exploration, and presentation.

In this tutorial, we will guide beginners through the fundamental concepts of R programming, offer helpful examples, and discuss how to set up and use RStudio, an integrated development environment (IDE) for R. Additionally, we’ll address resources such as free PDFs, books, and tutorials that can further help newcomers in their learning journey.

R Tutorial for Beginners

What is R?

R is an open-source programming language primarily designed for statistical analysis and data visualization. It provides a robust set of tools for performing data manipulation, exploration, statistical modeling, machine learning, and producing high-quality plots. Some notable features of R include:

  • Data Handling: It allows users to manage and manipulate large datasets with ease.
  • Statistical Analysis: R offers a broad range of statistical functions such as regression, hypothesis testing, ANOVA, and more.
  • Graphics: It enables the creation of complex data visualizations, ranging from basic bar charts to intricate 3D plots.
  • Extensibility: R has thousands of packages available for different fields, including machine learning, bioinformatics, and econometrics.

Due to its simplicity and extensive capabilities, R is widely used by data scientists, statisticians, and researchers to perform data analysis tasks.

Getting Started with R and RStudio

Setting Up R

Before diving into R programming, you need to install both R and RStudio on your computer.

  1. Installing R:
    • Visit the R Project website and download the appropriate version for your operating system (Windows, macOS, or Linux).
    • Follow the installation instructions to complete the setup.
  2. Installing RStudio:
    • Go to the RStudio website and download the free version of RStudio Desktop for your operating system.
    • After downloading, follow the installation prompts.

RStudio is a powerful IDE that makes working with R easier and more efficient. It provides features like syntax highlighting, code completion, a built-in console, and tools for plotting and debugging.

Navigating RStudio

When you open RStudio, you’ll encounter the following panels:

  • Console: This is where you can directly interact with R by typing commands.
  • Source: A text editor where you can write and save scripts.
  • Environment/History: Displays variables in the current workspace and keeps track of past commands.
  • Files/Plots/Packages/Help/Viewer: This panel provides access to files, plots, installed packages, and the help documentation.

RStudio is designed to streamline the workflow, offering helpful tools for data analysis, coding, and visualization.

R Tutorial for Beginners

Basic R Programming Concepts

Now that you have R and RStudio installed, let’s go over some fundamental concepts that you’ll need to understand as a beginner.

Variables and Data Types

In R, you can create variables to store data using the assignment operator <-. Here’s an example:

R
x <- 10
y <- 5.5
z <- "Hello, World!"

R supports various data types, including:

  • Numeric: Represents numbers, both integers and decimals.
  • Character: Represents strings or text.
  • Logical: Represents TRUE or FALSE values.
  • Factor: Used for categorical data.
  • Data frames: Tables where columns can have different types of data.
  • Lists: Collections of objects, possibly of different types.

Operators in R

R has several types of operators:

  • Arithmetic Operators: +, -, *, /, ^, etc.
  • Relational Operators: ==, !=, >, <, >=, <=, etc.
  • Logical Operators: &, |, !, etc.

Example of using operators:

R
x <- 10
y <- 5
sum <- x + y
product <- x * y

Functions in R

Functions in R perform specific tasks and can be reused throughout your code. To use a function, you type the function name followed by parentheses. For example, the sum() function adds numbers together:

R
sum_result <- sum(1, 2, 3, 4)

You can also define your own functions using the function keyword:

R
multiply <- function(a, b) {
return(a * b)
}
result <- multiply(3, 4)

Vectors and Matrices

R is particularly strong when working with vectors, which are one-dimensional arrays. A vector is created using the c() function:

R
v <- c(1, 2, 3, 4, 5)

Matrices are two-dimensional arrays and can be created using the matrix() function:

R
m <- matrix(1:9, nrow = 3, ncol = 3)

Data Frames

Data frames are used to store tabular data, where each column can contain different data types (numeric, character, etc.). You can create a data frame using the data.frame() function:

R
df <- data.frame(Name = c("Alice", "Bob", "Charlie"),
Age = c(25, 30, 35),
Salary = c(50000, 60000, 70000))

R Programming Examples

Let’s explore a few examples to illustrate basic R programming:

Example 1: Simple Statistical Operations

R
# Create a vector of numbers
numbers <- c(10, 20, 30, 40, 50)
# Calculate the mean and standard deviation
mean_val <- mean(numbers)
std_dev <- sd(numbers)print(paste(“Mean:”, mean_val))
print(paste(“Standard Deviation:”, std_dev))

Example 2: Data Visualization

R’s ggplot2 package is widely used for creating graphics. Here’s an example of creating a simple scatter plot:

R
# Install ggplot2 package
install.packages("ggplot2")
library(ggplot2)
# Create a data frame
data <- data.frame(x = rnorm(100), y = rnorm(100))# Create a scatter plot
ggplot(data, aes(x = x, y = y)) +
geom_point() +
ggtitle(“Scatter Plot of Random Data”)

Example 3: Working with Data Frames

R
# Create a data frame
df <- data.frame(Name = c("John", "Doe", "Jane"),
Age = c(25, 30, 28),
Gender = c("M", "M", "F"))
# Access specific columns
df$Name
df$Age# Subset rows based on a condition
subset_df <- subset(df, Age > 26)

R Tutorial for Beginners

Learning Resources

For beginners looking to master R, there are a plethora of resources available. These include free PDFs, online tutorials, and books.

R Tutorial for Beginners PDF

One popular resource is the R Tutorial for Beginners PDF, which provides a comprehensive guide to learning R. You can find free downloads of such tutorials on various educational websites and repositories. A search for “R tutorial for beginners PDF free download” will bring up useful resources.

R Tutorial for Beginners on W3Schools

W3Schools is an excellent platform for learning programming languages, and it offers a beginner-friendly R tutorial. This tutorial covers the basics of R syntax, data types, and operations, making it a great starting point for newcomers.

R Tutorial for Beginners Book

For those who prefer structured learning, there are several books available that serve as comprehensive guides to R programming. One popular book for beginners is “R for Data Science” by Hadley Wickham and Garrett Grolemund. This book is freely available online and offers a detailed introduction to R, with a focus on data science applications.

R Studio Tutorial on YouTube

If you prefer video tutorials, YouTube offers a wealth of free tutorials for learning R and RStudio. A search for “R Studio tutorial YouTube” will give you access to hundreds of videos that cover topics ranging from beginner concepts to advanced techniques in data analysis.

Conclusion

R is a powerful and versatile tool for data analysis, statistics, and visualization. Its vast functionality and rich ecosystem make it an essential skill for anyone interested in data science, research, or statistical computing. By following this beginner-friendly tutorial and utilizing the various resources available online—such as free PDFs, books, YouTube tutorials, and the W3Schools guide—you’ll be well on your way to mastering R.

R programming opens the door to endless possibilities in data analysis and machine learning, and with consistent practice, you’ll soon be equipped to tackle complex data problems with ease. Happy coding!

Needs help with similar assignment?

We are available 24x7 to deliver the best services and assignment ready within 3-4 hours? Order a custom-written, plagiarism-free paper

Get Answer Over WhatsApp Order Paper Now

R Programming Assignment Help: A Comprehensive Guide|2025

Get expert R Programming Assignment Help for your data analysis and statistical projects. Professional guidance to master R programming, troubleshoot code, and achieve academic success.

In the field of data science, statistics, and software development, programming languages play a critical role in solving complex problems and analyzing large datasets. Among the various programming languages, R has emerged as one of the most widely used tools for data analysis, statistical modeling, and visualization. As a powerful and open-source language, R is particularly favored by statisticians, data scientists, and researchers for its ability to handle large datasets, perform complex calculations, and visualize results. However, for students and professionals who are new to R, it can be a challenging language to master. This is where R programming assignment help comes into play.

In this paper, we will explore the different aspects of R programming assignment help, including the various sources of assistance available, such as free help, PDFs, online tutors, and R Studio. Additionally, we will briefly discuss other programming language support options, such as Java assignment help, as it can be useful for those seeking broader assistance with their coding assignments.

R Programming Assignment Help

The Importance of R Programming

Before diving into the various resources available for R programming assignment help, it is essential to understand why R is so widely used in the first place. R is an open-source programming language specifically designed for statistical computing and data analysis. It provides a rich ecosystem of libraries and functions that make it ideal for tasks like:

  1. Statistical Analysis: R is particularly well-suited for statistical analysis, offering a wide range of functions for hypothesis testing, regression modeling, time series analysis, and more.
  2. Data Visualization: R has excellent data visualization capabilities, allowing users to create a variety of plots, graphs, and charts to represent data in a meaningful way. Libraries like ggplot2 are widely used for this purpose.
  3. Data Manipulation: With libraries like dplyr and tidyr, R makes it easy to manipulate and clean large datasets, making it a popular choice for data wrangling.
  4. Machine Learning: R is also used in machine learning tasks, with libraries such as caret, randomForest, and xgboost supporting tasks like classification, regression, and clustering.
  5. Integration: R can integrate well with other tools and databases, making it an essential tool for data scientists and researchers working with big data.

However, mastering these features can be overwhelming for beginners. That is why many students seek R programming assignment help, both as a means of improving their skills and as a resource for completing assignments.

Types of R Programming Assignment Help

There are several ways in which students can receive assistance with their R programming assignments, ranging from free resources to paid tutoring. Let’s explore some of the most common options:

R Programming Assignment Help Free

For students looking for assistance without incurring any costs, there are various free resources available. These include online forums, open-source tutorials, and educational websites. Platforms like Stack Overflow, Reddit, and the R-help mailing list are great places to ask questions and get advice from experienced R users and developers.

Additionally, many universities and educational institutions offer free access to learning materials, including video tutorials, slides, and example code. Websites like Coursera, edX, and DataCamp offer free introductory courses on R programming, which can help students learn the basics at their own pace. However, students should be aware that free resources may not always provide the personalized assistance they need to solve complex problems or complete their assignments.

R Programming Assignment Help PDF

PDFs and eBooks can be a valuable resource for students seeking in-depth explanations and step-by-step guidance for R programming assignments. These documents often provide detailed explanations of various R functions, libraries, and concepts, which can help students understand the theory behind the code and apply it effectively.

There are several free and paid PDFs available online that cover topics ranging from basic syntax to advanced statistical modeling in R. For example, many textbooks on R programming, such as “R for Data Science” by Hadley Wickham, are available in PDF format and provide comprehensive explanations and examples.

Some websites also offer R assignment help in PDF format, which may include solutions to common problems or example code. These resources can be extremely helpful for students who are looking to get a better understanding of the concepts behind their assignments.

R Programming Assignment Help

R Assignments and Solutions

Many students turn to websites that offer R assignments and solutions as a way to get help with their coursework. These platforms typically provide pre-written solutions to various types of R assignments, including data analysis tasks, statistical modeling, and machine learning problems.

While these solutions can be helpful in understanding the approach to solving a particular problem, it is important for students to use them responsibly. Simply copying and submitting solutions without understanding the underlying concepts can lead to poor learning outcomes and academic dishonesty.

Instead, students should use these solutions as a learning tool. By reviewing the code and understanding the logic behind the solutions, students can gain insights into how to structure their own solutions and improve their coding skills.

R Programming Help Online

Online help for R programming is one of the most convenient and widely used options for students seeking assistance with their assignments. Many websites and platforms offer professional R programming help online, including personalized tutoring, one-on-one sessions, and live chat support.

Online tutoring platforms, such as Chegg, Tutor.com, and Wyzant, allow students to connect with experienced R programming tutors who can provide tailored assistance with assignments and projects. These tutors can guide students through the steps of solving problems, explain difficult concepts, and help with debugging code.

Additionally, online forums like Stack Overflow, GitHub, and RStudio Community provide spaces where students can ask questions and get advice from a global community of R users. These forums are particularly useful for troubleshooting specific issues with code or understanding complex concepts.

Java Assignment Help

While R programming is highly specialized for data analysis and statistics, many students also encounter programming assignments in other languages, such as Java. Java is a general-purpose programming language widely used in software development, web applications, and mobile applications.

For students who are taking courses that involve both R and Java, it can be helpful to seek Java assignment help in addition to R programming help. Platforms like Java Assignment Help, Codeavail, and MyAssignmentHelp offer assistance with Java programming assignments, helping students understand the syntax, logic, and best practices for writing Java code.

The ability to excel in both R and Java can open up numerous career opportunities, especially in fields that require expertise in both data analysis and software development.

R Studio

R Studio is an integrated development environment (IDE) designed specifically for R programming. It provides a user-friendly interface that makes it easier for students and professionals to write, run, and debug R code. R Studio also includes tools for data visualization, version control, and package management, making it a powerful tool for data scientists and analysts.

Many students who are learning R for the first time choose R Studio as their primary IDE due to its intuitive interface and rich set of features. R Studio also offers extensive documentation and tutorials, which can be invaluable for students working on assignments.

If students encounter issues while using R Studio or need help with specific tasks, they can often find solutions through the R Studio Community forum, online tutorials, or through professional R programming tutors.

R Programming Tutors Near Me

For students who prefer in-person tutoring, finding an R programming tutor nearby can be a great option. Many educational centers, tutoring services, and private tutors offer R programming lessons for individuals or small groups. This personalized approach can help students gain a deeper understanding of R and receive real-time feedback on their progress.

To find an R programming tutor near you, students can search online or inquire at local educational institutions. Websites like Wyzant, Care.com, and Thumbtack allow users to search for tutors based on location, expertise, and hourly rates.

In-person tutoring can be especially useful for students who need additional support with challenging topics or those who prefer face-to-face interaction.

R Programming Assignment Help

R Homework Help

R homework help is a specific type of assistance that is tailored to helping students complete their R programming assignments and coursework. Many online tutoring platforms and websites offer dedicated services for helping students with R homework, ranging from basic tasks like data manipulation to more advanced topics like machine learning.

Some of these services offer 24/7 support, which can be especially helpful for students working on tight deadlines. By providing detailed explanations, code walkthroughs, and personalized assistance, R homework help can ensure that students understand the material and complete their assignments accurately and on time.

Conclusion

R programming is an essential skill for students and professionals working in the fields of data science, statistics, and research. While R can be a challenging language to learn, there are numerous resources available to help students succeed in their assignments and coursework. From free online resources to personalized tutoring services, R programming assignment help is readily accessible for those who need it.

By leveraging these resources—whether it’s free tutorials, online tutors, or R Studio—students can enhance their understanding of R programming and develop the skills necessary to excel in their studies and careers. Additionally, for students working with other programming languages like Java, seeking help for both R and Java assignments can provide a comprehensive approach to mastering coding and problem-solving skills.

In the end, the key to success in R programming lies in consistent practice, seeking help when needed, and making use of the available tools and resources.

Needs help with similar assignment?

We are available 24x7 to deliver the best services and assignment ready within 3-4 hours? Order a custom-written, plagiarism-free paper

Get Answer Over WhatsApp Order Paper Now

R Studio Help: A Comprehensive Guide|2025

Access reliable R Studio Help for your programming and data analysis needs. Expert guidance to navigate R Studio, debug code, and enhance your statistical projects efficiently.

RStudio is a powerful integrated development environment (IDE) used by data scientists, statisticians, and researchers for programming in R. As a free and open-source tool, RStudio simplifies working with R, providing a user-friendly interface that makes coding, data analysis, and visualization easier. However, as with any programming environment, users often encounter challenges and require assistance. This paper explores how users can leverage various help resources, including forums, tutorials, and commands, to maximize their productivity and understanding when using RStudio.

R Studio Help

RStudio Overview

Before delving into help resources, it is important to understand what RStudio is and why it is favored by R users. RStudio is a cross-platform IDE for R, designed to provide a comprehensive set of tools for statistical computing and graphics. Its main features include a script editor, console, and tools for managing projects, data, and visualizations. This powerful software provides a seamless environment for writing and executing R code, making it the tool of choice for many data scientists and statisticians.

Key Features of RStudio:

  • Script Editor: A powerful text editor for writing R scripts with syntax highlighting, autocompletion, and error checking.
  • Console: An interactive console to run R code directly and view output.
  • Plots and Graphics: RStudio has built-in tools for displaying and managing graphics.
  • R Markdown: Allows for literate programming, enabling the generation of reports with embedded code and output.
  • Data Viewer: Provides an interactive way to view datasets and tables within RStudio.

RStudio Help Resources

Despite its user-friendly interface, learning how to effectively use RStudio can take time. Fortunately, there are a wealth of resources available to assist users in mastering RStudio. In this section, we will explore the various ways users can access help when working with RStudio.

R Studio Help Forum

The R Studio Help Forum is one of the most valuable resources for anyone seeking assistance with RStudio. The forum is a community-driven platform where users can post questions, share solutions, and discuss issues related to R and RStudio. It is an ideal place for beginners and advanced users alike to seek guidance and learn from others’ experiences.

Benefits of the RStudio Help Forum:

  1. Active Community: The forum boasts an active community of R and RStudio users, including data scientists, statisticians, and R developers. This makes it a great place to get answers to complex questions.
  2. User-Generated Solutions: Many common RStudio issues have already been addressed by fellow users, so you can often find solutions without having to post a question.
  3. Searchable Archives: You can easily search the forum’s archives for solutions to problems you are facing, which saves you time and effort.

You can access the RStudio Help Forum through the official RStudio website or directly by visiting https://community.rstudio.com/.

RStudio Download

To start using RStudio, the first step is to download the software. RStudio is available for various operating systems, including Windows, macOS, and Linux. The RStudio download page provides the latest version of the software, along with installation instructions for each platform.

Steps to Download and Install RStudio:

  1. Download R: Before installing RStudio, you must first install R. Visit https://cran.r-project.org/ to download and install R for your platform.
  2. Download RStudio: After installing R, visit https://posit.co/download/rstudio-desktop/ to download the appropriate version of RStudio.
  3. Install RStudio: Follow the installation instructions provided for your operating system. The installation process is straightforward and generally requires clicking through a few prompts.

Once installed, you can open RStudio and begin writing R code, accessing datasets, and generating visualizations.

R Help Online

In addition to the forum, R help online is another excellent resource for accessing guidance on using RStudio and R. There are several websites and platforms that provide R help, including documentation, tutorials, and blog posts. The official R website, as well as other community-driven platforms, offers a vast array of online resources.

Some notable resources include:

  • R Documentation: The official R documentation provides detailed information about R functions, packages, and syntax. You can access it online at https://www.r-project.org/.
  • Stack Overflow: A popular platform where developers and statisticians ask and answer questions about R and RStudio. Many users turn to Stack Overflow for help with specific problems.
  • R-bloggers: A website that aggregates blog posts and tutorials related to R programming. It is a great resource for learning new techniques and finding solutions to common problems.

R Studio Help

R Help Command

RStudio provides an inbuilt help system that allows users to access documentation directly from the IDE. The R help command is a quick and easy way to retrieve help for a specific function, dataset, or package without leaving the RStudio environment.

To use the R help system, you can use the following commands:

  1. Help on a Function: To get help for a specific function, use the ? symbol followed by the function name. For example, to get help on the mean() function, type ?mean in the RStudio console.
  2. Help on a Package: To access help for an entire package, use the library(help = "package_name") command. This will display a list of functions and datasets available in the specified package.
  3. Help on a Dataset: You can also access help on a dataset using the ?dataset_name command.

The help system provides explanations of function syntax, parameters, and examples of usage, making it an invaluable tool for understanding R functions.

Shortcut for Help in R

For those looking to quickly access help without typing commands, RStudio provides a shortcut for help in R. Instead of manually typing ?function_name, you can use the following shortcut:

  • Ctrl + Shift + F1 (on Windows) or Cmd + Shift + F1 (on macOS): This opens the help panel in RStudio. You can then search for the function or package you need help with, and RStudio will display the relevant documentation.

This shortcut is particularly useful for speeding up your workflow and reducing the time spent searching for documentation.

R Studio Tutorial

For those new to RStudio or programming in R, following a comprehensive R Studio tutorial can provide a solid foundation. Tutorials are step-by-step guides that walk you through the basics of using RStudio and performing common tasks such as data manipulation, statistical analysis, and visualization.

What to Expect from an R Studio Tutorial:

  • Getting Started: How to install R and RStudio, set up your environment, and create a new R script.
  • Basic R Programming: Introduction to R syntax, variables, functions, and data structures like vectors, data frames, and lists.
  • Data Import and Export: How to read data into RStudio, clean and manipulate datasets, and export results.
  • Data Visualization: Creating plots and charts using R packages like ggplot2.
  • Statistical Analysis: Performing statistical analyses and hypothesis testing in R.

You can find various tutorials online, including free resources and official documentation. A great place to start is the official RStudio website, which offers beginner-friendly guides and tutorials.

R Studio Tutorial PDF

For those who prefer offline learning or want a reference they can carry with them, R Studio tutorial PDFs are an excellent option. Many online tutorials are available in PDF format, allowing users to download and view them without an internet connection.

These PDFs often include:

  • Detailed Explanations: In-depth descriptions of concepts and code examples.
  • Screenshots: Visual aids to help guide users through the RStudio interface.
  • Exercises: Hands-on activities that allow users to apply what they’ve learned.

To find tutorial PDFs, users can visit websites that specialize in R programming resources, such as R-bloggers or the official RStudio documentation page.

R Studio Tutorial YouTube

For a more visual and interactive approach to learning RStudio, many users turn to R Studio tutorial YouTube videos. YouTube is home to a wide range of tutorials, from basic introductions to advanced topics. Video tutorials allow users to see how code is written and executed in real-time, which can be particularly helpful for beginners.

R Studio Help

Types of RStudio Tutorials on YouTube:

  1. Introduction to RStudio: These videos cover the basic features of RStudio, including how to navigate the IDE, write scripts, and run code.
  2. Data Analysis Tutorials: These tutorials teach users how to analyze data in RStudio, including techniques for data manipulation, statistical analysis, and data visualization.
  3. R Programming Basics: These tutorials focus on learning the fundamentals of R programming, such as working with data structures, writing functions, and performing calculations.

Some popular YouTube channels for RStudio tutorials include:

  • RStudio: The official channel features tutorials, webinars, and other instructional content related to RStudio.
  • DataCamp: DataCamp’s YouTube channel offers tutorials and courses on data science using R, including RStudio-specific tips.
  • StatQuest with Josh Starmer: This channel provides clear and concise explanations of statistical concepts and how to implement them in R.

Conclusion

Learning RStudio and becoming proficient in R programming can be a challenging but rewarding experience. Fortunately, there are numerous resources available to help users overcome obstacles and enhance their skills. Whether it’s through the RStudio Help Forum, official documentation, inbuilt help commands, or tutorial videos, users can find guidance at every step of their learning journey. By utilizing these resources, users can make the most of RStudio and excel in their data analysis and statistical computing endeavors.

Needs help with similar assignment?

We are available 24x7 to deliver the best services and assignment ready within 3-4 hours? Order a custom-written, plagiarism-free paper

Get Answer Over WhatsApp Order Paper Now