Report Writing Tutorial: A Comprehensive Guide|2025

Report writing is an essential skill across various professional and academic fields. Whether you are a student drafting a research report, a business executive preparing a financial report, or a project manager documenting project milestones, understanding the nuances of report writing is critical to communicating effectively.

This tutorial will provide a step-by-step guide to mastering report writing. By the end of this guide, you’ll be equipped to craft reports that are clear, concise, and impactful. We’ll also explore best practices and tools to make your reports stand out.


Report Writing Tutorial

What is Report Writing?

Report writing involves documenting and presenting information in a structured format for a specific audience. Reports aim to analyze, inform, and sometimes recommend actions based on findings. They are usually fact-based and focus on clarity, objectivity, and precision.


Key Features of a Good Report

  1. Purpose-Oriented: The report must fulfill its intended purpose, whether to inform, analyze, or recommend.
  2. Structured: Organized into sections with clear headings and subheadings.
  3. Clear and Concise: Uses simple language to convey complex ideas effectively.
  4. Evidence-Based: Supports statements with data, examples, or references.
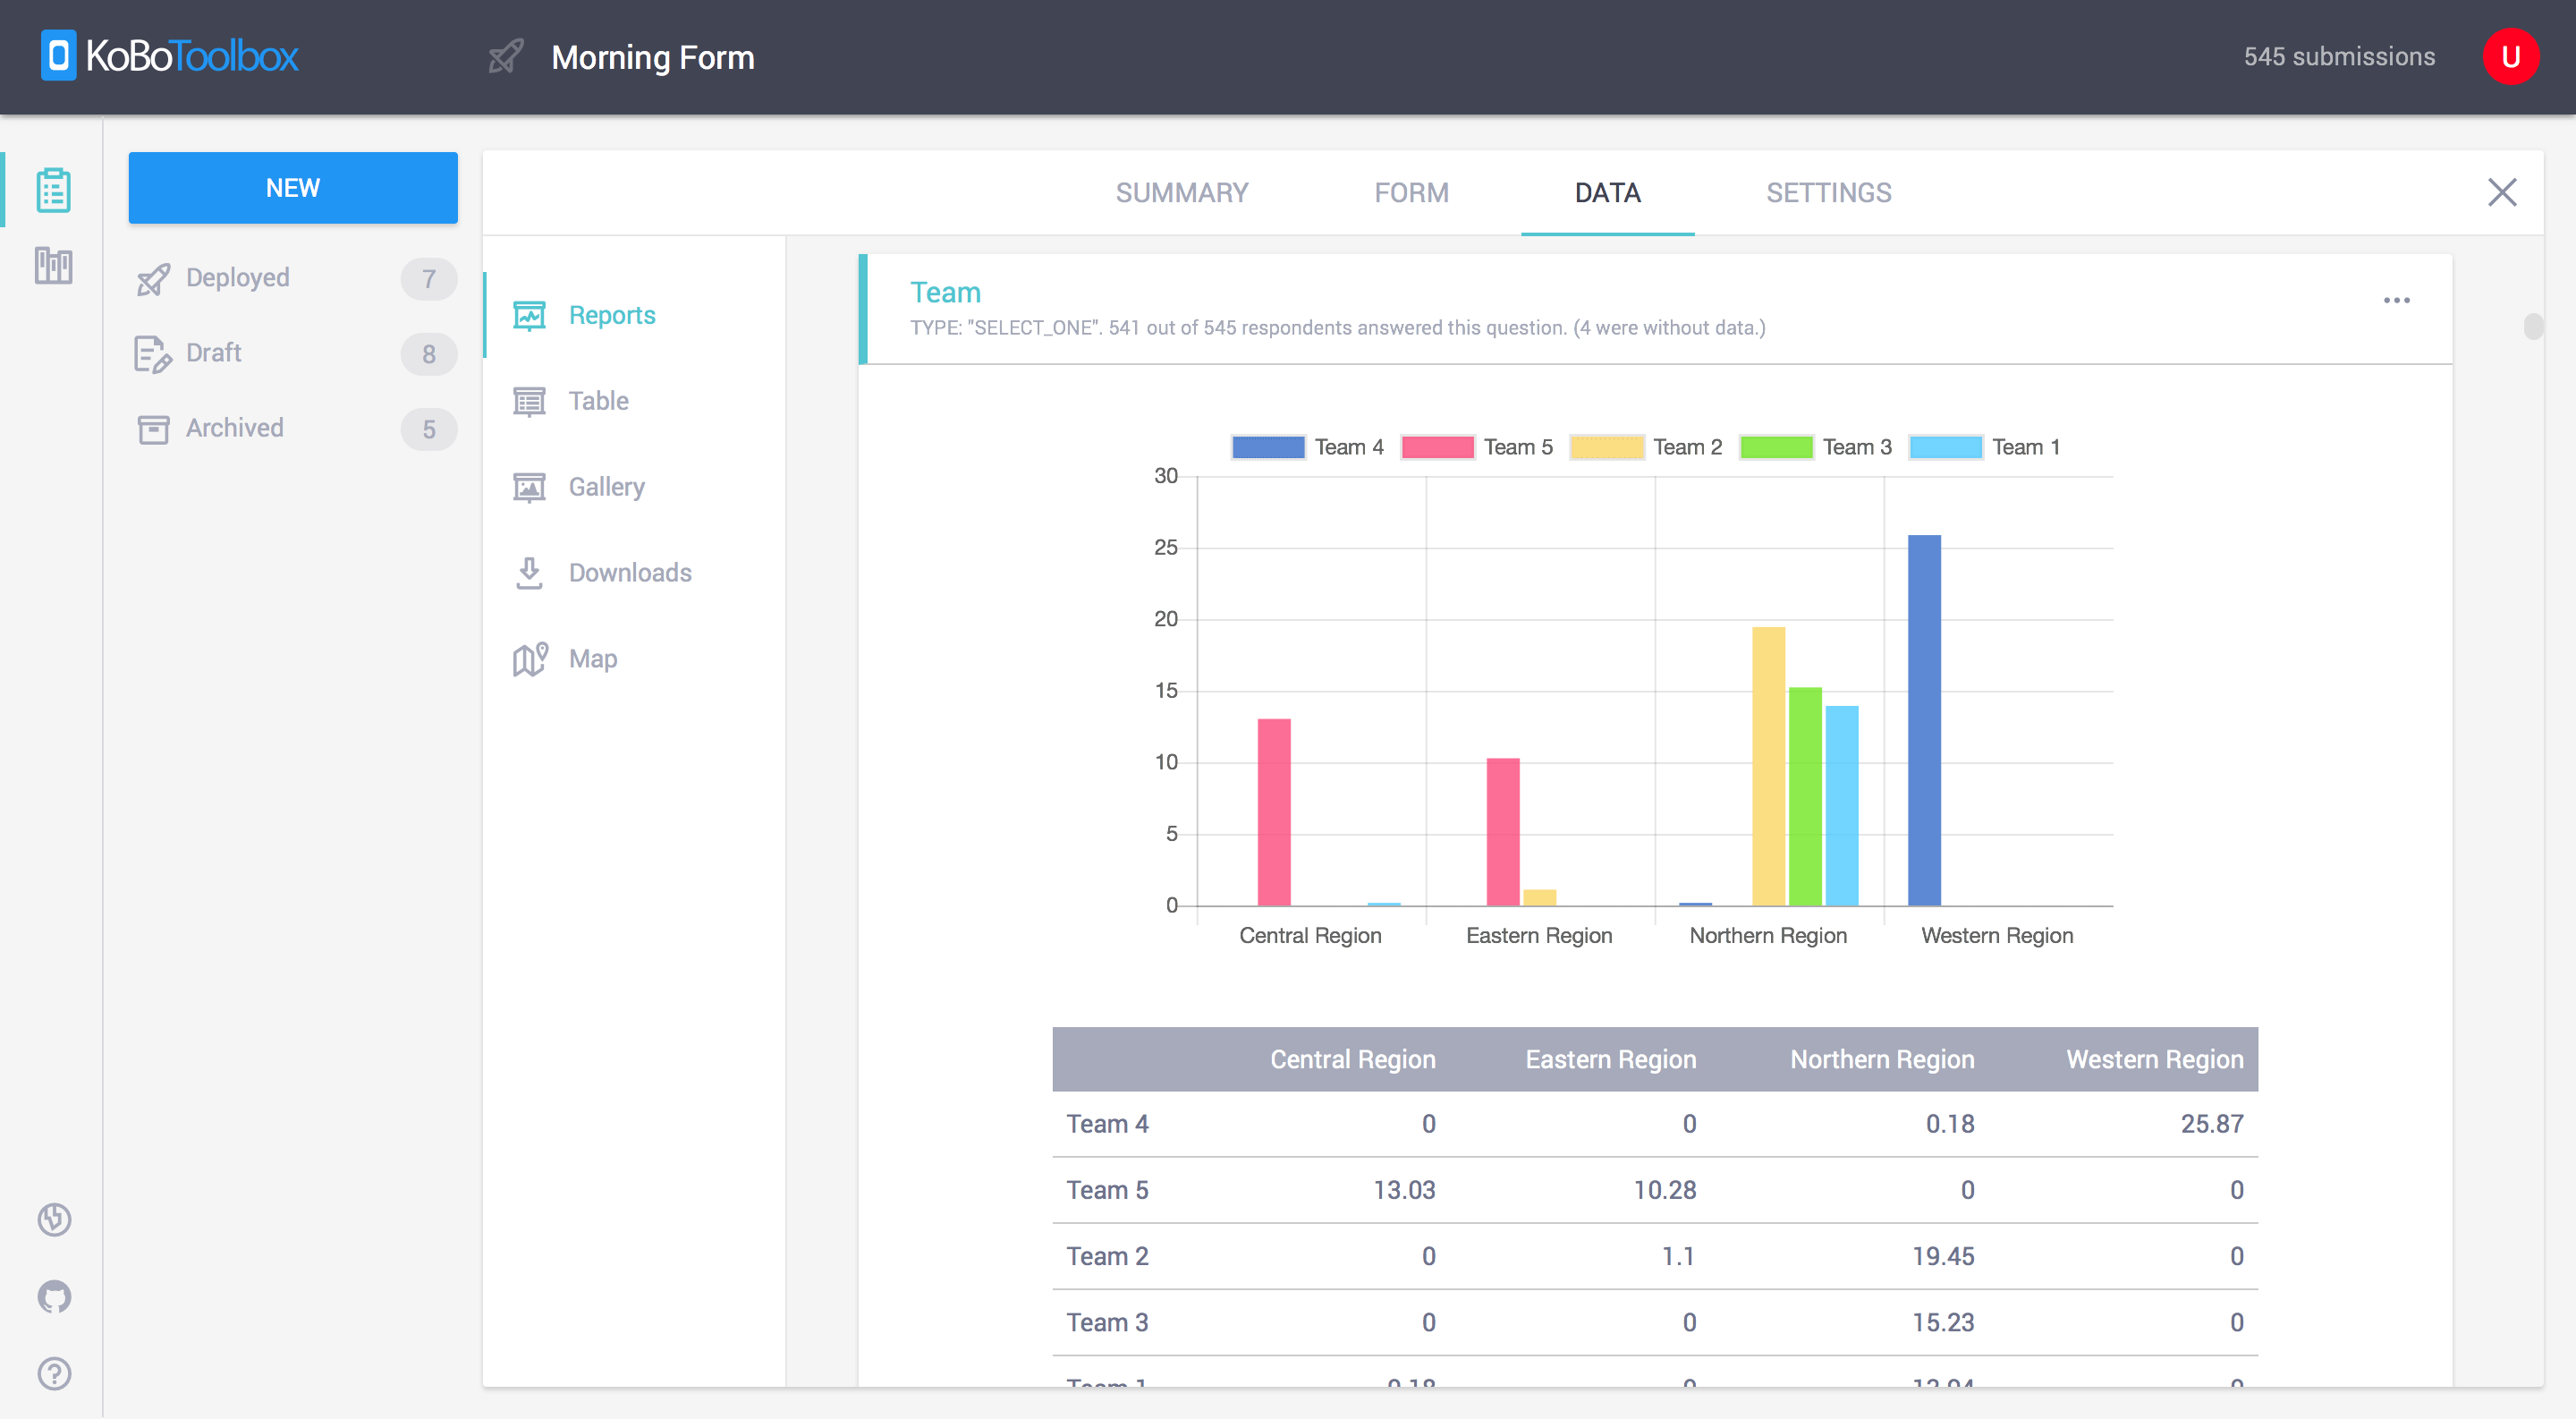
  5. Visually Appealing: Includes charts, graphs, and tables where necessary to enhance readability.

Types of Reports

1. Academic Reports

  • Research reports
  • Laboratory reports
  • Case study analyses

2. Business Reports

  • Financial reports
  • Marketing reports
  • Annual reports

3. Technical Reports

  • Project reports
  • Feasibility studies
  • Engineering assessments

4. Informational Reports

  • Status updates
  • Progress reports
  • Briefing papers

5. Analytical Reports

  • Problem-solving reports
  • Risk assessments
  • Performance evaluations

Step-by-Step Guide to Writing a Report

Step 1: Understand the Purpose

Before you begin writing, clarify the purpose of the report. Ask yourself:

  • Who is the audience?
  • What information do they need?
  • What is the desired outcome of the report?

Step 2: Research and Gather Data

  • Collect relevant information from reliable sources.
  • Organize data into categories.
  • Verify the accuracy of your data to maintain credibility.

Step 3: Plan the Structure

Create an outline to organize your thoughts. A typical report structure includes:

  1. Title Page: Includes the report title, author’s name, date, and other relevant details.
  2. Executive Summary: A concise overview of the main points and recommendations.
  3. Table of Contents: Lists sections and sub-sections with page numbers.
  4. Introduction: Explains the purpose, scope, and background of the report.
  5. Main Body: Contains the detailed findings, analysis, and discussion.
  6. Conclusion: Summarizes key points and implications.
  7. Recommendations: Provides actionable suggestions (if required).
  8. Appendices: Includes supplementary material like charts, graphs, and raw data.
  9. References: Lists all sources cited in the report.

Step 4: Write the Draft

  • Follow your outline and begin writing each section.
  • Focus on clarity and coherence.
  • Avoid jargon unless it’s necessary for the audience.

Step 5: Revise and Edit

  • Review the draft for grammar, spelling, and formatting errors.
  • Ensure logical flow between sections.
  • Seek feedback from peers or supervisors.

Step 6: Finalize the Report

  • Incorporate feedback and make necessary revisions.
  • Format the report as per guidelines or standards.
  • Proofread one last time to ensure perfection.

Report Writing Tutorial

Common Mistakes in Report Writing and How to Avoid Them

1. Lack of Clarity

Solution: Use simple language and avoid ambiguous terms.

2. Overloading with Data

Solution: Present only relevant information and use visuals to summarize large datasets.

3. Ignoring the Audience

Solution: Tailor the tone, content, and structure to your target audience.

4. Weak Conclusions

Solution: Clearly summarize findings and reinforce the report’s purpose in the conclusion.

5. Poor Formatting

Solution: Use consistent fonts, headings, and spacing to ensure readability.


Tools for Report Writing

1. Word Processors

  • Microsoft Word
  • Google Docs

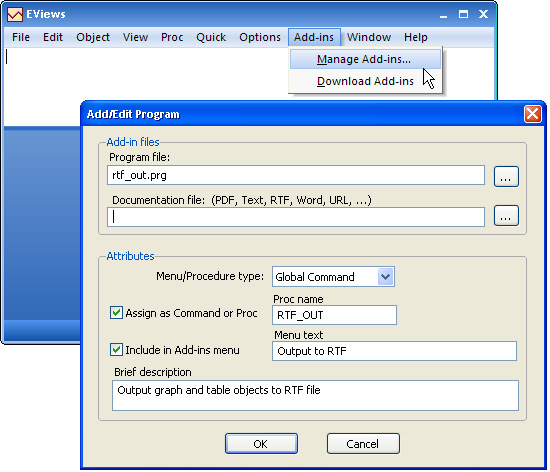
2. Data Visualization Tools

  • Microsoft Excel
  • Tableau
  • Google Data Studio

3. Grammar and Style Checkers

  • Grammarly
  • Hemingway Editor

4. Reference Management Tools

  • Zotero
  • EndNote

Best Practices for Effective Report Writing

1. Start with a Strong Executive Summary

The executive summary sets the tone for the report. Ensure it captures the main points succinctly.

2. Use Headings and Subheadings

Organize content into sections with clear headings to improve readability.

3. Incorporate Visuals

Graphs, tables, and infographics make data easier to understand and more engaging.

4. Maintain Objectivity

Avoid personal opinions unless explicitly requested. Focus on factual information.

5. Edit Ruthlessly

Trim unnecessary words and ensure every sentence adds value.


Examples of Report Writing

1. Academic Report Example

Title: “The Impact of Climate Change on Marine Biodiversity”

  • Executive Summary: Summarizes key findings on how rising temperatures affect marine species.
  • Main Body: Detailed analysis of data from global research studies.
  • Conclusion: Highlights the urgency for conservation efforts.

2. Business Report Example

Title: “Q2 Financial Performance Analysis”

  • Executive Summary: Overview of revenue, expenses, and profit margins.
  • Main Body: Comparison of quarterly performance metrics.
  • Recommendations: Strategies to reduce operational costs.

Report Writing Tutorial

Improving Report Writing Skills

1. Practice Regularly

The more reports you write, the better you’ll become.

2. Seek Feedback

Constructive criticism helps identify areas for improvement.

3. Attend Workshops or Courses

Professional training programs can enhance your writing skills.

4. Read Sample Reports

Analyze well-written reports to understand their structure and style.


Conclusion

Mastering report writing is a valuable skill that can advance your academic, professional, and personal endeavors. By following the steps outlined in this tutorial, you can produce reports that are not only informative but also impactful.

Remember, a great report combines thorough research, clear structure, and meticulous editing. Start practicing today, and elevate your report writing skills to the next level.

Needs help with similar assignment?

We are available 24x7 to deliver the best services and assignment ready within 3-4 hours? Order a custom-written, plagiarism-free paper

Get Answer Over WhatsApp Order Paper Now

Sage Accounting Software Tutorial|2025

Sage Accounting Software is a powerful and user-friendly solution designed to simplify financial management for small businesses, medium enterprises, and even larger organizations. With features like invoicing, expense tracking, tax calculation, and payroll integration, Sage Accounting Software empowers businesses to maintain accurate records and make informed financial decisions.

This tutorial provides a comprehensive guide to understanding and using Sage Accounting Software effectively. Whether you’re a business owner, accountant, or student, this article will help you unlock the full potential of Sage Accounting.


What is Sage Accounting Software?

Sage Accounting Software is a cloud-based financial management tool developed by Sage Group. It offers a range of solutions tailored to the needs of businesses across various industries. Known for its intuitive interface and robust functionality, Sage is a preferred choice for managing accounting tasks, ensuring compliance, and gaining real-time insights into financial performance.

Key Features of Sage Accounting Software

  1. Invoicing: Create and send professional invoices to clients.
  2. Expense Tracking: Monitor and categorize business expenses efficiently.
  3. Bank Reconciliation: Match transactions automatically with your bank records.
  4. Tax Compliance: Simplify VAT, GST, and other tax calculations.
  5. Payroll Integration: Manage employee salaries, taxes, and benefits.
  6. Reporting: Generate financial reports such as profit and loss, balance sheets, and cash flow statements.
  7. Multi-Currency Support: Ideal for businesses operating globally.
  8. Cloud Access: Access your accounts anytime, anywhere.

Why Use Sage Accounting Software?

1. Ease of Use

Sage is designed to be user-friendly, even for those with minimal accounting knowledge.

2. Scalability

Whether you’re running a small startup or a growing enterprise, Sage offers solutions that scale with your business.

3. Cost-Effectiveness

Sage Accounting Software provides affordable pricing plans tailored to different business needs.

4. Compliance and Security

With features designed to comply with tax regulations and protect data, Sage ensures peace of mind for users.

5. Integration

Easily integrates with other tools and platforms like CRM systems, payment gateways, and third-party apps.


Getting Started with Sage Accounting Software

Step 1: Choosing the Right Sage Solution

Sage offers various products to cater to different needs. Common options include:

  • Sage Business Cloud Accounting: Ideal for small businesses.
  • Sage Intacct: Designed for medium-sized enterprises.
  • Sage 50cloud Accounting: Combines desktop functionality with cloud accessibility.

Step 2: Signing Up and Setting Up Your Account

  1. Visit the official Sage website and select the product that suits your needs.
  2. Sign up by providing your business details.
  3. Customize your account settings, including currency, tax rates, and financial year.

Step 3: Navigating the Dashboard

The dashboard provides an overview of your business’s financial health, including:

  • Recent transactions
  • Invoices due
  • Cash flow insights
  • Quick links to key functions

Step 4: Setting Up Chart of Accounts

Organize your financial data by setting up a chart of accounts that categorizes assets, liabilities, equity, income, and expenses.


How to Use Sage Accounting Software

1. Managing Invoices

  • Navigate to the “Sales” section and click “Create Invoice.”
  • Fill in customer details, items or services provided, and payment terms.
  • Send invoices directly via email or download them as PDFs.

2. Tracking Expenses

  • Go to the “Expenses” tab and select “Add Expense.”
  • Input details such as expense type, amount, and payment method.
  • Attach receipts or supporting documents for recordkeeping.

3. Reconciling Bank Transactions

  • Connect your bank account to Sage.
  • Match transactions automatically using Sage’s reconciliation feature.
  • Resolve discrepancies by reviewing flagged items.

4. Generating Financial Reports

  • Access the “Reports” section to generate detailed reports.
  • Common reports include:
    • Profit and Loss Statement
    • Balance Sheet
    • Cash Flow Report
  • Customize report filters for specific time frames or categories.

5. Managing Payroll

  • Add employee details and set up payroll schedules.
  • Automate salary calculations, including taxes and benefits.
  • Generate payslips and maintain compliance with labor laws.

6. Tracking Taxes

  • Set up tax rates applicable to your business location.
  • Automatically calculate VAT, GST, or sales tax for transactions.
  • File tax returns directly from the software (available in some regions).

Sage Accounting Software

Tips for Using Sage Accounting Software Effectively

1. Regular Updates

Keep your software updated to access new features and maintain security.

2. Leverage Automation

Utilize automated reminders, recurring invoices, and scheduled payments to save time.

3. Customize Settings

Tailor the software’s settings to match your business’s specific needs.

4. Use Shortcuts

Learn keyboard shortcuts and favorite frequently used features for faster navigation.

5. Back Up Data

Even with cloud storage, regular backups ensure data safety in case of unexpected issues.


Common Challenges and Solutions

Challenge 1: Understanding Features

Solution: Utilize Sage’s online tutorials, user guides, and customer support.

Challenge 2: Integrating with Other Tools

Solution: Check compatibility with third-party applications or use Sage’s API for custom integrations.

Challenge 3: Adapting to Changes

Solution: Regularly train your team on updates and new functionalities.


Benefits of Sage Accounting Software

1. Time-Saving

Automated processes reduce manual workload.

2. Enhanced Accuracy

Minimizes human error in financial data management.

3. Improved Cash Flow Management

Real-time insights help monitor cash flow effectively.

4. Compliance

Built-in tax tools simplify regulatory compliance.

5. Mobility

Cloud-based access allows work from anywhere.


Sage Accounting Software

Industries That Benefit from Sage Accounting Software

  1. Retail: Streamlines sales tracking and inventory management.
  2. Construction: Tracks project costs and manages contractor payments.
  3. Nonprofits: Simplifies fund tracking and compliance reporting.
  4. Healthcare: Ensures accurate billing and payroll management.
  5. Hospitality: Manages bookings, expenses, and revenue efficiently.

Future of Sage Accounting Software

Sage continues to evolve by integrating artificial intelligence (AI), machine learning (ML), and advanced analytics. Future updates are expected to:

  • Enhance automation capabilities.
  • Improve integration with emerging technologies.
  • Provide more robust mobile applications.

Conclusion

Sage Accounting Software is an indispensable tool for businesses looking to streamline their financial operations. Its robust features, user-friendly interface, and scalability make it suitable for a wide range of industries. By understanding how to navigate and leverage Sage’s capabilities, businesses can achieve greater efficiency, accuracy, and compliance.

Start your journey with Sage Accounting Software today and transform the way you manage your finances. With continuous updates and support, Sage ensures you stay ahead in the competitive business landscape.

Needs help with similar assignment?

We are available 24x7 to deliver the best services and assignment ready within 3-4 hours? Order a custom-written, plagiarism-free paper

Get Answer Over WhatsApp Order Paper Now

SAP Tutorial|2024

SAP Tutorial offers a comprehensive guide to mastering SAP systems, making it easier for users to navigate and utilize its powerful business tools. This resource is designed to simplify complex processes, enhance productivity, and build expertise in SAP applications. SAP (Systems, Applications, and Products in Data Processing) is one of the most widely used enterprise resource planning (ERP) systems globally. Businesses across various industries leverage SAP to streamline processes, improve data management, and make informed decisions. This tutorial provides a comprehensive overview of SAP, its core modules, and how businesses can benefit from implementing SAP solutions. Whether you’re a student, professional, or business owner, this guide will help you understand SAP and how to get started.


SAP TutorialWhat is SAP?

SAP is a German multinational software company founded in 1972. Its ERP solutions help organizations manage business operations and customer relations effectively. SAP software integrates all critical business functions, including finance, human resources, supply chain, and customer service, into a unified system.

The primary advantage of SAP is its ability to centralize data management, enabling organizations to eliminate redundancies, enhance productivity, and achieve better visibility across their operations.


Why Learn SAP?

  1. High Demand in the Job Market: SAP skills are in high demand, with many organizations seeking SAP consultants, analysts, and developers.
  2. Improved Career Prospects: Learning SAP can lead to lucrative career opportunities in various industries.
  3. Streamlined Business Processes: Professionals can optimize their organizations’ operations using SAP tools and solutions.
  4. Versatile Application: SAP is used in multiple domains, including finance, supply chain, manufacturing, and IT.

Key Features of SAP

  1. Modular Architecture: SAP is structured into modules that cater to specific business functions.
  2. Real-time Data Processing: SAP systems process data in real-time, ensuring timely decision-making.
  3. Scalability: SAP solutions can scale with the growth of an organization.
  4. Integration: Seamlessly integrates with other software and platforms.
  5. Customization: SAP systems can be tailored to meet unique business requirements.

SAP Modules Overview

SAP is divided into several modules, categorized into functional and technical areas:

Functional Modules

  1. SAP FICO (Financial Accounting and Controlling):
    • Manages financial transactions, reporting, and accounts.
    • Key Submodules: General Ledger (GL), Accounts Payable (AP), Accounts Receivable (AR), and Cost Center Accounting.
  2. SAP MM (Materials Management):
    • Manages procurement and inventory processes.
    • Key Features: Purchase Order Management, Inventory Management, and Vendor Evaluation.
  3. SAP SD (Sales and Distribution):
    • Handles order management, pricing, and distribution.
    • Key Features: Sales Orders, Shipping, and Billing.
  4. SAP HR (Human Resources):
    • Manages employee data, payroll, and recruitment processes.
    • Key Features: Time Management, Payroll, and Employee Self-Service.
  5. SAP PP (Production Planning):
    • Focuses on production workflows and planning.
    • Key Features: Material Requirement Planning (MRP) and Capacity Planning.

Technical Modules

  1. SAP ABAP (Advanced Business Application Programming):
    • SAP’s programming language for developing applications.
  2. SAP BASIS:
    • Provides technical support for SAP systems, including system installation and maintenance.
  3. SAP HANA (High-Performance Analytic Appliance):
    • In-memory database platform for real-time analytics and data processing.
  4. SAP Security:
    • Ensures data protection and user authentication.

SAP Tutorial

Getting Started with SAP

Step 1: Understand Business Processes

Before diving into SAP, familiarize yourself with the business processes in your industry. Understanding workflows and requirements will help you grasp SAP modules better.

Step 2: Choose a Module

Select an SAP module that aligns with your career goals or organizational needs. For instance:

  • Finance professionals can start with SAP FICO.
  • HR professionals can explore SAP HR.

Step 3: Enroll in SAP Training

Join SAP training programs to gain hands-on experience. Online platforms like Coursera, LinkedIn Learning, and SAP’s official training portal offer excellent resources.

Step 4: Practice in a Sandbox Environment

Experiment with SAP systems in a sandbox or demo environment to understand the functionality and workflows.

Step 5: Get Certified

SAP certifications validate your expertise and make you stand out in the job market. Certifications are available for various modules and roles, such as SAP Consultant or Developer.


Benefits of SAP for Businesses

  1. Enhanced Efficiency: Automates repetitive tasks and streamlines processes.
  2. Improved Data Accuracy: Reduces manual errors through centralized data entry.
  3. Real-time Insights: Provides up-to-date information for informed decision-making.
  4. Compliance: Ensures regulatory compliance through built-in tools.
  5. Scalability: Grows with the organization’s needs.

Common Challenges and Solutions in SAP Implementation

Challenge 1: High Costs

Solution: Plan budgets carefully and explore cloud-based SAP solutions for cost-effectiveness.

Challenge 2: Complex Integration

Solution: Work with experienced SAP consultants to ensure smooth integration with existing systems.

Challenge 3: Resistance to Change

Solution: Provide comprehensive training and communicate the benefits to stakeholders.


Best Practices for SAP Users

  1. Regular Training: Keep up with updates and new features.
  2. Data Backup: Regularly back up data to prevent loss.
  3. User Access Control: Implement strict access controls to secure sensitive information.
  4. Monitor Performance: Use SAP tools to track system performance and address issues proactively.
  5. Leverage Analytics: Utilize SAP’s analytics capabilities to gain insights and drive growth.

SAP Tutorial

Top Industries Using SAP

  1. Manufacturing: Manages supply chain, production, and logistics.
  2. Healthcare: Enhances patient care and hospital management.
  3. Retail: Optimizes inventory and customer service.
  4. Finance: Streamlines accounting and compliance.
  5. Telecommunications: Improves network and customer management.

Future of SAP

The future of SAP lies in integrating cutting-edge technologies like artificial intelligence (AI), machine learning (ML), and the Internet of Things (IoT). SAP is also heavily investing in cloud-based solutions to provide businesses with scalable and cost-effective tools. The SAP S/4HANA Cloud is one such example, enabling real-time analytics and improved decision-making.


SAP Tutorial

Conclusion

SAP is a powerful tool for businesses looking to enhance their operations and achieve greater efficiency. By understanding its modules and functionalities, professionals can unlock career opportunities, and businesses can optimize processes. Whether you’re a beginner or looking to deepen your expertise, SAP offers vast resources to help you succeed. Start your SAP journey today and harness its potential for your career or business growth.

Needs help with similar assignment?

We are available 24x7 to deliver the best services and assignment ready within 3-4 hours? Order a custom-written, plagiarism-free paper

Get Answer Over WhatsApp Order Paper Now

Minitab Tutorial: Mastering Statistical Analysis|2025

Minitab Tutorial: Mastering Statistical Analysis provides a step-by-step guide to performing accurate and efficient data analysis using Minitab software. This tutorial simplifies statistical concepts, empowering users to make data-driven decisions with confidence. Minitab is a powerful statistical software widely used by professionals, educators, and students for data analysis, quality improvement, and business decision-making. This tutorial is designed to provide a comprehensive guide to Minitab’s functionalities, ensuring you can leverage its tools effectively for academic and professional projects.

In this article, we will target high-ranking keywords such as “Minitab tutorial,” “statistical software,” “data analysis with Minitab,” and “Minitab quality improvement” to optimize search rankings on Google and Bing.

Minitab Tutorial

What is Minitab?

Minitab is a robust statistical analysis software that simplifies complex data analysis tasks. It is widely used in manufacturing, healthcare, education, and other industries for:

  • Statistical process control (SPC)
  • Regression analysis
  • Hypothesis testing
  • ANOVA (Analysis of Variance)
  • Design of Experiments (DOE)

Minitab provides intuitive tools and features that make data analysis accessible to both beginners and seasoned professionals.

Why Choose Minitab for Statistical Analysis?

1. User-Friendly Interface

Minitab’s intuitive layout and simple navigation allow users to analyze data without extensive technical expertise.

2. Comprehensive Statistical Tools

The software includes a wide array of tools for descriptive statistics, inferential statistics, and predictive modeling.

3. Quality Improvement Features

Minitab supports Six Sigma and Lean methodologies, making it ideal for process improvement projects.

4. Interactive Visualizations

Generate high-quality charts, graphs, and plots that make data interpretation easier and more impactful.

5. Seamless Data Integration

Import data from Excel, CSV, and other formats, ensuring flexibility in handling datasets.

Key Features of Minitab

1. Descriptive Statistics

  • Summarize data using measures like mean, median, variance, and standard deviation.
  • Generate histograms and box plots for visual analysis.

2. Hypothesis Testing

  • Perform t-tests, chi-square tests, and z-tests to validate statistical assumptions.

3. Regression Analysis

  • Model relationships between variables using linear and nonlinear regression tools.

4. Control Charts

  • Monitor process stability with tools like X-bar, R, and p-charts.

5. DOE (Design of Experiments)

  • Optimize processes by experimenting with multiple variables simultaneously.

6. Graphical Analysis

  • Create scatterplots, Pareto charts, and time series plots to identify trends and relationships.

Minitab Tutorial

Step-by-Step Minitab Tutorial

Step 1: Getting Started with Minitab

  1. Install and Open Minitab: Download the software from the Minitab website and complete the installation process.
  2. Import Data: Click on “File” > “Open Project” or “Import Data” to load datasets from Excel, CSV, or text files.
  3. Explore Data: Use the worksheet view to understand the structure of your dataset.

Step 2: Data Cleaning and Preparation

  • Remove duplicates and handle missing values using Minitab’s data preparation tools.
  • Filter and sort data to focus on relevant subsets.

Step 3: Descriptive Statistics

  1. Go to “Stat” > “Basic Statistics” > “Display Descriptive Statistics.”
  2. Select variables to summarize and generate numerical summaries and visualizations.

Step 4: Conducting Hypothesis Testing

  • Navigate to “Stat” > “Basic Statistics” > “1-Sample t” (or other relevant tests).
  • Set confidence levels and enter test parameters.

Step 5: Regression Analysis

  1. Click on “Stat” > “Regression” > “Regression.”
  2. Select predictor and response variables.
  3. Interpret the coefficients, R-squared values, and p-values.

Step 6: Creating Control Charts

  1. Go to “Stat” > “Control Charts” > Choose the chart type (e.g., X-bar, R-chart).
  2. Select data columns and set subgroup sizes.
  3. Analyze process stability based on chart patterns.

Step 7: Designing Experiments

  1. Navigate to “Stat” > “DOE” > “Create Factorial Design.”
  2. Specify factors, levels, and responses.
  3. Use results to optimize process settings.

Step 8: Generating Graphs

  • Use “Graph” > “Chart Builder” to create scatterplots, histograms, and Pareto charts.
  • Customize axis labels, titles, and colors for professional-quality visuals.

Applications of Minitab

1. Manufacturing

  • Perform quality control and process improvement using SPC and DOE.
  • Reduce defects and improve product consistency.

2. Healthcare

  • Analyze patient outcomes and clinical trial data.
  • Monitor healthcare processes for better efficiency and safety.

3. Education

  • Teach statistical concepts through interactive data analysis projects.
  • Support research with advanced statistical modeling tools.

4. Business Analytics

  • Conduct market research and customer satisfaction surveys.
  • Use predictive analytics to forecast sales and trends.

5. Engineering

  • Optimize designs and troubleshoot issues using experimental design.
  • Monitor system reliability and performance.

Minitab Tutorial

Tips for Effective Use of Minitab

1. Plan Your Analysis

Outline your goals and choose appropriate statistical methods before starting.

2. Familiarize Yourself with Tools

Explore Minitab’s built-in help guides and tutorials to understand its functionalities.

3. Use Templates

Save time by using predefined templates for control charts and experiments.

4. Validate Assumptions

Ensure your data meets the assumptions of the statistical tests you plan to perform.

5. Export and Share Results

Export charts and analysis results to PDF or Excel for presentations and reports.

Frequently Asked Questions (FAQs)

1. Is Minitab easy to learn?

Yes, Minitab is user-friendly, with an intuitive interface and extensive documentation to support beginners.

2. Can Minitab handle large datasets?

Yes, Minitab efficiently processes large datasets, making it suitable for complex analyses.

3. Is Minitab available for Mac?

Minitab is primarily designed for Windows, but it can be used on Mac through virtual machines or Boot Camp.

4. What industries use Minitab?

Minitab is widely used in manufacturing, healthcare, education, business analytics, and engineering.

5. What is the cost of Minitab?

Pricing varies based on licensing options. Visit the Minitab website for detailed pricing information.

Conclusion

Minitab is an essential tool for anyone involved in data analysis and quality improvement. Its powerful statistical tools, user-friendly interface, and versatile applications make it a top choice for professionals and students alike. Whether you’re conducting academic research, optimizing manufacturing processes, or analyzing business data, Minitab provides the tools you need to achieve meaningful insights.

By following this tutorial and exploring Minitab’s extensive features, you can streamline your data analysis tasks and deliver high-quality results. Start your journey with Minitab today and unlock the potential of advanced statistical analysis!

Needs help with similar assignment?

We are available 24x7 to deliver the best services and assignment ready within 3-4 hours? Order a custom-written, plagiarism-free paper

Get Answer Over WhatsApp Order Paper Now

QDA Miner Tutorial: Mastering Qualitative Data Analysis|2025

QDA Miner is a cutting-edge software designed for qualitative data analysis and mixed-method research. Widely used by researchers, students, and professionals, QDA Miner simplifies the process of analyzing textual, visual, and structured data. This tutorial will walk you through the essential features, benefits, and practical applications of QDA Miner, ensuring you can effectively utilize it for your academic or professional projects.

In this comprehensive guide, we will focus on the high-ranking keywords “QDA Miner tutorial,” “qualitative data analysis software,” “text analysis,” “visual data analysis,” and “mixed methods research” to ensure this article ranks well on Google and Bing.

QDA Miner Tutorial

What is QDA Miner?

QDA Miner, developed by Provalis Research, is a versatile software tailored for qualitative and mixed-method data analysis. It supports:

  • Textual data analysis
  • Image coding and annotation
  • Statistical and graphical analysis
  • Integration with quantitative tools like SPSS and Excel

This software is widely used in academic research, market analysis, and social science studies.

Why Use QDA Miner for Qualitative Data Analysis?

1. Efficient Data Management

QDA Miner allows users to import data from multiple sources, including text files, spreadsheets, and databases, making it a one-stop solution for data organization.

2. Advanced Coding Tools

With features like automatic text coding, in-vivo coding, and hierarchical coding structures, QDA Miner simplifies the analysis of large datasets.

3. Visual Analysis

The software supports visual representation of data through word clouds, bar charts, and pie charts, enhancing interpretability.

4. Mixed-Method Compatibility

QDA Miner integrates seamlessly with quantitative tools, enabling researchers to conduct mixed-method analyses effortlessly.

5. User-Friendly Interface

Its intuitive design ensures that even beginners can navigate and utilize the software effectively.

Key Features of QDA Miner

1. Text Coding and Analysis

  • Manual and automatic text coding
  • Support for pattern matching and text retrieval
  • Integration with WordStat for advanced text analytics

2. Image Coding

  • Annotate and code images directly within the software
  • Combine image analysis with textual data

3. Visualization Tools

  • Generate word clouds, heatmaps, and network diagrams
  • Customize visual outputs for presentations

4. Statistical Analysis

  • Perform statistical tests on coded data
  • Analyze co-occurrence and clustering of themes

5. Data Export Options

  • Export results to Excel, SPSS, or PDF for further analysis
  • Share interactive dashboards with stakeholders

QDA Miner Tutorial

Step-by-Step QDA Miner Tutorial

Step 1: Setting Up Your Project

  1. Install QDA Miner: Download and install the software from the Provalis Research website.
  2. Create a New Project: Open QDA Miner and select “New Project.”
  3. Import Data: Add textual, visual, or structured data by selecting the appropriate file format.

Step 2: Organizing Data

  • Use folders and subfolders to categorize data sources.
  • Assign attributes to data entries for easier filtering and analysis.

Step 3: Coding Text and Images

  1. Manual Coding: Highlight text or image regions and assign codes.
  2. Automatic Coding: Use the “Text Search” feature to identify recurring themes.
  3. Hierarchical Coding: Organize codes into parent and child categories.

Step 4: Analyzing Data

  • Utilize “Code Frequency Analysis” to identify dominant themes.
  • Perform “Cluster Analysis” to explore relationships between codes.

Step 5: Visualizing Results

  • Generate word clouds to represent theme prominence.
  • Use bar charts to compare code frequencies across datasets.

Step 6: Exporting and Reporting

  • Export findings to Excel or SPSS for advanced statistical tests.
  • Create professional reports with embedded charts and diagrams.

Applications of QDA Miner

1. Academic Research

Researchers use QDA Miner for analyzing interview transcripts, focus group discussions, and survey responses.

2. Market Research

The software helps businesses analyze customer feedback, reviews, and social media content to identify market trends.

3. Policy Analysis

Government and nonprofit organizations use QDA Miner to evaluate policy documents and public opinion data.

4. Social Science Studies

QDA Miner is a preferred tool for qualitative studies in sociology, psychology, and anthropology.

Tips for Effective Use of QDA Miner

1. Plan Your Coding Strategy

Define clear coding categories before starting the analysis to ensure consistency and accuracy.

2. Leverage Automatic Coding

Use the automatic coding feature to save time, especially when dealing with large datasets.

3. Regularly Backup Your Work

Save your project files frequently to avoid data loss.

4. Explore Advanced Features

Familiarize yourself with additional tools like WordStat and SimStat for enhanced analytical capabilities.

QDA Miner Tutorial

Frequently Asked Questions (FAQs)

1. Is QDA Miner suitable for beginners?

Yes, the software’s intuitive interface and comprehensive tutorials make it accessible to users with varying levels of expertise.

2. Can I use QDA Miner for quantitative analysis?

While QDA Miner focuses on qualitative analysis, it integrates with tools like SPSS for quantitative data analysis.

3. What file formats does QDA Miner support?

It supports a wide range of formats, including TXT, RTF, DOC, PDF, and image files.

4. Is QDA Miner compatible with Mac?

Currently, QDA Miner is designed for Windows. Mac users can run it using virtual machines or Boot Camp.

5. What is the cost of QDA Miner?

Pricing varies depending on the license type. Visit the Provalis Research website for detailed pricing information.

Conclusion

QDA Miner is an indispensable tool for qualitative and mixed-method data analysis. With its powerful features, user-friendly interface, and compatibility with other tools, it empowers researchers to derive meaningful insights from complex datasets. Whether you’re an academic, a market analyst, or a policy evaluator, mastering QDA Miner can significantly enhance your analytical capabilities.

By following this tutorial and leveraging the software’s advanced features, you can streamline your research process and produce impactful results. Start exploring QDA Miner today and take your qualitative data analysis to the next level!

Needs help with similar assignment?

We are available 24x7 to deliver the best services and assignment ready within 3-4 hours? Order a custom-written, plagiarism-free paper

Get Answer Over WhatsApp Order Paper Now

QuickBooks Assignment Help: Your Comprehensive Guide to Academic Success|2025

QuickBooks, a powerful accounting software, is widely used by businesses, accountants, and students to manage financial records, payroll, and other accounting functions efficiently. For students pursuing accounting or business courses, understanding QuickBooks is essential. However, completing QuickBooks assignments can often be challenging due to the software’s technical nature. This is where QuickBooks Assignment Help services come into play, offering expert guidance and support to students.

In this article, we will delve into the details of QuickBooks Assignment Help, exploring its benefits, features, and why it is essential for students aiming to excel in their academic pursuits.

What is QuickBooks?

QuickBooks is a comprehensive accounting software developed by Intuit. It is designed to cater to small and medium-sized businesses by offering tools for:

  • Invoicing
  • Payroll management
  • Expense tracking
  • Tax preparation
  • Financial reporting

With both desktop and online versions, QuickBooks provides flexibility and ease of use, making it a preferred choice for businesses worldwide.

Why Do Students Need QuickBooks Assignment Help?

1. Complexity of the Software

QuickBooks assignments often involve intricate tasks such as setting up accounts, reconciling bank statements, and preparing financial reports. These tasks require a deep understanding of accounting principles and the QuickBooks interface.

2. Time Constraints

Students often juggle multiple assignments, part-time jobs, and personal commitments. QuickBooks Assignment Help services save time by providing expert assistance, enabling students to focus on other academic responsibilities.

3. Lack of Expertise

Many students are new to accounting software and struggle with the technical aspects of QuickBooks. Expert guidance helps bridge this knowledge gap.

4. High Academic Standards

QuickBooks assignments demand accuracy and adherence to specific academic guidelines. Professional help ensures assignments meet these standards, leading to better grades.

Features of QuickBooks Assignment Help Services

1. Expert Guidance

Professionals with expertise in accounting and QuickBooks provide step-by-step solutions, ensuring students understand the concepts behind their assignments.

2. Customized Solutions

Assignments are tailored to meet individual requirements, aligning with the student’s academic level and specific instructions.

3. Timely Delivery

QuickBooks Assignment Help services prioritize deadlines, ensuring students receive their completed assignments on time.

4. 24/7 Support

With round-the-clock assistance, students can resolve their queries and get updates on their assignments anytime.

5. Plagiarism-Free Work

Originality is guaranteed, with assignments crafted from scratch to ensure uniqueness and adherence to academic integrity.

6. Affordable Pricing

Most services offer competitive pricing to cater to students’ budgets without compromising on quality.

Types of QuickBooks Assignments Covered

1. Setting Up QuickBooks

Assignments involving the initial setup of QuickBooks, such as creating a company profile, configuring settings, and adding users.

2. Bank Reconciliation

Tasks that require reconciling bank statements with company records to ensure accuracy.

3. Financial Reporting

Assignments focused on generating and analyzing financial reports, such as profit and loss statements, balance sheets, and cash flow statements.

4. Inventory Management

Managing and tracking inventory using QuickBooks, including setting up inventory lists and generating inventory reports.

5. Payroll Processing

Assignments that involve setting up and managing payroll, including calculating salaries, deductions, and taxes.

6. Tax Preparation

Tasks related to preparing tax forms and reports using QuickBooks.

7. Integration with Other Tools

Assignments involving the integration of QuickBooks with third-party tools like Excel, PayPal, or Shopify.

QuickBooks Assignment Help

Benefits of QuickBooks Assignment Help

1. Improved Academic Performance

Expert guidance helps students submit high-quality assignments, boosting their grades and overall academic performance.

2. Enhanced Understanding

With detailed solutions and explanations, students gain a deeper understanding of QuickBooks and accounting principles.

3. Stress Reduction

By outsourcing their assignments, students can reduce stress and focus on other important aspects of their education.

4. Skill Development

Interacting with professionals helps students develop practical skills in using QuickBooks, preparing them for real-world applications.

5. Time Management

QuickBooks Assignment Help services allow students to manage their time effectively by delegating complex tasks.

How to Choose the Best QuickBooks Assignment Help Service

1. Reputation

Look for services with positive reviews and testimonials from previous clients.

2. Expertise

Ensure the service employs qualified professionals with experience in QuickBooks and accounting.

3. Pricing

Compare prices to find a service that offers quality assistance at an affordable rate.

4. Customer Support

Choose a service that provides 24/7 support for seamless communication.

5. Timely Delivery

Verify that the service guarantees timely delivery of assignments to avoid late submissions.

6. Plagiarism Policy

Ensure the service provides plagiarism-free work with proper citations and references.

QuickBooks Assignment Help for Different Academic Levels

Undergraduate Students

  • Basic accounting tasks
  • Introduction to QuickBooks features

Postgraduate Students

  • Advanced accounting functions
  • Research-based assignments

Professional Certification Courses

  • Practical application of QuickBooks in real-world scenarios
  • Case studies and project work

Case Studies: Success Stories with QuickBooks Assignment Help

Case Study 1: Enhancing Financial Analysis Skills

A business student struggling with financial analysis assignments sought QuickBooks Assignment Help. With expert guidance, they learned to generate and interpret financial reports, leading to improved grades and confidence.

Case Study 2: Mastering Payroll Management

An accounting student required help with payroll processing assignments. The service provided step-by-step instructions, enabling the student to master payroll functions in QuickBooks and excel in their coursework.

QuickBooks Assignment Help

Frequently Asked Questions (FAQs)

1. What is QuickBooks Assignment Help?

It is a service that provides expert assistance to students in completing QuickBooks-related assignments.

2. Who Can Benefit from QuickBooks Assignment Help?

Students pursuing accounting, business, or finance courses, as well as those enrolled in professional certification programs.

3. How Much Does QuickBooks Assignment Help Cost?

Prices vary depending on the complexity of the assignment and the service provider. Most services offer affordable packages for students.

4. Is QuickBooks Assignment Help Reliable?

Yes, as long as you choose a reputable service with qualified experts and positive reviews.

5. Can I Get Help with Urgent Assignments?

Many services offer expedited assistance for urgent assignments, ensuring timely delivery.

Conclusion

QuickBooks Assignment Help is an invaluable resource for students aiming to excel in their academic and professional endeavors. By providing expert guidance, timely assistance, and tailored solutions, these services bridge the gap between theoretical knowledge and practical application. Whether you’re struggling with basic QuickBooks tasks or advanced financial analysis, professional help ensures that you achieve your academic goals with ease.

Investing in QuickBooks Assignment Help not only boosts your grades but also enhances your understanding of accounting principles and software applications. Choose a reliable service today and take the first step toward academic success!


Needs help with similar assignment?

We are available 24x7 to deliver the best services and assignment ready within 3-4 hours? Order a custom-written, plagiarism-free paper

Get Answer Over WhatsApp Order Paper Now

MATLAB: The Ultimate Guide to High-Performance Computing and Visualization|2025

MATLAB, an abbreviation for Matrix Laboratory, is a high-level programming platform designed for engineers, scientists, and researchers. With powerful capabilities for numerical computation, data visualization, and algorithm development, MATLAB is a cornerstone for solving complex mathematical problems and creating interactive applications. This article explores MATLAB’s features, benefits, applications, and its role as a premier tool for technical computing.

What is MATLAB?

MATLAB is a proprietary software developed by MathWorks, primarily used for numerical analysis and computational tasks. Its matrix-based programming environment makes it uniquely suited for handling mathematical operations, simulations, and data processing.

Whether you’re an academic, a researcher, or a professional engineer, MATLAB provides a versatile ecosystem for developing solutions across various domains, including signal processing, machine learning, robotics, and control systems.

MATLAB

Key Features of MATLAB

1. Matrix-Based Computing

MATLAB’s core is built around matrices, enabling efficient handling of linear algebra operations, multidimensional arrays, and vectorized computations.

2. Comprehensive Libraries

MATLAB comes with a wide range of built-in functions and toolboxes for specialized tasks such as optimization, statistics, and image processing.

3. Advanced Data Visualization

With MATLAB, users can create 2D and 3D plots, animations, and interactive visualizations to interpret data and results effectively.

4. Simulink Integration

Simulink, a companion product of MATLAB, is used for modeling, simulating, and analyzing dynamic systems. It’s particularly popular in control engineering and real-time applications.

5. Support for Machine Learning and AI

MATLAB includes tools for building, training, and deploying machine learning and deep learning models, offering flexibility for both beginners and experts.

6. Cross-Platform Compatibility

MATLAB is compatible with Windows, macOS, and Linux operating systems, ensuring broad accessibility.

7. App Development

The App Designer feature allows users to create professional-grade, interactive applications with drag-and-drop components.

8. Cloud Computing

MathWorks provides MATLAB Online, enabling users to run MATLAB on the cloud without the need for local installations.

Benefits of Using MATLAB

1. Ease of Use

MATLAB’s intuitive interface and extensive documentation make it accessible for users of all skill levels, from beginners to advanced programmers.

2. Rapid Prototyping

With its interactive environment, MATLAB accelerates the development cycle, allowing users to prototype and validate concepts quickly.

3. Integration with External Tools

MATLAB integrates seamlessly with other programming languages like Python, C++, and Java, as well as with hardware platforms like Arduino and Raspberry Pi.

4. High Performance

Optimized algorithms and GPU support ensure that MATLAB delivers high performance for computationally intensive tasks.

5. Scalable Solutions

From small-scale academic projects to enterprise-level applications, MATLAB provides scalable solutions that cater to diverse needs.

6. Extensive Community Support

MATLAB boasts a vast user community, forums, and online resources, offering robust support and collaboration opportunities.

Applications of MATLAB

1. Signal and Image Processing

MATLAB is widely used for analyzing, processing, and visualizing signals and images. Applications include speech recognition, medical imaging, and video analysis.

2. Machine Learning and Data Science

Data scientists rely on MATLAB for tasks such as predictive modeling, feature extraction, and neural network design.

3. Control Systems

Engineers use MATLAB and Simulink for designing and simulating control systems in industries like automotive and aerospace.

4. Financial Modeling

In the finance sector, MATLAB is employed for risk assessment, portfolio optimization, and algorithmic trading.

5. Robotics and Automation

MATLAB supports robotic simulations, sensor integration, and path planning, making it a favorite in the robotics community.

6. Academic Research

MATLAB is a staple in academia for teaching and research, enabling students and researchers to tackle complex problems with ease.

7. Internet of Things (IoT)

With MATLAB, users can analyze IoT data, design smart systems, and develop applications for connected devices.

MATLAB

How to Get Started with MATLAB

Step 1: Install MATLAB

Purchase a license or use the trial version from the MathWorks website. MATLAB can also be accessed via MATLAB Online for cloud-based usage.

Step 2: Familiarize Yourself with the Interface

Explore the MATLAB environment, including the Command Window, Editor, and Workspace. Use the built-in tutorials to understand the basics.

Step 3: Learn Basic Syntax

Begin by learning MATLAB’s syntax and commands for basic mathematical operations, plotting, and scripting.

Step 4: Explore Toolboxes

Depending on your domain, install and explore MATLAB toolboxes such as Signal Processing, Image Processing, or Machine Learning.

Step 5: Build and Test Projects

Apply your knowledge to small projects, gradually advancing to more complex tasks as you gain confidence.

Tips for Maximizing MATLAB’s Potential

1. Leverage Online Resources

Utilize MathWorks’ online resources, including tutorials, webinars, and user forums, to expand your knowledge.

2. Write Efficient Code

Optimize your code by using vectorized operations and avoiding loops where possible to enhance performance.

3. Use Version Control

Integrate MATLAB with Git or other version control systems to manage code versions effectively.

4. Collaborate with Teams

Use MATLAB’s collaboration tools and cloud features to work seamlessly with team members.

5. Stay Updated

Keep your MATLAB installation up to date to access the latest features and enhancements.

Case Studies: MATLAB in Action

Case Study 1: Autonomous Vehicle Development

Automotive companies use MATLAB and Simulink to develop and test algorithms for autonomous vehicles, including lane detection, object recognition, and adaptive cruise control.

Case Study 2: Climate Modeling

Researchers use MATLAB to simulate climate patterns and analyze environmental data, contributing to sustainability and climate change mitigation efforts.

Case Study 3: Healthcare Innovations

MATLAB plays a pivotal role in healthcare, enabling the development of diagnostic tools, medical imaging systems, and wearable health monitoring devices.

MATLAB vs. Alternatives

MATLAB vs. Python

While Python is a free, open-source language with extensive libraries, MATLAB offers a specialized environment for numerical and engineering tasks. MATLAB’s toolboxes and ease of use make it a preferred choice for technical computing.

MATLAB vs. R

R is tailored for statistical analysis, whereas MATLAB provides a more comprehensive suite for numerical computation, visualization, and engineering applications.

MATLAB vs. Octave

GNU Octave is an open-source alternative to MATLAB, but it lacks the advanced toolboxes and commercial support that MATLAB provides.

MATLAB Certification and Careers

Certification Programs

MathWorks offers certifications such as MATLAB Associate and MATLAB Professional, which validate your skills and enhance your career prospects.

Career Opportunities

Proficiency in MATLAB opens doors to careers in engineering, data science, financial modeling, research, and academia. Many employers prioritize candidates with MATLAB expertise.

Future Trends in MATLAB

1. Artificial Intelligence Integration

MATLAB continues to enhance its AI capabilities, providing tools for developing and deploying AI models in various industries.

2. Quantum Computing

With the rise of quantum computing, MATLAB is exploring integrations to support quantum algorithms and simulations.

3. Industry 4.0

MATLAB is aligning with Industry 4.0 trends by supporting smart manufacturing, IoT, and digital twins.

Conclusion

MATLAB stands as a powerful and versatile platform for numerical computation, data visualization, and application development. Its extensive capabilities, combined with user-friendly features, make it a go-to solution for professionals and researchers worldwide.

Whether you’re an engineer designing control systems, a scientist analyzing data, or a student learning the fundamentals of programming, MATLAB provides the tools you need to succeed. Invest in MATLAB today and unlock the potential to solve the most complex challenges with ease.

Needs help with similar assignment?

We are available 24x7 to deliver the best services and assignment ready within 3-4 hours? Order a custom-written, plagiarism-free paper

Get Answer Over WhatsApp Order Paper Now

KOBO Toolbox Tutorial: The Comprehensive Guide to Data Collection and Analysis|2025

The KOBO Toolbox Tutorial provides a comprehensive guide for users to effectively design and manage surveys using this powerful open-source tool. Whether you’re conducting research or gathering field data, this tutorial simplifies the process, ensuring accurate data collection and analysis. In the modern world, data collection and analysis have become essential across various sectors, including humanitarian aid, development projects, academic research, and government initiatives. KOBO Toolbox is a leading open-source platform designed to make data collection and analysis efficient, accessible, and user-friendly. This article explores KOBO Toolbox, its features, benefits, applications, and why it’s an indispensable tool for data-driven projects.

What is KOBO Toolbox?

KOBO Toolbox is a free and open-source software suite primarily designed for field data collection in challenging environments. Developed by the Harvard Humanitarian Initiative, it supports mobile data collection, offering tools for creating surveys, collecting data offline, and managing datasets.

With KOBO Toolbox, users can design complex surveys, gather data through mobile devices, and analyze results effectively. The platform’s versatility makes it a popular choice among humanitarian organizations, researchers, and NGOs worldwide.

KOBO Toolbox Tutorial

Key Features of KOBO Toolbox

1. User-Friendly Interface

KOBO Toolbox provides an intuitive interface that simplifies survey design and data collection. Both beginners and experienced users can create forms without extensive technical expertise.

2. Advanced Survey Design

The platform supports a variety of question types, including multiple-choice, text, numeric, date, and ranking. Users can add skip logic, constraints, and validation criteria to ensure accurate responses.

3. Offline Data Collection

KOBO Toolbox allows offline data collection through its mobile app, making it ideal for areas with limited or no internet connectivity. Data can be synchronized with the server once connectivity is restored.

4. Multi-Language Support

With multi-language capabilities, KOBO Toolbox enables surveys to be conducted in diverse linguistic contexts, enhancing inclusivity and accessibility.

5. Data Management and Analysis

The platform offers robust tools for data management, including data cleaning, exporting in multiple formats (Excel, CSV, SPSS), and generating basic analytical reports.

6. Integration with Other Tools

KOBO Toolbox integrates seamlessly with other platforms, such as Power BI and GIS tools, to enhance data visualization and spatial analysis.

7. Secure and Encrypted

Data security is a priority for KOBO Toolbox. It provides encryption features and secure hosting options to protect sensitive information.

8. Free and Open Source

As a free tool, KOBO Toolbox ensures cost-effectiveness for organizations of all sizes. Its open-source nature allows customization to meet specific project needs.

Benefits of Using KOBO Toolbox

1. Cost-Effective Solution

KOBO Toolbox eliminates the need for expensive data collection tools, making it an excellent choice for budget-conscious organizations.

2. Flexibility in Deployment

Whether you’re collecting data in urban areas or remote regions, KOBO Toolbox adapts to diverse environments with ease.

3. Increased Efficiency

By automating data collection and validation, KOBO Toolbox minimizes errors and saves time compared to traditional paper-based methods.

4. Scalability

From small surveys to large-scale studies, KOBO Toolbox accommodates projects of any size, ensuring scalability and flexibility.

5. Community Support

KOBO Toolbox boasts an active user community and comprehensive documentation, providing valuable support and resources for users.

KOBO Toolbox Tutorial

Applications of KOBO Toolbox

1. Humanitarian Aid and Disaster Response

KOBO Toolbox is widely used in humanitarian efforts to assess needs, monitor progress, and evaluate outcomes. For example, organizations like UNICEF and the Red Cross rely on KOBO Toolbox for rapid assessments during emergencies.

2. Public Health Surveys

Health professionals utilize KOBO Toolbox to collect epidemiological data, monitor disease outbreaks, and evaluate public health interventions.

3. Development Projects

NGOs and development agencies use KOBO Toolbox for baseline surveys, impact assessments, and project monitoring to ensure effective resource allocation.

4. Academic Research

Researchers across disciplines leverage KOBO Toolbox to gather qualitative and quantitative data, conduct longitudinal studies, and manage large datasets.

5. Government and Policy Making

Governments employ KOBO Toolbox to collect census data, monitor service delivery, and engage citizens in participatory governance.

6. Environmental Conservation

KOBO Toolbox supports conservationists in tracking wildlife populations, mapping natural resources, and assessing environmental impacts.

How to Get Started with KOBO Toolbox

Step 1: Create an Account

Visit the KOBO Toolbox website and sign up for a free account. You can choose between the humanitarian server (designed for NGOs) and the research server (ideal for general use).

Step 2: Design Your Survey

Use the form builder to create your survey. Add questions, configure skip logic, and set validation criteria as needed.

Step 3: Deploy Your Survey

Publish the survey and generate a unique link or QR code for data collectors. The survey can be accessed via the KOBO Collect app or a web browser.

Step 4: Collect Data

Data collectors can use smartphones or tablets to gather responses offline. The app’s intuitive design ensures ease of use in the field.

Step 5: Analyze Results

Once data is synchronized with the server, export it in your preferred format for detailed analysis. Use visualization tools to generate insights and share findings with stakeholders.

Tips for Effective Use of KOBO Toolbox

1. Plan Your Survey

Define clear objectives and design your survey with precision to ensure high-quality data.

2. Train Data Collectors

Provide adequate training to data collectors to familiarize them with the app and survey requirements.

3. Test Your Form

Conduct a pilot test to identify and resolve any issues before full deployment.

4. Ensure Data Security

Use password-protected accounts and encrypted servers to safeguard sensitive information.

5. Leverage Community Resources

Engage with the KOBO Toolbox community to access best practices, tutorials, and troubleshooting tips.

KOBO Toolbox Tutorial

Case Studies: KOBO Toolbox in Action

Case Study 1: Humanitarian Crisis in Syria

During the Syrian refugee crisis, KOBO Toolbox was instrumental in assessing the needs of displaced populations. NGOs used the platform to collect real-time data on shelter, food, and medical requirements, enabling timely interventions.

Case Study 2: Public Health Monitoring in Kenya

The Kenyan Ministry of Health employed KOBO Toolbox to monitor vaccination campaigns. The platform’s offline capabilities allowed data collection in remote regions, ensuring comprehensive coverage.

Case Study 3: Wildlife Conservation in Brazil

Environmental researchers in the Amazon used KOBO Toolbox to track deforestation and wildlife populations. The integration with GIS tools facilitated spatial analysis and informed conservation strategies.

Challenges and Limitations

While KOBO Toolbox is a powerful tool, it’s not without challenges:

  • Learning Curve: New users may require time to master advanced features.
  • Technical Issues: Occasional bugs and server downtime can impact workflow.
  • Dependency on Devices: The platform relies on mobile devices, which may be costly or unavailable in some contexts.
  • Data Privacy Concerns: Ensuring compliance with data protection regulations is essential.

Why Choose KOBO Toolbox Over Alternatives?

1. Cost Advantage

Unlike commercial tools like SurveyMonkey or Qualtrics, KOBO Toolbox is entirely free, making it accessible to all users.

2. Offline Functionality

Many alternatives lack robust offline capabilities, giving KOBO Toolbox a significant edge in remote areas.

3. Customizability

As an open-source platform, KOBO Toolbox allows users to tailor features to specific project needs.

4. Community-Driven Development

The active user community contributes to continuous improvement and innovation, ensuring the platform evolves to meet user demands.

KOBO Toolbox Tutorial

Future of KOBO Toolbox

As technology advances, KOBO Toolbox continues to enhance its features and expand its applications. Upcoming developments include:

  • Enhanced Analytics: Integration with advanced analytics tools for deeper insights.
  • AI-Powered Insights: Leveraging artificial intelligence to identify patterns and trends in datasets.
  • Expanded Integration: Broader compatibility with other platforms and software.
  • Improved User Experience: Ongoing refinements to the interface and functionality.

Conclusion

KOBO Toolbox is a game-changing tool for data collection and analysis, offering unmatched flexibility, cost-effectiveness, and accessibility. Whether you’re conducting a small-scale survey or managing a large humanitarian project, KOBO Toolbox equips you with the tools needed to succeed.

By embracing KOBO Toolbox, organizations and individuals can harness the power of data to drive informed decisions, achieve impactful outcomes, and create a better future. Start your journey with KOBO Toolbox today and experience the transformative potential of efficient data collection and analysis.

Needs help with similar assignment?

We are available 24x7 to deliver the best services and assignment ready within 3-4 hours? Order a custom-written, plagiarism-free paper

Get Answer Over WhatsApp Order Paper Now

Comprehensive Guide to eViews: Unlocking the Power of Econometric Analysis|2025

The Comprehensive Guide to eViews: Unlocking the Power of Econometric Analysis provides an in-depth exploration of how to leverage eViews for efficient data analysis and econometric modeling. This guide will help users at all levels master the software, enabling them to confidently analyze economic data, create models, and draw meaningful conclusions.

In the realm of econometric analysis and forecasting, eViews stands out as a powerful software tool that caters to professionals, academics, and students alike. With its robust capabilities for time-series analysis, statistical modeling, and data management, eViews has become an indispensable asset for economists and researchers worldwide. This article explores the features, benefits, and applications of eViews, offering a detailed tutorial on how to maximize its potential.

Comprehensive Guide to eViews

What is eViews?

eViews, short for “Econometric Views,” is a statistical software package designed specifically for econometric analysis and forecasting. Developed by Quantitative Micro Software (QMS), eViews combines an intuitive interface with advanced statistical tools, making it suitable for both novice users and seasoned professionals.

Key Features of eViews

  1. Time-Series Analysis:

    • Perform detailed time-series analysis, including stationarity testing, ARIMA modeling, and seasonal adjustments.
    • Identify trends, patterns, and relationships within your dataset.
  2. Data Management:

    • Import data from various sources, including Excel, CSV, and databases.
    • Organize and manipulate datasets efficiently with built-in tools.
  3. Statistical Analysis:

    • Access a wide range of statistical tests, including hypothesis testing, regression analysis, and correlation matrices.
    • Estimate linear and nonlinear models with ease.
  4. Forecasting Capabilities:

    • Generate accurate forecasts based on historical data.
    • Use advanced techniques like vector autoregression (VAR) and vector error correction models (VECM).
  5. User-Friendly Interface:

    • Enjoy a clean and intuitive graphical user interface that simplifies complex analyses.
    • Utilize drag-and-drop functionality for quick operations.
  6. Customizable Output:

    • Generate comprehensive reports with graphs, tables, and statistical summaries.
    • Export results to Word, Excel, or PDF for presentations and publications.

Why Choose eViews for Econometric Analysis?

1. Versatility:

eViews supports a wide range of data formats and analytical methods, making it suitable for diverse research needs.

2. Accuracy:

Its advanced algorithms ensure precise calculations, enhancing the reliability of results.

3. Speed:

With optimized performance, eViews can handle large datasets and complex models without significant lag.

4. Community Support:

Benefit from a vast community of users, online forums, and comprehensive documentation.

Applications of eViews

eViews is widely used across various fields, including:

1. Academic Research:

  • Conduct econometric studies and publish findings in peer-reviewed journals.
  • Teach students about advanced statistical techniques.

2. Economic Forecasting:

  • Predict economic indicators like GDP growth, inflation rates, and unemployment trends.
  • Assist policymakers in making informed decisions.

3. Financial Analysis:

  • Analyze stock market trends and portfolio performance.
  • Model risk factors and valuation metrics.

4. Business Analytics:

  • Evaluate sales trends, consumer behavior, and market demand.
  • Optimize supply chain and pricing strategies.

Comprehensive Guide to eViews

Getting Started with eViews

Step 1: Installation

  • Purchase and download eViews from the official website (eViews).
  • Follow the installation instructions for your operating system (Windows or Mac).

Step 2: Importing Data

  1. Launch eViews and create a new workfile.
  2. Import data from Excel, CSV, or other supported formats.
  3. Verify and clean the dataset using eViews’ data management tools.

Step 3: Conducting Analysis

  1. Use the “Quick” menu to access basic statistical tests and visualizations.
  2. Navigate to the “View” and “Estimate” tabs for advanced modeling options.
  3. Generate graphs, charts, and tables to illustrate your findings.

Step 4: Interpreting Results

  • Interpret coefficients, R-squared values, and p-values to draw conclusions.
  • Compare models using goodness-of-fit metrics and residual diagnostics.

Advanced Features of eViews

1. Panel Data Analysis:

  • Handle cross-sectional and time-series data simultaneously.
  • Estimate fixed effects, random effects, and dynamic panel models.

2. Structural Equation Modeling (SEM):

  • Model relationships between observed and latent variables.
  • Test hypotheses using path diagrams and covariance structures.

3. Monte Carlo Simulations:

  • Conduct simulations to assess the robustness of models under different scenarios.

4. Programming Capabilities:

  • Automate repetitive tasks using eViews’ built-in programming language.
  • Customize scripts to tailor analyses to specific requirements.

Benefits of Using eViews

1. Enhanced Productivity:

  • Save time with efficient data handling and analysis workflows.

2. Improved Accuracy:

  • Minimize errors with precise calculations and robust validation tools.

3. Comprehensive Insights:

  • Gain deeper insights into data through advanced visualizations and diagnostics.

4. Scalability:

  • Adapt eViews to projects of varying complexity, from simple regressions to intricate econometric models.

Limitations of eViews

While eViews offers numerous advantages, it also has some limitations:

  1. Cost:

    • The software is relatively expensive, which may be a barrier for small organizations and individual users.
  2. Learning Curve:

    • Beginners may require time to master its advanced features.
  3. Limited Machine Learning Tools:

    • For AI-driven analysis, integration with Python or R may be necessary.

Tips for Maximizing eViews’ Potential

  1. Understand Your Objectives:

    • Define clear research goals to streamline your analysis process.
  2. Leverage Tutorials and Documentation:

    • Explore online resources and user manuals to enhance your skills.
  3. Validate Data:

    • Ensure data integrity by conducting thorough checks and cleaning.
  4. Engage with the Community:

    • Participate in forums and workshops to exchange knowledge and best practices.
  5. Stay Updated:

    • Regularly update the software to access new features and improvements.

Comprehensive Guide to eViews

Frequently Asked Questions about eViews

1. Is eViews Suitable for Beginners?

Yes, eViews’ user-friendly interface makes it accessible to beginners, though advanced features may require additional learning.

2. Can eViews Handle Big Data?

While eViews can manage moderately large datasets, extremely big data projects may require specialized tools like Hadoop or Spark.

3. Does eViews Offer Cloud Integration?

No, eViews is primarily desktop-based, but data can be shared and stored in cloud services manually.

4. What File Formats Does eViews Support?

EViews supports a variety of formats, including Excel, CSV, and databases like SQL.

Conclusion

eViews is a powerful and versatile tool that bridges the gap between complex econometric analysis and user-friendly software design. From academic research to financial modeling, it empowers users to extract meaningful insights from data and make informed decisions. By mastering eViews’ features and leveraging its advanced capabilities, you can enhance your analytical skills and contribute to impactful research and policy-making.

For more assistance with eViews or other statistical software, visit getspsshelp.com. Our team of experts is dedicated to helping you achieve your research goals efficiently and effectively.

Needs help with similar assignment?

We are available 24x7 to deliver the best services and assignment ready within 3-4 hours? Order a custom-written, plagiarism-free paper

Get Answer Over WhatsApp Order Paper Now

ERP Software: A Comprehensive Guide|2025

Enterprise Resource Planning (ERP) software has become an indispensable tool for businesses seeking to streamline operations, enhance productivity, and achieve sustainable growth. This article explores the intricacies of ERP software, its benefits, top features, implementation challenges, and tips for selecting the right ERP system for your organization.

What is ERP Software?

ERP software integrates core business processes into a unified system, enabling seamless data sharing and decision-making across departments. By consolidating functions like finance, human resources, supply chain, and customer relationship management, ERP systems provide real-time insights and eliminate data silos.

ERP Software

Key Features of ERP Software

  1. Centralized Data Management:

    • Facilitates a single source of truth for all business data.
    • Reduces redundancies and ensures data accuracy.
  2. Process Automation:

    • Automates routine tasks such as invoicing, payroll processing, and inventory tracking.
    • Enhances operational efficiency and reduces human error.
  3. Customizable Modules:

    • Offers flexibility to add or remove modules based on organizational needs.
    • Popular modules include finance, manufacturing, and human capital management.
  4. Real-Time Analytics:

    • Provides actionable insights through dashboards and reports.
    • Supports data-driven decision-making.
  5. Scalability:

    • Adapts to the growing needs of businesses, whether startups or multinational corporations.
  6. Integration Capabilities:

    • Seamlessly integrates with existing software such as CRM and e-commerce platforms.
    • Facilitates smooth data flow between systems.

Benefits of Implementing ERP Software

1. Enhanced Operational Efficiency:

ERP systems streamline workflows, minimize manual intervention, and optimize resource allocation, leading to increased productivity.

2. Improved Decision-Making:

Real-time data access enables managers to make informed decisions quickly, improving responsiveness to market changes.

3. Cost Savings:

By automating processes and reducing inefficiencies, ERP software helps businesses save on operational costs.

4. Regulatory Compliance:

Many ERP systems include tools to ensure adherence to industry standards and government regulations.

5. Customer Satisfaction:

With better inventory management and order processing, businesses can deliver faster and more accurate services to customers.

ERP Software

Popular ERP Software Solutions

  1. SAP ERP:

    • Known for its comprehensive functionality and scalability.
    • Ideal for large enterprises.
  2. Oracle NetSuite:

    • A cloud-based ERP solution offering robust financial management features.
    • Suitable for small and medium-sized businesses.
  3. Microsoft Dynamics 365:

    • Combines ERP and CRM capabilities.
    • Integrates seamlessly with other Microsoft products.
  4. Odoo:

    • An open-source ERP solution that is highly customizable.
    • Popular among small businesses.
  5. Infor CloudSuite:

    • Focuses on industry-specific solutions.
    • Offers advanced analytics and artificial intelligence capabilities.

Challenges of ERP Implementation

  1. High Initial Costs:

    • Implementing an ERP system can be expensive, particularly for small businesses.
  2. Complexity:

    • ERP implementation requires careful planning and significant time investment.
  3. Resistance to Change:

    • Employees may resist adopting new systems due to fear of the unknown or additional workload.
  4. Data Migration Issues:

    • Transferring data from legacy systems to the new ERP system can be challenging.
  5. Customization Constraints:

    • Over-customizing the software can lead to increased costs and delayed implementation.

Steps to Successful ERP Implementation

1. Define Clear Objectives:

  • Outline your business goals and expectations from the ERP system.

2. Select the Right Vendor:

  • Research vendors based on your industry, company size, and specific requirements.

3. Involve Stakeholders:

  • Engage employees, department heads, and IT teams to ensure smooth adoption.

4. Plan for Training:

  • Provide comprehensive training to employees to familiarize them with the system.

5. Test the System:

  • Conduct rigorous testing to identify and address potential issues before full deployment.

6. Monitor and Evaluate:

  • Continuously monitor the system’s performance and gather feedback for improvement.

Future Trends in ERP Software

  1. Cloud-Based ERP:

    • Cloud ERP solutions are gaining popularity due to their scalability, lower costs, and remote access capabilities.
  2. Artificial Intelligence and Machine Learning:

    • AI-driven ERP systems can predict trends, automate decision-making, and enhance user experiences.
  3. Mobile ERP:

    • Mobile access to ERP systems allows employees to work efficiently from anywhere.
  4. IoT Integration:

    • IoT-enabled ERP systems provide real-time data from connected devices, improving supply chain management.
  5. Enhanced Cybersecurity:

    • As data breaches become more common, ERP vendors are focusing on advanced security measures.

ERP Software

Choosing the Right ERP Software

Factors to Consider:

  • Business Needs: Assess the specific requirements of your organization.
  • Budget: Consider both initial and ongoing costs.
  • Ease of Use: Opt for software with an intuitive interface to minimize training time.
  • Scalability: Ensure the system can grow with your business.
  • Vendor Support: Choose a vendor with a reliable support system and regular updates.

Questions to Ask Vendors:

  • What customization options are available?
  • How does the software handle data security and compliance?
  • Can the ERP system integrate with our existing software?
  • What training and support services do you offer?

Conclusion

Enterprise Resource Planning (ERP) software is a transformative tool that empowers businesses to streamline operations, improve decision-making, and achieve sustainable growth. With numerous options available, selecting the right ERP system requires careful consideration of your organization’s needs, budget, and long-term goals. By addressing implementation challenges and staying updated on emerging trends, businesses can unlock the full potential of ERP software and maintain a competitive edge in today’s dynamic market.

For expert guidance on selecting and implementing ERP software, visit getspsshelp.com. Our team is here to help you navigate the complexities of ERP systems and achieve your organizational objectives.


Needs help with similar assignment?

We are available 24x7 to deliver the best services and assignment ready within 3-4 hours? Order a custom-written, plagiarism-free paper

Get Answer Over WhatsApp Order Paper Now