Comprehensive Guide to Epi Info: A Powerful Tool for Epidemiological Analysis|2025
Comprehensive Guide to Epi Info: A Powerful Tool for Epidemiological Analysis
Epi Info is an open-source software developed by the Centers for Disease Control and Prevention (CDC) that provides powerful tools for epidemiologists, public health professionals, and researchers. It enables users to collect, manage, analyze, and visualize data, making it indispensable in disease surveillance, outbreak investigations, and public health research. This comprehensive guide dives deep into Epi Info, its features, applications, and how to make the most of this versatile software.
What is Epi Info?
Epi Info is a suite of software tools designed for public health practitioners and researchers to support epidemiological and statistical analysis. First released in 1985, Epi Info has evolved into a user-friendly platform that integrates data collection, analysis, and visualization capabilities.
Key Features of Epi Info
- Data Collection and Entry:
- Design custom data collection forms with intuitive drag-and-drop functionality.
- Integrate skip logic, validation rules, and automatic calculations to improve data quality.
- Data Analysis:
- Perform descriptive statistics, regression analysis, and other epidemiological calculations.
- Generate frequency tables, cross-tabulations, and measures of association like relative risk and odds ratios.
- Mapping and Visualization:
- Create geographic maps to visualize the distribution of health events.
- Use bar charts, pie charts, and scatterplots for data visualization.
- Survey Design and Implementation:
- Develop and implement surveys for field data collection.
- Export data to compatible formats for integration with other statistical software.
- Mobile and Cloud Integration:
- Use Epi Info mobile apps to collect data in the field.
- Sync data seamlessly with desktop versions.
Why Choose Epi Info for Public Health Research?
- Free and Open-Source:
- Epi Info is completely free, making it accessible to public health professionals worldwide.
- Customizable:
- Tailor data entry forms, analysis tools, and visualizations to meet specific project needs.
- User-Friendly Interface:
- The software’s simple interface ensures that users with minimal technical expertise can effectively use it.
- Comprehensive Toolset:
- Epi Info offers all the necessary tools for public health analysis, from data collection to visualization.
Getting Started with Epi Info
Step 1: Installation
- Download Epi Info from the official CDC website (Epi Info Download).
- Follow the installation instructions for your operating system (Windows, Android, or iOS).
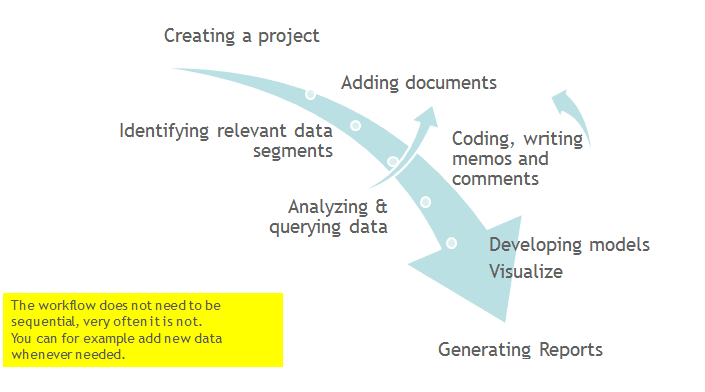
Step 2: Creating a New Project
- Launch Epi Info and click Create a New Project.
- Name your project and specify the directory for storing data.
- Design your data entry form using the Form Designer module.
Step 3: Designing Data Collection Forms
- Add fields like text boxes, drop-down menus, and checkboxes.
- Configure validation rules to ensure accurate data entry.
- Use skip logic to streamline the survey process.
Conducting Data Analysis with Epi Info
Step 1: Importing Data
- Import data from Excel, CSV, or other compatible formats.
- Use the Enter Data module to input or edit data manually.
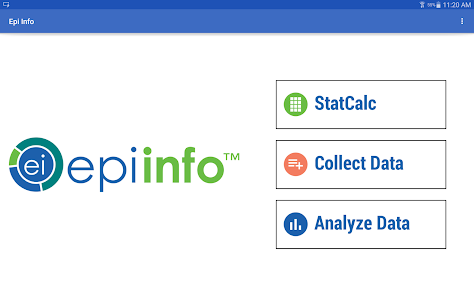
Step 2: Performing Statistical Analysis
- Access the Analyze Data module to explore your dataset.
- Calculate frequencies, means, medians, and standard deviations.
- Use the built-in statistical tools for advanced analyses like logistic regression and survival analysis.
Step 3: Visualizing Data
- Generate graphs and charts to illustrate your findings.
- Utilize the mapping module to analyze geographic data and identify clusters of health events.

Applications of Epi Info
- Disease Surveillance:
- Track and monitor disease outbreaks in real time.
- Use mapping tools to identify hotspots and allocate resources effectively.
- Outbreak Investigations:
- Analyze case-control and cohort study data to determine risk factors.
- Calculate attack rates, relative risk, and odds ratios.
- Program Evaluation:
- Assess the impact of public health interventions and programs.
- Use surveys and statistical tools to measure program outcomes.
- Field Data Collection:
- Deploy mobile apps for data collection in remote or resource-limited settings.
- Sync data directly to the desktop version for analysis.
- Training and Education:
- Use Epi Info in academic settings to teach epidemiology and biostatistics.
- Provide hands-on experience in data management and analysis.
Advanced Features of Epi Info
1. Epi Info Cloud Data Capture:
- Collect data using cloud-based solutions for real-time access and collaboration.
2. Mobile Apps:
- Use Epi Info mobile apps to collect data on smartphones or tablets.
3. Scripting and Automation:
- Automate repetitive tasks using the scripting module.
4. Integration with Other Software:
- Export data to SPSS, SAS, or R for advanced statistical analysis.
Benefits of Using Epi Info
- Accessibility:
- The free nature of the software makes it ideal for resource-limited settings.
- Efficiency:
- Streamline data collection, entry, and analysis within a single platform.
- Flexibility:
- Adaptable to various public health applications and research needs.
- Collaboration:
- Share projects with team members and facilitate collaborative analysis.
Tips for Maximizing Epi Info’s Potential
- Understand Your Research Objectives:
- Clearly define your goals and tailor Epi Info’s features to meet them.
- Leverage Built-In Tutorials:
- Use the software’s tutorials and user guides to enhance your skills.
- Validate Your Data:
- Use validation rules and skip logic to ensure data quality.
- Regular Backups:
- Save your work frequently to prevent data loss.
- Engage with the Community:
- Join forums and online communities to exchange tips and best practices.
Limitations of Epi Info
While Epi Info is a robust tool, it has limitations:
- Limited Advanced Statistical Features:
- For complex analyses, integration with software like R or SPSS may be necessary.
- Windows-Centric:
- Full functionality is available only on Windows; Mac users may need workarounds.
- Learning Curve:
- New users may require time to familiarize themselves with the software.
Frequently Asked Questions about Epi Info
1. Is Epi Info Free?
Yes, Epi Info is completely free and open-source.
2. Can Epi Info Be Used Offline?
Yes, Epi Info desktop and mobile versions can be used without an internet connection.
3. What File Formats Does Epi Info Support?
Epi Info supports CSV, Excel, and other common formats for data import and export.
4. Is Epi Info Suitable for Beginners?
Yes, Epi Info’s user-friendly interface makes it accessible to beginners while offering advanced features for experienced users.
Conclusion
Epi Info is a versatile and accessible tool that empowers public health professionals and researchers to collect, analyze, and interpret data effectively. Whether you are conducting disease surveillance, evaluating public health programs, or teaching epidemiology, Epi Info provides the tools you need to succeed. By mastering its features and functionalities, you can streamline your research process and make meaningful contributions to public health.
For more guidance on using Epi Info or other statistical tools, visit getspsshelp.com. Our experts are here to assist you in achieving your research objectives.
Needs help with similar assignment?
We are available 24x7 to deliver the best services and assignment ready within 3-4 hours? Order a custom-written, plagiarism-free paper