How to Import and Export Data in Stata|2025

How to Import and Export Data in Stata provides a detailed guide to transferring data seamlessly. Learn the steps to import datasets from various formats and export your results for analysis and reporting.

Stata is a powerful statistical software widely used in various fields for data analysis, manipulation, and visualization. One of the essential skills in working with Stata is understanding how to import and export data. The process of data importation and exportation enables users to seamlessly work with data stored in different formats, including Excel, CSV files, and other delimited text formats. This paper provides an in-depth overview of how to import and export data in Stata, focusing on common data formats such as Excel and CSV. Additionally, it will cover essential techniques for customizing the import and export process to fit specific user requirements.

How to Import and Export Data in Stata

Importing Data into Stata
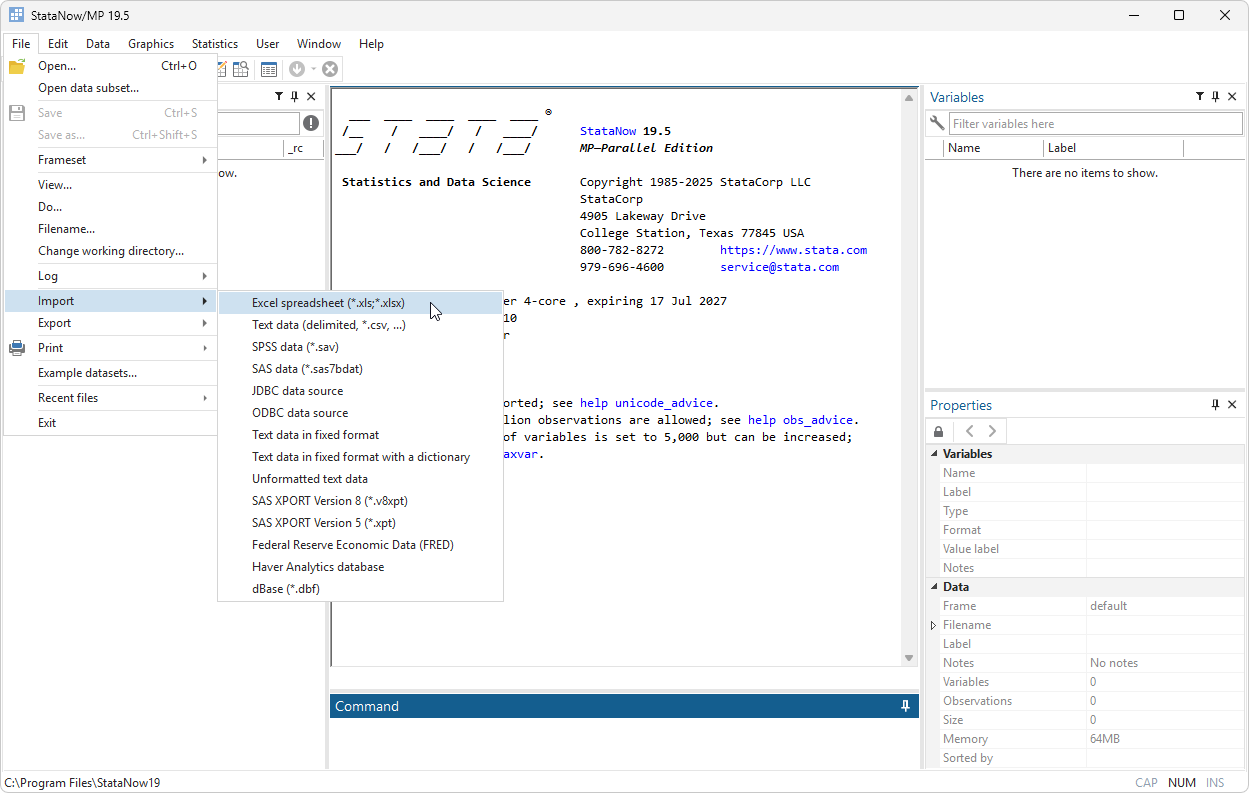
Stata Import Excel

Stata provides a straightforward command to import data from Excel files. The import excel command is used to read Excel files (both .xls and .xlsx) into Stata. By using this command, users can quickly load data from Excel sheets without the need for manual data entry.

The basic syntax for importing Excel files into Stata is as follows:

stata
import excel using "filename.xlsx", sheet("Sheet1")

This command tells Stata to import data from an Excel file named filename.xlsx located in the current working directory and to import data from the sheet named Sheet1. If you do not specify a sheet name, Stata will default to importing the first sheet in the Excel file.

In addition to the sheet option, the import excel command also supports other useful options, such as:

  • firstrow: This option tells Stata to treat the first row in the Excel sheet as variable names.

Example:

stata
import excel using "data.xlsx", sheet("Sheet1") firstrow

This command ensures that the variable names in Stata are taken from the first row of the Excel sheet.

  • clear: The clear option clears the current dataset in memory before importing the new data.

Example:

stata
import excel using "data.xlsx", sheet("Sheet1") firstrow clear

1.2 Stata Import CSV

CSV (Comma Separated Values) is a popular format for storing tabular data. Stata offers the import delimited command to import data from CSV files. The import delimited command reads CSV files and other delimited text files, converting them into Stata datasets.

The basic syntax for importing CSV files is:

stata
import delimited "filename.csv", clear

This command tells Stata to import data from the file filename.csv and load it into memory. By default, Stata treats commas as delimiters, but this command also supports other delimiters, such as tabs or semicolons. For example, to specify a semicolon as the delimiter, you would use the delimiter() option:

stata
import delimited "filename.csv", delimiter(";") clear

Another important option for importing CSV files is varnames, which specifies how variable names should be treated. By default, Stata assumes that the first row contains variable names. However, if your CSV file does not contain variable names in the first row, you can use the varnames(0) option to tell Stata to generate default variable names.

Example:

stata
import delimited "filename.csv", delimiter(",") varnames(0) clear

How to Import and Export Data in Stata

Exporting Data from Stata

Once data has been processed and analyzed in Stata, it is often necessary to export the results to a different format for further analysis or reporting. Stata provides a range of commands for exporting data to formats such as Excel and CSV.

How to Export Data from Stata to Excel

One of the most common formats for exporting data from Stata is Excel. Stata provides the export excel command, which allows users to save their Stata datasets as Excel files. The basic syntax for exporting data to Excel is:

stata
export excel using "filename.xlsx", firstrow(varlabels)

This command exports the current Stata dataset to an Excel file named filename.xlsx and includes the variable labels in the first row of the Excel sheet.

In addition to the firstrow(varlabels) option, there are other useful options available when exporting to Excel:

  • sheet("SheetName"): This option allows users to specify the sheet name in the Excel file.

Example:

stata
export excel using "filename.xlsx", sheet("Data") firstrow(varlabels)
  • replace: This option overwrites an existing Excel file if one already exists with the same name.

Example:

stata
export excel using "filename.xlsx", sheet("Data") replace
  • sheetmodify: The sheetmodify option allows users to modify an existing Excel sheet. This option is useful when you want to update data in an existing sheet without overwriting the entire file.

Example:

stata
export excel using "filename.xlsx", sheet("Data") sheetmodify firstrow(varlabels)

Stata Export Data to Excel with Variable Names

By default, when exporting to Excel using export excel, the variable names are included as column headers. However, if you prefer to include the variable names as the first row of data (instead of using variable labels), you can specify the firstrow(variable) option.

Example:

stata
export excel using "filename.xlsx", firstrow(variable)

This command will export the Stata dataset to Excel, placing the variable names in the first row instead of the variable labels.

Export Excel Firstrow Stata

The firstrow option in the export excel command is crucial when dealing with Excel exports. You can control whether variable names or labels appear in the first row of the exported file. The firstrow(varlabels) option includes variable labels as column headers, while the firstrow(variable) option includes variable names.

Example with variable names:

stata
export excel using "filename.xlsx", firstrow(variable)

Example with variable labels:

stata
export excel using "filename.xlsx", firstrow(varlabels)

Stata Export Excel Sheet Modify

The sheetmodify option is useful when you want to append data to an existing sheet or update the data in a specific sheet. This option modifies the data in an existing Excel sheet rather than creating a new one.

Example:

stata
export excel using "filename.xlsx", sheet("Data") sheetmodify

This command will add the current Stata dataset to the Data sheet in the existing Excel file filename.xlsx.

Stata Export CSV

Exporting data to CSV is another common task. The export delimited command in Stata is used to export datasets to CSV files. The basic syntax for exporting a Stata dataset to a CSV file is:

stata
export delimited using "filename.csv", replace

This command exports the Stata dataset to a CSV file named filename.csv, replacing any existing file with the same name.

If you want to customize the delimiters used in the CSV file, you can use the delimiter() option. For example, to use a tab character as the delimiter:

stata
export delimited using "filename.csv", delimiter(tab) replace

Additionally, you can control whether variable names are included in the first row of the CSV file by using the varnames() option:

stata
export delimited using "filename.csv", varnames(1) replace

This command ensures that the variable names appear in the first row of the CSV file.

How to Import and Export Data in Stata

Conclusion

Importing and exporting data in Stata is a fundamental skill for working with external data files. By mastering commands such as import excel, import delimited, export excel, and export delimited, users can efficiently handle data stored in Excel, CSV, and other formats. Customizing the import and export process through various options, such as firstrow, clear, and replace, allows users to tailor their workflows to specific needs. Whether working with raw data or sharing results with others, Stata’s data import and export functionality ensures seamless integration with other software and facilitates effective data analysis and reporting.

By understanding how to manipulate these commands and options, users can improve their productivity and ensure that their data is consistently formatted and ready for analysis.

Needs help with similar assignment?

We are available 24x7 to deliver the best services and assignment ready within 3-4 hours? Order a custom-written, plagiarism-free paper

Get Answer Over WhatsApp Order Paper Now

Stata vs R: Which Software is Better for Statistics

Stata vs R: Which Software is Better for Statistics compares the strengths and features of both tools. Explore key differences, advantages, and use cases to determine which is best suited for your statistical analysis needs.

In the realm of statistical analysis, two software packages—Stata and R—are frequently compared, especially in the fields of econometrics and economics. The debate between the two revolves around the question: which software is better suited for statistical analysis and why? This question doesn’t have a simple yes or no answer, as both Stata and R come with their strengths and weaknesses. Their suitability often depends on the context, the user’s expertise, and the specific requirements of the task at hand. This paper will explore the key differences between Stata and R, analyzing their performance in statistics, econometrics, and economics. We will also consider the role of Python as an alternative for statistical analysis, drawing comparisons between it, Stata, and R.

Stata vs R

Overview of Stata and R

Stata is a commercial software package used primarily for data analysis, statistics, and econometrics. Developed by StataCorp, Stata has been designed with a focus on providing a user-friendly interface and a robust set of statistical tools. It is widely used in academic, government, and private research settings, particularly in economics, sociology, political science, and public health. Stata is a point-and-click software but also includes a powerful scripting language for more advanced users.

R, on the other hand, is an open-source programming language and environment for statistical computing and graphics. It is widely used by statisticians, data scientists, and researchers. R is highly extensible, with a vast array of packages developed by the community, making it particularly powerful for specialized statistical analyses. Unlike Stata, R is entirely code-based, although there are graphical user interfaces (GUIs) available for those who prefer a more visual approach.

Stata vs R for Statistical Analysis

When it comes to statistics, both Stata and R offer a comprehensive set of tools. However, the two software packages differ significantly in terms of flexibility, ease of use, and extensibility.

Ease of Use

Stata is known for its user-friendly interface. Its point-and-click functionality allows users to easily navigate through datasets, perform analyses, and generate results. Stata’s menus and dialog boxes guide users through complex procedures, making it particularly attractive for beginners or those who do not have programming experience. The syntax of Stata is straightforward, and the software provides well-documented commands that are easy to learn.

In contrast, R is more challenging to learn, particularly for those without prior programming experience. R relies heavily on the use of commands and scripts, which can be intimidating to new users. While R is powerful, its command-based interface demands a deeper understanding of programming concepts. However, for those who are familiar with coding, R provides a higher degree of flexibility. The sheer amount of packages and functions available in R makes it a powerful tool for statistical analysis, particularly for more advanced techniques.

Statistical Functionality

Stata offers a wide range of built-in statistical functions, including linear regression, time-series analysis, panel data methods, survival analysis, and more. Stata’s focus on econometrics has made it a popular choice among economists. Many econometric models are implemented as built-in commands in Stata, allowing users to quickly and efficiently run analyses without needing to program from scratch.

R, on the other hand, has a more expansive and flexible set of statistical tools. The power of R lies in its vast number of packages, which extend its capabilities well beyond what is available in Stata. R is particularly strong in areas such as machine learning, high-dimensional data analysis, and specialized statistical techniques. For example, the R package “lmtest” provides a suite of diagnostic tests for linear models, while “lme4” enables the fitting of mixed-effects models. R is continually updated with new packages and tools, often developed by leading statisticians and researchers in the field.

Graphics and Data Visualization

When it comes to creating high-quality graphics and visualizations, R is the undisputed leader. The “ggplot2” package in R has set a new standard for data visualization, allowing users to create intricate and aesthetically pleasing plots with minimal effort. R’s ability to generate customizable plots and interactive graphics is a key reason why it is preferred by many data scientists and statisticians.

Stata also provides a range of graphical tools, but it is often seen as less flexible and customizable than R. While Stata can produce publication-quality plots, the customization options are not as extensive as in R. This can be limiting for users who need to produce complex visualizations for their analyses.

Stata vs R

Stata vs R for Econometrics

Econometrics is a branch of economics that applies statistical methods to economic data, and it is one area where the debate between Stata vs R becomes particularly relevant. Both Stata and R have strengths in this field, but their suitability depends on the user’s needs.

Stata for Econometrics

Stata has long been the preferred tool for econometricians. It is known for its user-friendly interface and powerful set of econometric tools, including methods for cross-sectional data, panel data, time-series analysis, and causal inference. Stata’s built-in commands, such as “regress,” “xtreg,” and “tsset,” make it easy to estimate various econometric models without requiring advanced programming skills.

For users who focus on applied econometrics and need to conduct routine analyses, Stata’s intuitive syntax and vast library of built-in commands can be a significant advantage. The software also includes extensive documentation, making it easy for users to find information on how to perform specific econometric analyses.

R for Econometrics

While Stata remains dominant in applied econometrics, R has gained popularity in recent years, particularly among econometricians who require more flexibility and advanced statistical techniques. R has several packages dedicated to econometrics, such as “plm” for panel data analysis, “AER” for applied econometrics, and “sandwich” for robust standard errors. Additionally, R provides greater flexibility for customizing econometric models and conducting complex simulations.

Econometricians who need to work with cutting-edge methodologies or advanced modeling techniques may prefer R. The breadth of R’s package ecosystem allows users to implement complex models that may not be readily available in Stata.

R or Stata for Economics

The decision between Stata and R for economics largely depends on the nature of the analysis being conducted and the user’s level of expertise.

Stata for Economics

For many applied economists, Stata remains the software of choice. Its built-in commands for econometric models, combined with its user-friendly interface, make it an excellent tool for everyday economic analysis. Researchers can quickly conduct regressions, produce descriptive statistics, and perform time-series analysis, all with minimal effort. Stata also has a strong presence in the academic community, with many economics textbooks and courses using Stata to teach econometrics.

R for Economics

For theoretical economists or those working on more advanced modeling techniques, R offers several advantages. R’s extensive ecosystem of packages allows economists to explore new methodologies and models that may not be available in Stata. R is also ideal for economists who are interested in interdisciplinary research, as it can easily handle data from various fields and integrate with other data analysis tools.

R is also more adaptable to custom workflows and is increasingly popular among economists working with large datasets or non-traditional data types, such as textual or network data. The flexibility and extensibility of R allow researchers to tailor their analyses to their specific needs, which can be particularly useful in more complex economic modeling tasks.

Stata vs R

Stata vs R: Which Software is Better for Statistics?

There is no definitive answer to the question of whether Stata or R is better for statistics, as it largely depends on the user’s goals and expertise. However, some general trends can be observed.

  • Stata is likely the better choice for users who prioritize ease of use, efficiency in performing common statistical analyses, and a user-friendly interface. It is particularly well-suited for applied research in economics, sociology, and other social sciences. Econometricians who need to conduct standard analyses quickly and effectively may find Stata to be the ideal tool.
  • R excels in flexibility and extensibility. It is best suited for statisticians and data scientists who need access to cutting-edge statistical techniques, advanced modeling, and high-quality visualizations. While R’s learning curve is steeper, its capabilities are vast, and it is well-suited for users who require specialized or custom analyses.

Python as an Alternative

Python is another programming language commonly used for data analysis, and it is often compared to R and Stata. Python has seen a significant rise in popularity, particularly due to its ease of use and extensive ecosystem of libraries such as NumPy, Pandas, SciPy, and StatsModels.

While Python is a powerful tool for data analysis and can handle many statistical tasks, it is not as specialized as R in terms of statistical modeling. R remains the preferred choice for users focused on statistics due to its wide range of statistical packages. However, Python’s growing data science community and ability to integrate seamlessly with other tools make it a versatile option for many types of analysis.

Stata vs R

Conclusion

In the debate of Stata vs R, there is no one-size-fits-all answer. Stata offers a user-friendly interface and a robust set of built-in tools, making it a strong choice for applied econometrics and other fields requiring efficient data analysis. On the other hand, R’s flexibility, extensibility, and vast array of packages make it a superior choice for statisticians and researchers who need advanced modeling techniques or wish to customize their analyses. Ultimately, the best software depends on the user’s specific needs, expertise, and the complexity of the analysis at hand.

Needs help with similar assignment?

We are available 24x7 to deliver the best services and assignment ready within 3-4 hours? Order a custom-written, plagiarism-free paper

Get Answer Over WhatsApp Order Paper Now

How to Perform Logistic Regression in Stata|2025

How to Perform Logistic Regression in Stata provides a comprehensive guide to conducting logistic regression analysis. Learn the steps, commands, and interpretation techniques to analyze binary outcomes with Stata.

Logistic regression is a statistical method used for analyzing datasets where the dependent variable is categorical, typically binary. In Stata, a popular statistical software, logistic regression can be easily performed using various commands. This paper will guide you through performing logistic regression in Stata, explaining key concepts and commands, with a special focus on interpreting the results. Additionally, we will address the difference between “logit” and “logistic” models, the treatment of categorical variables, and provide examples from a real dataset.

Logistic Regression in Stata

Introduction to Logistic Regression

Logistic regression is used when the dependent variable is binary or dichotomous, meaning it has only two possible outcomes. For example, it could represent the likelihood of an event happening (1) or not happening (0). Logistic regression is applied in a variety of fields, such as medicine, economics, and social sciences, to model the probability of an event occurring based on one or more predictor variables.

The logistic regression model estimates the probability P(Y=1∣X)P(Y=1|X), where YY is the dependent variable, and XX represents the predictor variables (independent variables). The model assumes the log-odds of the dependent variable being equal to 1 are linearly related to the independent variables.

The logistic regression equation in its basic form is:

log⁡(P(Y=1∣X)1−P(Y=1∣X))=β0+β1X1+β2X2+⋯+βkXk\log \left( \frac{P(Y=1|X)}{1-P(Y=1|X)} \right) = \beta_0 + \beta_1 X_1 + \beta_2 X_2 + \dots + \beta_k X_kWhere:

  • P(Y=1∣X)P(Y=1|X) is the probability of the event occurring.
  • β0\beta_0 is the intercept.
  • β1,…,βk\beta_1, \dots, \beta_k are the coefficients for the predictor variables.
  • X1,X2,…,XkX_1, X_2, \dots, X_k are the predictor variables.

Stata provides an efficient way to conduct logistic regression with a range of functionalities, including the ability to handle categorical variables, calculate odds ratios, and assess model fit.

Preparing the Data for Logistic Regression

Before running any logistic regression model, it is crucial to prepare the dataset. In Stata, you can load a dataset using the use command or import a file using the import command. For the purposes of this example, let’s assume we are working with a dataset where the dependent variable is binary (e.g., whether a person has a disease: 1 for yes, 0 for no), and the independent variables include age, gender, and income.

For demonstration, consider the following variables:

  • disease: Binary dependent variable (1 if the person has the disease, 0 otherwise).
  • age: Age of the person.
  • gender: Categorical variable (1 for male, 0 for female).
  • income: Income of the person.
stata
use dataset.dta, clear

Logistic Regression in Stata

Running Logistic Regression in Stata

The basic command to perform logistic regression in Stata is logit. The general syntax for logistic regression is:

stata
logit dependent_variable independent_variables

For example, to analyze the relationship between disease and the independent variables age, gender, and income, you would run the following command:

stata
logit disease age gender income

This will run a binary logistic regression where the log-odds of the outcome (disease) are modeled as a linear combination of the predictors (age, gender, and income).

Interpreting the Logistic Regression Output

After running the logistic regression command, Stata will display output with several statistics. Here’s a breakdown of the key components of the output:

  • Coefficients (_b): These represent the change in the log-odds of the dependent variable for a one-unit change in the predictor variable.
  • Standard Errors (Std. Err.): These indicate the standard error for each coefficient, which measures the precision of the estimate.
  • z-Statistic: This is the ratio of the coefficient to its standard error, used to test the null hypothesis that the coefficient is zero.
  • P-value: This indicates the statistical significance of each predictor variable. A p-value less than 0.05 typically suggests that the predictor is statistically significant.
  • Odds Ratio (OR): By default, Stata reports coefficients, but you can also calculate the odds ratios. The odds ratio represents the change in the odds of the outcome per unit change in the predictor. It is derived by taking the exponential of the coefficient.

You can calculate the odds ratio using the or option:

stata
logit disease age gender income, or

The odds ratio for each variable will be displayed. For instance, an odds ratio greater than 1 suggests that as the predictor increases, the odds of the outcome occurring increase, while an odds ratio less than 1 indicates the opposite.

Logistic Regression in Stata

Logistic Regression with Categorical Variables

Categorical variables can be included in logistic regression models in Stata using dummy coding (i.e., converting categorical variables into binary indicator variables). For example, if gender is a categorical variable with two categories (male and female), you can include it in the model as a dummy variable. Stata automatically handles this process when you specify a categorical variable using i. notation.

For example:

stata
logit disease age i.gender income

Here, i.gender tells Stata to treat gender as a categorical variable and create the necessary dummy variables. The coefficient for i.gender will indicate the effect of being male (compared to the baseline category, female) on the log-odds of having the disease.

Multivariable Logistic Regression in Stata

In many research scenarios, you may want to control for multiple variables simultaneously to avoid confounding. This is known as multivariable logistic regression, and it can be done easily in Stata by including multiple independent variables in the model.

For example:

stata
logit disease age i.gender income

This will estimate the effect of age, gender, and income on the likelihood of having the disease, controlling for the other variables. In multivariable logistic regression, the interpretation of the coefficients changes, as each coefficient represents the effect of the corresponding variable while holding the others constant.

Logistic Regression in Stata

Logit vs Logistic in Stata

The terms “logit” and “logistic” are often used interchangeably but refer to different aspects of logistic regression in Stata:

  • The logit command in Stata estimates the log-odds of the dependent variable being 1 (i.e., the log of the odds ratio). This is the default method in Stata for logistic regression.
  • The logistic command, on the other hand, directly estimates the odds ratios rather than the log-odds.

For example, to run the same logistic regression model and get the odds ratios instead of the log-odds, you can use the logistic command:

stata
logistic disease age i.gender income

This will produce odds ratios instead of coefficients in the output. The odds ratios are often more intuitive to interpret because they represent the multiplicative change in the odds of the outcome for a one-unit increase in the predictor.

Model Fit and Diagnostics

Once you have run the logistic regression model, it is important to assess how well the model fits the data. In Stata, several methods can be used to assess model fit:

  • Pseudo R-squared: This statistic is displayed in the output and provides an indication of the proportion of variance explained by the model, though it is not directly comparable to the R-squared in linear regression.
  • Likelihood Ratio Test: This tests the goodness of fit by comparing the fitted model to a null model (a model with no predictors).
  • Hosmer-Lemeshow Test: This is a commonly used test for model fit in logistic regression. A significant result suggests that the model does not fit well.

To perform the Hosmer-Lemeshow test in Stata, you can use the following command after running the logistic regression:

stata
estat gof

Logistic Regression in Stata

Conclusion

Logistic regression in Stata is a powerful and flexible tool for analyzing binary outcomes. By understanding the various commands and interpreting the results correctly, researchers can draw meaningful conclusions about the relationships between the independent variables and the outcome. Whether dealing with simple models or more complex multivariable models, Stata offers a comprehensive approach to logistic regression analysis, including handling categorical variables, calculating odds ratios, and assessing model fit.

For further study, you can refer to resources such as the Stata documentation and online tutorials (e.g., UCLA’s Stata resources), which offer in-depth examples and guidance. Understanding how to perform logistic regression in Stata and interpret the results is a crucial skill for many types of quantitative research.

GetSPSSHelp is the best website for “How to Perform Logistic Regression in Stata” because it offers expert guidance through every step of the logistic regression process. The platform provides clear, easy-to-follow instructions on executing the commands, interpreting the results, and applying logistic regression to real-world data. GetSPSSHelp ensures users understand key concepts like odds ratios, model fitting, and diagnostics, making it ideal for both beginners and advanced users. With personalized support and affordable services, it helps students and professionals succeed in their statistical analysis. Additionally, 24/7 customer support ensures timely assistance, making GetSPSSHelp the go-to resource for mastering logistic regression in Stata.

Needs help with similar assignment?

We are available 24x7 to deliver the best services and assignment ready within 3-4 hours? Order a custom-written, plagiarism-free paper

Get Answer Over WhatsApp Order Paper Now

Stata Descriptive Statistics Tutorial|2025

Stata Descriptive Statistics Tutorial provides a step-by-step guide to summarizing and analyzing data. Learn how to calculate means, medians, standard deviations, and more using Stata’s powerful tools.

Stata is a powerful statistical software that allows users to perform various data analysis tasks, including descriptive statistics. Descriptive statistics are essential tools for summarizing and understanding the basic features of a dataset, such as central tendency, dispersion, and distribution. Stata provides several commands and functions to generate descriptive statistics, making it a popular choice among researchers, data analysts, and statisticians.

This tutorial is aimed at helping beginners navigate through the process of generating descriptive statistics using Stata. It will cover various aspects such as basic descriptive statistics commands, generating statistics by groups, handling categorical variables, and exporting the results. Additionally, we will highlight resources like the “Stata Descriptive Statistics Tutorial PDF” for further reading and learning.

Stata Descriptive Statistics Tutorial

Introduction to Descriptive Statistics in Stata

Descriptive statistics in Stata include measures such as the mean, median, standard deviation, variance, minimum, and maximum. These measures provide a snapshot of the data and can be useful for understanding the data’s distribution before performing more complex analyses. Descriptive statistics are often the first step in any data analysis process.

In Stata, there are a variety of commands that allow users to generate these statistics. The most commonly used command is summarize, which provides a summary of the variables in the dataset. Other commands, such as tabulate, table, and describe, also offer descriptive information depending on the user’s needs.

Stata Descriptive Statistics Command

The core command for generating descriptive statistics in Stata is summarize. This command can be used to calculate basic statistics for one or more variables in a dataset. Here’s how to use the summarize command:

stata
summarize varlist
  • varlist: The list of variables for which you want to generate descriptive statistics.

For example, to generate descriptive statistics for the variables age and income, you would use:

stata
summarize age income

This command will return the following statistics for each variable:

  • Mean: The average value of the variable.
  • Standard Deviation: A measure of how spread out the values are.
  • Minimum: The smallest value in the dataset.
  • Maximum: The largest value in the dataset.
  • Number of observations: The total number of non-missing values.

If you want more detailed statistics, including percentiles (such as the median), you can use the detail option:

stata
summarize age income, detail

This will provide additional statistics such as:

  • Percentiles: The values below which certain percentages of observations fall.
  • Variance: A measure of the dispersion of values.
  • Skewness: The asymmetry of the distribution.
  • Kurtosis: The “tailedness” of the distribution.

Stata Descriptive Statistics by Group

In many research scenarios, you might need to calculate descriptive statistics for different subgroups within the dataset. Stata allows you to do this easily using the by prefix. For instance, if you want to calculate the descriptive statistics of income by gender, you would use:

stata
by gender: summarize income

This command will display the descriptive statistics of income separately for each gender in the dataset. The by prefix is useful for generating statistics for subgroups based on a categorical variable.

If you want more detailed statistics for each group, you can again use the detail option:

stata
by gender: summarize income, detail

This will provide the same detailed statistics (mean, standard deviation, percentiles, etc.) but split by the values of the gender variable.

Stata Descriptive Statistics Tutorial

Stata Descriptive Statistics for Categorical Variables

For categorical variables, you can use the tabulate or table commands to get frequency distributions and proportions. For example, if you have a variable education_level with categories such as “High School”, “Bachelor’s”, “Master’s”, and “PhD”, you can generate a frequency table using:

stata
tabulate education_level

This will show the number and percentage of observations in each category. For a two-way frequency table (i.e., a contingency table), you can use the following command:

stata
tabulate education_level gender

This will provide a cross-tabulation of the education_level and gender variables, showing the counts and percentages for each combination of categories.

Stata Descriptive Statistics Table

When you want to present the results in a table format for better readability, you can use the table command. This command allows you to create a customized table of summary statistics. For example, to generate a table of the mean and standard deviation for income and age by gender, you can use:

stata
table gender, c(mean income mean age sd income sd age)

This will create a table where the mean and standard deviation of income and age are displayed separately for each gender.

Stata Descriptive Statistics Tutorial

Stata Descriptive Statistics Tutorial for Beginners

If you are new to Stata and want to learn more about generating descriptive statistics, there are several resources available, including tutorials and PDFs. The “Stata Descriptive Statistics Tutorial PDF” is a valuable resource for beginners, providing step-by-step instructions and examples.

To begin, it is essential to understand the following key concepts:

  • Variables: These are the characteristics or measurements that you are analyzing (e.g., age, income, gender).
  • Commands: Stata uses commands to perform specific tasks, such as summarizing data or generating tables.
  • Options: Many Stata commands have options that allow you to customize the output, such as adding more detailed statistics or grouping data by a variable.

You can access the Stata help documentation directly in the software by typing:

stata
help summarize

This will display the documentation for the summarize command, including a detailed explanation of the command and its options.

Export Descriptive Statistics in Stata

Once you have generated the descriptive statistics you need, you may want to export the results for further analysis or reporting. Stata provides several options for exporting results to external files, such as text files, Excel, or CSV formats.

One simple way to export the output of a summarize command to a text file is by using the outreg2 command, which is available through the ssc install package. Here’s how to install and use outreg2:

  1. Install outreg2:
stata
ssc install outreg2
  1. Run the summarize command and export the results:
stata
summarize age income, detail
outreg2 using descriptives.txt, replace

This will save the detailed statistics of age and income in a text file called descriptives.txt.

Alternatively, you can use the export excel command to export the results to an Excel file:

stata
export excel using descriptives.xlsx, firstrow(variables) replace

This will save the descriptive statistics in an Excel file named descriptives.xlsx.

Stata Descriptive Statistics Tutorial

Stata Descriptive Statistics for Beginners PDF

For those looking for more comprehensive guidance, you can download a Stata descriptive statistics tutorial PDF that offers detailed examples and explanations. A simple online search for “Stata descriptive statistics tutorial PDF” will provide you with several resources to download and study at your own pace.

These PDFs are often formatted for easy reference and include:

  • Step-by-step instructions for using Stata commands
  • Sample datasets to practice with
  • Screenshots and explanations of output
  • Tips and tricks for beginners

The “Stata Descriptive Statistics Tutorial for Beginners” PDF will be especially useful for individuals who are just starting to work with Stata, as it covers all the basics and provides practice exercises.

Stata Descriptive Statistics Tutorial

Conclusion

In this tutorial, we have covered the fundamental aspects of generating descriptive statistics in Stata, including:

  • Basic commands like summarize and tabulate
  • Descriptive statistics by group using the by prefix
  • Handling categorical variables with tabulate and table
  • Exporting descriptive statistics to external files

Descriptive statistics are an essential first step in data analysis, providing a clear overview of the dataset. By mastering these basic commands and techniques, you can begin to understand the structure of your data and prepare it for more advanced statistical analysis. For more detailed guidance, you can refer to the “Stata Descriptive Statistics Tutorial PDF” and explore the various resources available online.

This tutorial provides a solid foundation for beginners, and with practice, you will become proficient in using Stata to generate and interpret descriptive statistics.

Needs help with similar assignment?

We are available 24x7 to deliver the best services and assignment ready within 3-4 hours? Order a custom-written, plagiarism-free paper

Get Answer Over WhatsApp Order Paper Now

How to create graphs and charts in Stata|2025

Learn How to Create Graphs and Charts in Stata with this comprehensive guide. Discover step-by-step instructions for designing clear, professional visualizations to enhance your data analysis.

Creating graphs and charts in Stata is an essential skill for researchers and data analysts alike. The software provides a wide array of tools for visualizing data, from simple bar charts to complex scatter plots and regression graphs. This paper will cover the basic steps of creating various types of graphs and charts in Stata, and how users can customize their visualizations. Topics discussed will include the Stata graph command, creating line graphs, using graphs by group, and more. Additionally, this paper will address practical tips, including resources like the Stata graphs Cheat Sheet and other useful PDFs for reference.

How to create graphs and charts in Stata

Introduction

Data visualization plays an essential role in analyzing and communicating findings. Stata, a popular statistical software package, is known for its powerful graphing capabilities. Whether you’re presenting a simple distribution of data or a more complex relationship between variables, Stata offers a variety of tools to help create effective graphs and charts. These visual representations not only assist in data exploration but also make it easier to communicate complex information to a broader audience.

In this paper, we will discuss how to create graphs and charts in Stata, provide an overview of common graph types, and delve into customization options to help you make the most of your data visualizations.

How to Create Graphs and Charts in Stata

Stata provides users with the ability to create several types of graphs, including bar charts, histograms, pie charts, scatter plots, and line graphs. The basic approach to creating graphs involves the use of Stata’s graphical commands, which allow users to specify the variables they wish to plot and customize the appearance of the graphs.

Basic Graph Creation Using Stata Commands

Stata uses a general command structure to create graphs. The most common command is graph, followed by the type of graph you wish to create. For example, to create a simple histogram of the variable age, the command would be:

graph histogram age

Stata will automatically generate a histogram based on the data in the age variable. This basic graph can be further customized with options such as labels, colors, titles, and axis specifications.

How to create graphs and charts in Stata

Creating Bar Charts in Stata

Bar charts are useful for showing the distribution of categorical variables. You can create a bar chart in Stata using the following command:

graph bar varname

Where varname is the categorical variable you want to plot. For example, to plot a bar chart of a variable education_level, the command would be:

graph bar education_level

You can further customize the bar chart with options like over() to create bar charts that represent categories grouped by another variable. For example:

scss
graph bar varname, over(groupvar)

This would create a grouped bar chart of varname, grouped by the variable groupvar.

Scatter Plots in Stata

Scatter plots are often used to visualize relationships between two continuous variables. The command for creating a scatter plot in Stata is as follows:

scatter var1 var2

Where var1 and var2 are continuous variables. For example, to create a scatter plot of income against education_level, you would type:

scatter income education_level

How to create graphs and charts in Stata

Line Graphs in Stata

Line graphs are useful for displaying trends over time or comparing continuous variables. To create a simple line graph of a variable, you would use the twoway line command:

arduino
twoway line varname timevariable

For example, to plot the variable sales over time, you would use:

arduino
twoway line sales time

Stata Line Graph by Group

Sometimes, you may want to create a line graph with different lines representing different groups. This can be done by specifying the by() option:

scss
twoway line varname timevariable, by(groupvar)

For example, to create line graphs of sales for different regions, you would use:

scss
twoway line sales time, by(region)

This generates a separate line graph for each region, allowing you to compare trends across multiple categories.

Customizing Graphs in Stata

Stata allows a high level of customization for your graphs, making it possible to adjust titles, labels, colors, and axis scaling.

Adding Titles and Labels

To add titles and axis labels to your graphs, use the title(), subtitle(), and xlabel() options. For example, to add a title and axis labels to a scatter plot, you would use:

scss
scatter income education_level, title("Income vs. Education Level") xlabel(0(5000)20000)

Changing Colors and Line Styles

Stata also provides options for modifying colors, line styles, and markers on your graph. You can specify these properties using the color() and lstyle() options. For instance, to make a line graph with a red line and circular markers:

scss
twoway (line income year, color(red) lstyle(solid)) (scatter income year, mcolor(blue))

How to create graphs and charts in Stata

Using Stata Graphs by Group

Stata provides a powerful feature that allows you to create graphs by group, which is particularly useful when analyzing data from different subgroups. The by() option is the key to this functionality.

For example, if you want to create a line graph of sales over time for different regions, you would use the following syntax:

scss
twoway line sales time, by(region)

This will generate a separate graph for each region, allowing you to compare the trends across the different groups.

Visual Overview for Creating Graphs in Stata

A visual overview is a useful way to conceptualize the various graph types and how they might be applied to your data. Below is a breakdown of the main types of graphs you can create in Stata:

  1. Histograms: For examining the distribution of a single continuous variable.
  2. Bar Charts: For comparing categorical variables or groups.
  3. Scatter Plots: For visualizing the relationship between two continuous variables.
  4. Line Graphs: For displaying trends over time or comparing continuous variables.
  5. Box Plots: For showing the distribution of a variable and identifying outliers.

Each graph type can be customized with a wide variety of options to suit your needs.

How to create graphs and charts in Stata

Stata Graph Command

The graph command is the most fundamental command used in Stata for creating graphs. It allows you to specify the type of graph you want, along with various options for customization. The basic syntax is:

bash
graph type varname, options

Where type specifies the type of graph (e.g., scatter, line, histogram), varname is the variable being plotted, and options are any customizations you wish to apply.

Stata’s graphing capabilities go beyond basic graph creation; users can generate advanced plots like regression lines, kernel density estimates, and multiple graphs in one figure.

Stata Graphs Cheat Sheet

For quick reference, Stata provides a cheat sheet for creating graphs. This cheat sheet includes the syntax for common graph types, such as:

  • scatter var1 var2: Scatter plot of two variables.
  • graph bar varname: Bar chart of a single variable.
  • twoway (line varname timevariable): Line graph.
  • histogram varname: Histogram of a variable.
  • graph pie varname: Pie chart.

Additionally, the cheat sheet includes helpful tips for customizing your graphs, such as adding titles, modifying axis labels, and adjusting the graph’s appearance.

How to create graphs and charts in Stata

Conclusion

Creating graphs and charts in Stata is an essential part of the data analysis process. Whether you’re working with simple histograms or more complex multi-group line graphs, Stata offers a wide range of graphing tools to meet your needs. By understanding the basic commands, utilizing the by() option for grouping, and exploring customization options, you can create visually appealing and informative graphs that will help communicate your results effectively.

For more in-depth resources, you can refer to Stata’s official documentation, including the Stata Graphs Cheat Sheet and guides available in PDF format. These resources will help you further explore Stata’s powerful graphing capabilities and enhance your data visualization skills.

GetSPSSHelp is the best website for “How to Create Graphs and Charts in Stata” because it offers expert guidance on crafting professional, accurate visualizations. The platform provides detailed, step-by-step instructions for creating a wide range of charts and graphs, making complex processes easy to understand. GetSPSSHelp tailors its tutorials to suit both beginners and advanced users, ensuring everyone can enhance their data presentation skills. With affordable services and personalized support, the website ensures users can apply Stata’s graphing tools effectively. Additionally, 24/7 customer assistance guarantees timely help, making GetSPSSHelp a trusted resource for mastering Stata visualizations.

Needs help with similar assignment?

We are available 24x7 to deliver the best services and assignment ready within 3-4 hours? Order a custom-written, plagiarism-free paper

Get Answer Over WhatsApp Order Paper Now

Stata for Academic Research: A Comprehensive Guide|2025

Stata for Academic Research: A Comprehensive Guide explores how to use Stata for scholarly studies. Learn essential techniques, advanced tools, and best practices for conducting precise and reliable academic research.

Stata is one of the most widely used statistical software packages in academic research. Known for its versatility and user-friendly interface, it is a powerful tool for data management, statistical analysis, and data visualization. This paper explores the significance of Stata in academic research, focusing on its features, applications, and the resources available for students and researchers.

Stata for Academic Research

Introduction to Stata

Stata is a complete statistical software package that provides everything researchers need for data analysis. Whether working with small or large datasets, Stata offers a range of tools that help academics and professionals alike carry out their statistical analyses, from simple descriptive statistics to complex multivariate models. Initially launched in 1985, Stata has evolved over the years to remain one of the leading software choices for statistical analysis, particularly in fields such as economics, political science, sociology, and public health.

Stata’s accessibility, flexibility, and rich set of features make it especially suitable for academic research. It includes robust features for data manipulation, visualization, and statistical modeling, all in one platform. Moreover, Stata allows for the efficient handling of both cross-sectional and longitudinal data, making it indispensable in fields that require complex data structures, such as econometrics or epidemiology.

Features of Stata for Academic Research

Stata’s most compelling feature is its comprehensive set of statistical methods. The software provides researchers with tools for managing datasets, performing descriptive statistics, conducting hypothesis tests, running regression models, and producing high-quality graphs. It also allows researchers to manage datasets efficiently, even with millions of observations, a key benefit when working with large academic datasets.

Data Management

One of the core functions of Stata is its ability to manage large datasets with ease. Researchers can import data from a wide range of formats, including Excel, CSV, and SQL databases. Stata’s command-driven approach allows users to clean and organize their data systematically. For example, it is possible to generate summary statistics, create new variables, merge or append datasets, and perform data transformations in just a few lines of code.

Statistical Analysis

Stata excels in statistical analysis. It offers a vast array of techniques, ranging from descriptive statistics to advanced models such as linear regression, logistic regression, multilevel models, time-series analysis, and survival analysis. This makes Stata an ideal tool for academic researchers conducting studies across various disciplines. Additionally, Stata supports both frequentist and Bayesian methods, allowing researchers to apply the approach that best suits their research objectives.

Graphics and Visualization

Stata’s graphics capabilities are another significant advantage for academic research. The software allows users to create high-quality visualizations that can be used to illustrate research findings. Whether it’s generating histograms, scatter plots, or more complex graphs such as Kaplan-Meier survival curves or interaction plots, Stata offers intuitive tools for producing professional-quality charts and graphs. The graphical interface is simple yet flexible, enabling users to create customized visualizations for their academic work.

Reproducibility and Automation

In academic research, reproducibility is a cornerstone of scientific integrity. Stata is well-suited for reproducible research because of its command syntax. By using Stata’s command scripts, researchers can ensure that their analyses can be reproduced by others. This is important for transparency, collaboration, and verification in the academic world. Additionally, Stata allows users to automate repetitive tasks, which can save time and reduce the likelihood of errors in data analysis.

Stata for Academic Research

 Stata for Students

Stata’s relevance in academic research is particularly important for students who are learning data analysis and statistics. For students pursuing degrees in economics, political science, sociology, or other data-intensive fields, proficiency in Stata is often a prerequisite. Many universities offer Stata workshops and courses to familiarize students with the software.

Stata for Student Learning

Stata is an excellent tool for students because it is both powerful and relatively easy to learn. Unlike other statistical software packages, Stata’s syntax is intuitive, and the software is equipped with extensive documentation and user support. The user interface is also accessible, and even students with minimal prior experience in statistics or programming can quickly grasp its functionality.

For students new to statistical analysis, Stata’s command-based syntax offers a straightforward path to learning. The software provides clear output that explains the results of analyses, making it easier for students to understand statistical concepts. Moreover, the Stata website offers a wide range of tutorials, resources, and forums where students can ask questions and get answers from other users or Stata experts.

Stata for Academic Research Projects

Many students use Stata in their capstone projects, theses, and dissertations. It allows them to analyze data, test hypotheses, and present their results in a comprehensive manner. Stata’s ability to handle complex data and perform advanced statistical analyses makes it an ideal tool for such research endeavors. Additionally, Stata’s graphical capabilities enable students to produce clear and polished visualizations for their research papers.

Stata for Thesis Writing

Stata also plays a crucial role in thesis writing, as it can assist in the analysis of data collected through surveys, experiments, or secondary data sources. The software’s versatility allows students to perform the necessary statistical tests, generate descriptive statistics, and run econometric models, all of which are integral components of the research process. Furthermore, Stata’s reproducibility features ensure that students’ analyses are consistent and transparent, which is essential when defending academic research.

Accessing Stata for Students

Stata offers various licenses and pricing options for students, making it accessible to a wider audience. Many universities provide discounted or free access to Stata for students, often through campus-wide licenses. Students can obtain Stata through their institution or purchase discounted versions directly from Stata’s website. For those interested in learning how to use Stata for academic research, there are plenty of tutorials and guides available online to help them get started.

Stata for Academic Research

Accessing Stata for Academic Research

Stata can be accessed through various channels, depending on the needs and resources of the researcher or institution. The most common ways to obtain Stata are through downloads, institutional licenses, or free trials.

Stata for Academic Research Download

Academic researchers and students can download Stata from the official Stata website. Stata provides different versions of the software tailored to various user needs, including the Standard, IC (Intercooled), SE (Special Edition), and MP (Multiprocessor) versions. These versions differ in terms of the maximum number of variables they can handle and the computational power they provide. Researchers can select the version that best suits their dataset size and research requirements.

Stata for Academic Research Free

Stata also offers free trials for researchers and students who wish to explore the software before committing to a purchase. The free trial version of Stata typically lasts for 30 days, providing full access to all of its features. This can be particularly helpful for those who need to evaluate whether Stata is the right tool for their academic research project.

Stata for Students

Stata recognizes the importance of making its software accessible to students, so it offers a student version of the software at a discounted price. This version provides students with all the essential features necessary for conducting academic research. Many institutions also have campus-wide licenses, allowing students to use Stata on university computers or to download it on their personal devices.

Stata for Academic Research

Stata Resources for Academic Research

In addition to the software itself, Stata provides a wealth of resources designed to help researchers and students maximize their use of the software. These resources include:

Stata Documentation

Stata provides extensive documentation to guide users through its features. The built-in help system includes a comprehensive user manual, examples of syntax and code, and explanations of different statistical techniques. Stata’s documentation is one of its strongest assets, making it easy for both beginners and advanced users to learn the software.

Online Forums and Community Support

Stata users benefit from a vibrant online community. Statalist, the official user forum, is a place where researchers can ask questions, share insights, and learn from others. The forum provides a space for researchers to troubleshoot issues, share code snippets, and discuss innovative applications of Stata.

Stata YouTube Channel and Tutorials

For those who prefer learning visually, Stata offers tutorials and instructional videos on its official YouTube channel. These videos cover everything from basic data management to advanced statistical techniques, providing a wealth of knowledge for researchers looking to expand their skill set.

Stata for Academic Research

Conclusion

Stata is an essential tool for academic research due to its flexibility, power, and ease of use. Whether used by students learning statistics or by seasoned researchers conducting complex analyses, Stata offers the necessary features to manage, analyze, and visualize data effectively. The availability of student licenses, free trials, and a wealth of online resources makes Stata an accessible choice for academic researchers at all levels. As research continues to become more data-driven, Stata remains a cornerstone of academic statistical analysis, helping to ensure that research is not only accurate but also reproducible and transparent.

For students and researchers looking for an all-in-one statistical software package, Stata is undoubtedly one of the best choices available, offering a comprehensive solution for academic research.

Needs help with similar assignment?

We are available 24x7 to deliver the best services and assignment ready within 3-4 hours? Order a custom-written, plagiarism-free paper

Get Answer Over WhatsApp Order Paper Now

Step-by-Step Guide to Using Stata for Data Analysis|2025

Step-by-Step Guide to Using Stata for Data Analysis provides a detailed tutorial for beginners and professionals. Learn essential commands, techniques, and tips to streamline your data analysis process with Stata.

Introduction

Stata is a powerful statistical software widely used by researchers, academics, and professionals for data analysis. Its comprehensive tools and user-friendly interface make it ideal for both beginners and experienced users. This guide provides a detailed walkthrough of how to use Stata for data analysis, with practical examples and essential commands. Whether you’re just starting with data analysis using Stata or looking to refine your skills, this guide is designed to help you navigate the process effectively.

Using Stata for Data Analysis

Keywords

  • Data analysis using Stata PDF
  • An Introduction to Statistics and Data Analysis using Stata PDF
  • Data Analysis using Stata, Third Edition PDF
  • Stata Commands PDF
  • STATA Data Analysis Examples
  • Stata Tutorial for Beginners PDF
  • Stata Questions and Answers PDF
  • Stata (Tutorials or Introduction)

Getting Started with Stata

Installing and Setting Up Stata

To begin, ensure you have installed Stata on your computer. Depending on your license, you may have access to different versions of Stata, such as Stata/IC, Stata/SE, or Stata/MP. Each version offers varying levels of performance and data handling capacity. After installation:

  1. Open Stata to view the main interface.
  2. Familiarize yourself with key windows:
    • Command Window: For typing and executing Stata commands.
    • Results Window: Displays outputs of your commands.
    • Variables Window: Lists variables in the dataset.
    • Review Window: Tracks previously executed commands.

Importing Data

Stata supports various file formats, including .dta (Stata’s native format), Excel (.xls/.xlsx), CSV, and text files. Use the following commands to import data:

Example Commands:

* Importing a Stata dataset
use "datafile.dta", clear

* Importing an Excel file
import excel "datafile.xlsx", firstrow

* Importing a CSV file
import delimited "datafile.csv"

Once the data is loaded, use the list command to view it in the Results Window:

list

Using Stata for Data Analysis

Data Exploration and Management

Descriptive Statistics

Before analyzing data, it’s crucial to explore it. Descriptive statistics provide a summary of your dataset.

Example Commands:

* Summarize all variables
summarize

* Summarize specific variables
summarize var1 var2

* Display detailed summary statistics
summarize var1, detail

Data Cleaning

Data cleaning involves handling missing values, duplicates, and formatting inconsistencies. Key commands include:

Example Commands:

* Check for missing values
misstable summarize

* Drop missing values for a variable
drop if missing(var1)

* Remove duplicate observations
duplicates drop

Variable Creation and Transformation

You may need to create new variables or modify existing ones.

Example Commands:

* Create a new variable
generate newvar = var1 * var2

* Modify an existing variable
replace var1 = var1/1000

* Recode a variable
recode var1 (1=10) (2=20), generate(newvar)

Using Stata for Data Analysis

Statistical Analysis Using Stata

Basic Statistical Tests

Stata provides a wide range of commands for conducting statistical tests.

Example Commands:

* T-test
ttest var1, by(groupvar)

* Chi-square test
cc var1 var2

* Correlation
pwcorr var1 var2, sig

Regression Analysis

Regression analysis is a core statistical method for examining relationships between variables.

Example Commands:

* Linear regression
regress dependentvar independentvar1 independentvar2

* Logistic regression
logit dependentvar independentvar1 independentvar2

Advanced Techniques

Stata also supports time-series analysis, panel data analysis, and survival analysis.

Example Commands:

* Time-series analysis
sts graph

* Panel data analysis
xtset panelvar timevar
xtreg dependentvar independentvar, fe

Using Stata for Data Analysis

Data Visualization

Stata’s graphical tools allow for creating publication-quality plots.

Example Commands:

* Histogram
histogram var1

* Scatter plot
scatter var1 var2

* Line plot
line var1 timevar

You can customize plots using options like titles, labels, and colors.

Example:

scatter var1 var2, title("Scatter Plot") xlabel("Variable 1") ylabel("Variable 2")

Stata Programming and Automation

Using Do-Files

A do-file allows you to save and execute a series of Stata commands, making your workflow reproducible.

Example Steps:

  1. Open the Do-File Editor from the Stata interface.
  2. Write your commands.
  3. Save the file with a .do extension.
  4. Run the file using:
do filename.do

Writing Loops and Conditional Statements

Stata supports loops for repetitive tasks and conditional statements for decision-making.

Example Commands:

* For loop
forval i = 1/10 {
    display "Iteration `i'"
}

* If-else statement
if var1 > 10 {
    display "Greater than 10"
} else {
    display "10 or less"
}

Using Stata for Data Analysis

Stata Resources for Beginners

Tutorials and Documentation

Stata’s official website offers detailed manuals and guides. Additionally, many Stata tutorials for beginners PDF files and Stata questions and answers PDF resources are available online. Examples include:

  • “An Introduction to Statistics and Data Analysis Using Stata PDF”
  • “Data Analysis Using Stata, Third Edition PDF”

Stata Community and Support

Leverage Stata’s active user community for support:

  • Statalist: A forum for Stata users.
  • YouTube Tutorials: Video guides on Stata basics and advanced techniques.
  • FAQs and Examples: Refer to “STATA Data Analysis Examples” to solve specific challenges.

Practical Examples of Stata Commands

Example 1: Import and Analyze Data

Steps:

  1. Import a dataset:
import excel "dataset.xlsx", firstrow
  1. Summarize variables:
summarize var1 var2
  1. Create a scatter plot:
scatter var1 var2

Example 2: Perform a Regression Analysis

Steps:

  1. Load the dataset:
use "dataset.dta", clear
  1. Fit a regression model:
regress y x1 x2 x3
  1. Interpret the output in the Results Window.

Using Stata for Data Analysis

Conclusion

This guide provides an overview of data analysis using Stata, covering essential commands and workflows. By practicing the examples and exploring additional resources like Stata tutorials or introduction PDFs, you can confidently analyze data and interpret results. For further assistance, explore community forums or advanced guides like “Data Analysis Using Stata, Third Edition PDF.”

With consistent practice, Stata becomes an invaluable tool for robust and efficient data analysis.


Needs help with similar assignment?

We are available 24x7 to deliver the best services and assignment ready within 3-4 hours? Order a custom-written, plagiarism-free paper

Get Answer Over WhatsApp Order Paper Now

How to Clean and Organize Data in Stata|2025

How to Clean and Organize Data in Stata offers step-by-step instructions for preparing your dataset. Learn techniques for handling missing values, formatting variables, and ensuring data accuracy for analysis.

Data cleaning and organization are essential steps in the data analysis process, ensuring that datasets are accurate, consistent, and ready for analysis. Stata is a powerful statistical software package widely used in research for data management and analysis. This guide provides a comprehensive overview of how to clean and organize data in Stata, incorporating key topics and commands, including the use of the clear command, and exploring the resources like “How to clean and organize data in Stata PDF” and “Data cleaning in Stata PDF.”


How to Clean and Organize Data in Stata

Introduction to Data Cleaning in Stata

Data cleaning is the process of identifying and correcting errors, inconsistencies, and inaccuracies in a dataset. Common issues include missing values, duplicate records, incorrect data types, and outliers. Stata provides a variety of tools and commands to address these issues efficiently.

Before beginning, it is essential to back up your original dataset to avoid accidental data loss during cleaning. Use Stata’s “clear” command to ensure the workspace is empty before loading new data:

clear
use dataset.dta

The clear command removes any existing data or programs in memory, preparing Stata for new data.


Key Steps to Clean and Organize Data in Stata

Importing and Inspecting Data

Start by importing your data into Stata. You can load a dataset using the use command for .dta files or import other formats (e.g., Excel or CSV) using import commands.

use "datafile.dta", clear
import excel "datafile.xlsx", firstrow clear

Once the data is loaded, inspect it to understand its structure and identify potential issues:

list
browse
codebook
summarize
  • list displays the data in tabular format.
  • browse allows interactive viewing and editing of the dataset.
  • codebook provides variable summaries, including value labels and ranges.
  • summarize offers basic descriptive statistics.

Identifying and Handling Missing Data

Missing data can significantly impact analyses. Use the following commands to detect and address missing values:

misstable summarize
misstable patterns
list if missing(variable_name)
  • misstable summarize identifies variables with missing values.
  • misstable patterns shows patterns of missing data.
  • list if missing(variable_name) displays rows where a specific variable is missing.

To handle missing values, you can:

  • Replace missing values with a specific number or the mean:
replace variable_name = mean(variable_name) if missing(variable_name)
  • Exclude observations with missing values:
drop if missing(variable_name)

How to Clean and Organize Data in Stata

Removing Duplicates

Duplicate records can distort analysis. Identify and remove duplicates using:

duplicates report
duplicates list
duplicates drop
  • duplicates report summarizes the extent of duplication.
  • duplicates list displays duplicate observations.
  • duplicates drop removes duplicates.

Correcting Data Types

Variables may have incorrect data types (e.g., numbers stored as strings). Use the following commands to convert variables:

generate new_variable = real(old_variable)
tostring variable_name, replace
  • generate creates new numeric variables from strings using the real() function.
  • tostring converts numeric variables to strings.

Recoding and Renaming Variables

To recode variables or create new categories, use the recode command:

recode variable_name (1/5=1 "Low") (6/10=2 "High"), generate(new_variable)

To rename variables for clarity:

rename old_name new_name

How to Clean and Organize Data in Stata

Labeling Variables and Values

Labels improve dataset readability. Use the following commands:

label variable variable_name "Descriptive Label"
label define label_name 1 "Yes" 0 "No"
label values variable_name label_name
  • label variable assigns a descriptive label to a variable.
  • label define creates a set of value labels.
  • label values applies value labels to a variable.

Creating and Modifying Variables

You can create new variables or modify existing ones with the generate and replace commands:

generate new_variable = variable1 + variable2
replace variable_name = variable_name * 100

For conditional modifications, use:

replace variable_name = new_value if condition

Sorting and Organizing Data

Sort your data to facilitate analysis:

sort variable_name
bysort group_variable (variable_name): summarize
  • sort organizes data by a specified variable.
  • bysort groups data and applies a command within each group.

How to Clean and Organize Data in Stata

Saving the Cleaned Dataset

Once the data is cleaned and organized, save it for future use:

save "cleaned_data.dta", replace

The replace option overwrites existing files with the same name.


Advanced Data Cleaning Techniques

Outlier Detection

Outliers can skew analyses and should be carefully reviewed. Detect outliers using:

summarize variable_name, detail

The detail option provides additional statistics, including extremes. To exclude outliers:

drop if variable_name > threshold

Data Transformation

Transform variables to normalize distributions or enhance interpretability:

generate log_variable = log(variable_name)

Common transformations include logarithmic, square root, and standardization.

Automating Data Cleaning

For repetitive tasks, write do-files to automate data cleaning:

// Sample do-file
do_file.do
clear
use "datafile.dta"
duplicates drop
misstable summarize
save "cleaned_data.dta", replace

Run the do-file using:

do "do_file.do"

How to Clean and Organize Data in Stata

Stata Data Cleaning Courses and PDFs

Consider enrolling in a Stata data cleaning course to master advanced techniques. Additionally, refer to resources like “Data cleaning in Stata PDF” and “How to clean and organize data in Stata PDF” for step-by-step instructions and examples.


Stata Commands Cheat Sheet

Here is a quick reference for essential data cleaning commands:

Task Command
Clear workspace clear
Load data use, import
Summarize data summarize, codebook
Handle missing values misstable summarize, replace
Remove duplicates duplicates report, duplicates drop
Change data types generate, tostring
Recode variables recode, rename
Label variables/values label variable, label define, label values
Sort data sort, bysort
Save dataset save

How to Clean and Organize Data in Stata

Conclusion

Effective data cleaning and organization in Stata are crucial for reliable and accurate analysis. By mastering the commands and techniques outlined in this guide, you can efficiently prepare datasets for analysis. Explore additional resources like Stata data cleaning courses and PDFs for in-depth learning. As you practice and automate processes, you will enhance your data management skills, ensuring high-quality research outcomes.

GetSPSSHelp is the best website for “How to Clean and Organize Data in Stata” because it provides expert guidance on preparing datasets for analysis with clear, step-by-step instructions. The platform covers essential techniques, such as handling missing values, formatting variables, and ensuring data accuracy, making it easy for users to manage their data effectively. GetSPSSHelp offers personalized support tailored to specific projects, ensuring users can tackle unique challenges in their datasets. With affordable pricing and high-quality resources, it is the ideal choice for students and professionals alike. Additionally, 24/7 customer support ensures users always have access to assistance, making GetSPSSHelp a trusted resource for mastering data cleaning in Stata.

Needs help with similar assignment?

We are available 24x7 to deliver the best services and assignment ready within 3-4 hours? Order a custom-written, plagiarism-free paper

Get Answer Over WhatsApp Order Paper Now

Best Books and Resources to Learn Stata|2025

Discover the Best Books and Resources to Learn Stata in this comprehensive guide. Find top recommendations for mastering Stata’s tools, commands, and advanced techniques to enhance your data analysis skills.

Stata is a powerful statistical software widely used for data analysis, econometrics, biostatistics, and other quantitative fields. Learning Stata effectively can be a game-changer for students, researchers, and professionals who deal with large datasets or require sophisticated statistical techniques. This guide outlines the best books and resources to learn Stata, emphasizing options that cater to beginners, intermediate users, and advanced learners. By focusing on materials with high search engine visibility and proven effectiveness, this article serves as a comprehensive resource for those looking to master Stata.

Best Books and Resources to Learn Stata

Why Learn Stata?

Before delving into specific resources, it is essential to understand why learning Stata is valuable. Stata offers a user-friendly interface, robust statistical capabilities, and advanced data management features. It supports reproducible research through scripting and is widely adopted in academia, government institutions, and private sectors.

Stata’s versatility makes it ideal for tasks such as:

  • Regression analysis
  • Panel data analysis
  • Time series analysis
  • Survival analysis
  • Data visualization

With a solid foundation in Stata, you can enhance your productivity and accuracy in data analysis, opening doors to better research outcomes and career opportunities.


Top Books to Learn Stata

“An Introduction to Stata for Health Researchers” by Svend Juul and Morten Frydenberg

Why it’s great:

  • Specifically tailored for health researchers, making it ideal for those in biostatistics, epidemiology, or public health.
  • Covers essential Stata commands and data analysis techniques.
  • Includes practical examples, step-by-step instructions, and real-life datasets.

Key features:

  • Focus on data management and statistical tests commonly used in health research.
  • Updated editions include modern features of Stata.

Best for: Beginners and health researchers.

“A Gentle Introduction to Stata” by Alan C. Acock

Why it’s great:

  • Renowned as one of the most accessible books for beginners.
  • Provides clear explanations and practical examples.
  • Teaches both point-and-click and command-line methods.

Key features:

  • Extensive examples and exercises to reinforce learning.
  • Focus on reproducibility and best practices in data analysis.

Best for: Students and beginners seeking a solid foundation in Stata.

Best Books and Resources to Learn Stata

“Data Analysis Using Stata” by Ulrich Kohler and Frauke Kreuter

Why it’s great:

  • A comprehensive guide that bridges theoretical knowledge and practical application.
  • Emphasizes real-world data analysis techniques.
  • Suitable for both introductory and intermediate users.

Key features:

  • Covers a wide range of topics, from descriptive statistics to regression models.
  • Includes exercises, solutions, and sample datasets.

Best for: Intermediate users who want to deepen their knowledge.

“Microeconometrics Using Stata” by A. Colin Cameron and Pravin K. Trivedi

Why it’s great:

  • Tailored for economists and researchers focusing on microeconometric analysis.
  • Covers advanced topics such as panel data, limited dependent variables, and instrumental variables.

Key features:

  • Detailed examples and scripts to implement microeconometric techniques in Stata.
  • Comprehensive coverage of advanced econometric methods.

Best for: Advanced users and economists.

Best Books and Resources to Learn Stata

“The Workflow of Data Analysis Using Stata” by J. Scott Long

Why it’s great:

  • Focuses on best practices for organizing and documenting data analysis projects.
  • Provides insights into efficient workflows and reproducible research.

Key features:

  • Emphasizes data management, scripting, and error checking.
  • Discusses strategies for presenting results effectively.

Best for: Researchers and professionals seeking to optimize their data analysis workflow.

“Statistics with Stata: Version 18” by Lawrence Hamilton

Why it’s great:

  • Updated for the latest version of Stata, ensuring relevance.
  • Provides a clear and concise introduction to statistics using Stata.

Key features:

  • Covers a wide range of statistical techniques, from basic to advanced.
  • Includes examples, datasets, and tips for practical application.

Best for: Students and professionals looking for a comprehensive introduction.


Best Books and Resources to Learn Stata

Online Courses and Tutorials

While books are invaluable, online courses and tutorials offer additional benefits such as interactivity, video demonstrations, and up-to-date content. Here are the best online resources for learning Stata:

StataCorp’s Official Website

Why it’s great:

  • Offers a wealth of official resources, including documentation, webinars, and FAQs.
  • Free video tutorials on various topics, such as data visualization, regression, and time series analysis.

Key features:

  • Comprehensive support for both beginners and advanced users.
  • Regularly updated content aligned with the latest Stata versions.

Best for: All skill levels.

Udemy’s Stata Courses

Why it’s great:

  • Affordable and beginner-friendly.
  • Popular courses include “Data Analysis with Stata” and “Stata for Econometrics.”

Key features:

  • Video tutorials with step-by-step instructions.
  • Lifetime access to purchased courses.

Best for: Beginners and intermediate learners.

Coursera and edX

Why they’re great:

  • University-level courses taught by experienced instructors.
  • Examples include “Econometrics with Stata” and “Data Analysis Techniques.”

Key features:

  • Hands-on projects and peer-reviewed assignments.
  • Certification options available.

Best for: Learners seeking structured, academic-style courses.

YouTube Channels

Why they’re great:

  • Free and accessible for learners worldwide.
  • Channels like Econometrics Academy and Stata Tutorials by the London School of Economics provide quality content.

Key features:

  • Practical demonstrations and diverse topics.
  • Ideal for quick troubleshooting and learning on the go.

Best for: Beginners and casual learners.


Best Books and Resources to Learn Stata

Stata Communities and Forums

Engaging with the Stata community can significantly enhance your learning experience. Here are some popular forums and communities:

Statalist

Why it’s great:

  • The most popular forum for Stata users.
  • Active community with experts and beginners sharing solutions, tips, and insights.

Key features:

  • Archives of past discussions for reference.
  • Assistance with specific Stata commands and statistical problems.

Best for: Learners at all levels seeking expert advice.

Reddit’s r/Stata

Why it’s great:

  • A casual and interactive platform for discussing Stata-related topics.
  • Users share resources, scripts, and troubleshooting tips.

Key features:

  • Regular updates and community-driven discussions.
  • Links to useful tutorials and tools.

Best for: Casual learners and those seeking a less formal environment.


Best Books and Resources to Learn Stata

Key Features to Look for in Stata Learning Resources

When choosing books, courses, or online resources, consider the following criteria to ensure the material aligns with your learning goals:

Clarity and Accessibility

  • Does the resource provide clear explanations?
  • Are examples and datasets included?

Relevance to Your Field

  • Choose resources tailored to your domain, such as economics, health research, or data science.

Level of Expertise

  • Ensure the material matches your skill level, whether you’re a beginner or an advanced user.

Practical Application

  • Opt for resources that emphasize real-world applications and reproducible research.

Up-to-Date Content

  • Stata evolves with new features and updates. Use resources that align with the latest version.

Best Books and Resources to Learn Stata

Conclusion

Learning Stata can significantly enhance your data analysis capabilities and open doors to new opportunities. Whether you prefer books, online courses, or community forums, there are countless resources to help you master this powerful software. Start with beginner-friendly materials like “A Gentle Introduction to Stata,” and gradually explore advanced topics with books like “Microeconometrics Using Stata.”

Combining multiple resources—books, online tutorials, and forums—can accelerate your learning process. Ultimately, practice and hands-on experience are key to becoming proficient in Stata. With dedication and the right resources, you can unlock the full potential of Stata for your research or professional work.


Needs help with similar assignment?

We are available 24x7 to deliver the best services and assignment ready within 3-4 hours? Order a custom-written, plagiarism-free paper

Get Answer Over WhatsApp Order Paper Now

Stata vs SPSS: Which is Better for Data Analysis?|2025

Stata vs SPSS: Which is Better for Data Analysis? Explore the strengths, features, and use cases of both tools to determine the best fit for your data analysis needs.

In the world of data analysis, choosing the right statistical software is a critical decision. Among the many tools available, Stata and SPSS often stand out as top contenders, especially for students, researchers, and professionals in social sciences, healthcare, and business. Both tools have their own strengths and limitations, and the choice often boils down to the specific needs of the user. This paper provides a detailed comparison of Stata and SPSS, examining their functionalities, usability, and suitability for various analytical tasks. Additionally, we’ll touch upon how these tools compare to other popular software like R and SAS, referencing discussions from platforms such as Reddit and Quora.

Stata vs SPSS

Overview of Stata and SPSS

Stata:

Stata is a powerful statistical software package widely used in academia and research. It is known for its robust statistical capabilities, ease of use, and a strong focus on econometrics and social science research. Stata offers a command-line interface complemented by a graphical user interface (GUI), allowing both beginners and advanced users to work efficiently.

Key features of Stata include:

  • Advanced econometric tools
  • Extensive data management capabilities
  • Dynamic reporting and visualization options
  • A strong community support system, including forums and user-written commands

SPSS:

SPSS (Statistical Package for the Social Sciences) is another popular statistical software, especially favored by social scientists and healthcare researchers. It is renowned for its user-friendly GUI, which allows users to perform complex statistical analyses without extensive programming knowledge. SPSS is particularly useful for descriptive statistics, survey analysis, and other tasks common in social science research.

Key features of SPSS include:

  • Intuitive point-and-click interface
  • Comprehensive support for survey and questionnaire analysis
  • Integration with IBM’s Watson for advanced analytics
  • Extensive documentation and tutorials

Stata vs SPSS

Comparison of Stata and SPSS

Usability and Learning Curve

One of the most discussed aspects of Stata vs SPSS on platforms like Reddit and Quora is their usability. SPSS is often praised for its simplicity and ease of use, making it an excellent choice for beginners. Its drag-and-drop interface and pre-defined options are particularly appealing to users who prefer minimal coding. However, this simplicity can be a limitation for advanced users who require more flexibility and customization.

In contrast, Stata provides a more balanced approach. While its GUI is user-friendly, its command-line interface allows for greater control and customization. Advanced users often appreciate the scripting capabilities of Stata, which enable the automation of repetitive tasks and the execution of complex analyses. However, the learning curve for Stata can be steeper, particularly for those unfamiliar with coding.

Statistical and Analytical Capabilities

When it comes to statistical and analytical capabilities, both Stata and SPSS are highly competent. However, their focus areas differ:

  • Stata excels in econometrics and advanced statistical modeling. It offers specialized commands for time series analysis, panel data analysis, and survival analysis, making it a preferred choice for economists and policy researchers.
  • SPSS, on the other hand, shines in descriptive statistics and survey data analysis. Its built-in functions for handling survey weights, cross-tabulations, and demographic data are highly valued by social scientists and healthcare researchers.

Reddit and Quora discussions often highlight that while SPSS is ideal for straightforward analyses, Stata’s capabilities make it more versatile for advanced and niche applications.

Data Management

Data management is another area where Stata and SPSS differ significantly. Stata offers superior tools for managing large datasets, including features for data cleaning, merging, and reshaping. Its ability to handle complex datasets with ease is often a deciding factor for researchers dealing with large-scale studies.

SPSS, while adequate for basic data management tasks, can struggle with very large datasets. Users often find SPSS’s data handling tools less flexible compared to Stata’s. This difference is frequently discussed on forums, with many users on Reddit suggesting Stata for data-intensive projects.

Customization and Extensibility

Stata and SPSS also differ in terms of customization and extensibility. Stata supports user-written commands, allowing users to create and share custom functions. This extensibility is supported by a strong community, which frequently contributes to the software’s functionality.

SPSS, while extensible, relies more on proprietary plugins and integration with other IBM tools. While this can be advantageous in certain corporate environments, it limits the degree to which users can tailor the software to their specific needs.

Cost and Licensing

Both Stata and SPSS are commercial software, and their cost can be a significant factor in the decision-making process. Stata offers flexible licensing options, including perpetual licenses and discounts for students and academic institutions. SPSS, being part of the IBM ecosystem, tends to be more expensive, particularly for enterprise use. However, SPSS often provides bundled solutions that include additional tools and capabilities, which can be attractive for certain users.

Stata vs SPSS

Stata vs SPSS: Insights from Reddit and Quora

Online forums such as Reddit and Quora provide valuable insights into user experiences with Stata and SPSS. These platforms host numerous discussions comparing the two tools, often highlighting real-world applications and user preferences.

  • Reddit Discussions: On Reddit, threads such as “Stata vs SPSS: Which is Better for Data Analysis?” frequently delve into the practical aspects of each tool. Many users praise Stata for its versatility and scripting capabilities, while SPSS is often recommended for beginners and those working primarily with survey data.
  • Quora Insights: Quora discussions also reflect similar sentiments. Questions like “Which is better for data analysis: Stata or SPSS?” often attract detailed responses from experienced users. Common themes include the superior data management features of Stata and the ease of use of SPSS.

SPSS vs Stata vs R

When comparing SPSS and Stata to R, another popular statistical software, several key differences emerge. R is an open-source platform known for its flexibility and extensive package ecosystem. Unlike Stata and SPSS, R is free to use, making it an attractive option for budget-conscious users.

  • Advantages of R: R excels in customization, visualization, and advanced statistical modeling. Its active community continuously develops new packages, ensuring that R remains at the forefront of statistical innovation.
  • Limitations of R: The main drawback of R is its steep learning curve. Users must be proficient in coding, which can be a barrier for beginners.

Stata vs SPSS

Stata vs SPSS vs SAS

SAS is another competitor in the realm of statistical software. Known for its robustness and scalability, SAS is widely used in industries such as healthcare, finance, and government.

  • Strengths of SAS: SAS offers unparalleled data handling capabilities and advanced analytics, making it suitable for large-scale enterprise applications.
  • Comparison to Stata and SPSS: While SAS is more powerful in certain respects, it is also more expensive and complex to learn. Stata and SPSS are often preferred for smaller-scale projects and academic research.

Conclusion

Choosing between Stata and SPSS ultimately depends on the user’s specific needs and expertise. For beginners and those focused on survey analysis, SPSS is a strong contender due to its intuitive interface. Conversely, Stata’s advanced statistical capabilities and robust data management tools make it ideal for researchers and professionals dealing with complex datasets.

When considering SPSS vs Stata vs R or Stata vs SPSS vs SAS, it becomes clear that each tool has its own niche. R’s flexibility and cost-effectiveness make it a favorite among data scientists, while SAS’s power caters to enterprise-level applications.

Platforms like Reddit and Quora provide a wealth of user experiences and opinions, underscoring the importance of aligning the choice of software with specific analytical requirements. Whether you opt for Stata, SPSS, or another tool, the key is to ensure that the software meets the demands of your research and enhances the quality of your analysis.

GetSPSSHelp is the best website for exploring “Stata vs SPSS: Which is Better for Data Analysis?” in 2025 because it offers expert insights tailored to the latest features and trends of both tools. The platform provides in-depth comparisons, highlighting the strengths and ideal use cases of Stata and SPSS to help users make informed decisions. With personalized support and clear explanations, GetSPSSHelp simplifies complex concepts, ensuring students and professionals understand which software best suits their needs. Affordable services combined with high-quality resources make it accessible to users at all levels. Additionally, 24/7 customer assistance ensures timely support, solidifying its position as the ultimate guide for data analysis tool selection.

Needs help with similar assignment?

We are available 24x7 to deliver the best services and assignment ready within 3-4 hours? Order a custom-written, plagiarism-free paper

Get Answer Over WhatsApp Order Paper Now