How to Use SPSS for Predictive Analysis Assignments|2025

Predictive analysis is a powerful statistical technique that enables analysts to forecast future outcomes based on historical data. IBM SPSS (Statistical Package for the Social Sciences) is one of the most versatile tools for performing predictive analysis assignments, offering a wide range of features to analyze data, build models, and generate actionable insights. This guide explores how to use SPSS for predictive analysis assignments, providing step-by-step instructions and practical tips.

SPSS for Predictive Analysis

Why Choose SPSS for Predictive Analysis?

SPSS is a preferred tool for predictive analysis due to its:

  • User-Friendly Interface: Intuitive menus and drag-and-drop features make it accessible for beginners.
  • Comprehensive Functionality: Includes tools for regression, decision trees, and machine learning algorithms.
  • Seamless Data Integration: Works with diverse file formats, including Excel, CSV, and SQL databases.
  • Visualization Tools: Offers charts and graphs to enhance data interpretation.

Getting Started with Predictive Analysis in SPSS

1. Define the Objective

Start by defining the goal of your predictive analysis assignment. Common objectives include:

  • Predicting customer behavior (e.g., churn, purchase likelihood).
  • Forecasting sales or revenue.
  • Identifying risk factors in health or finance.

A clear objective helps determine the appropriate data, variables, and analysis techniques.

2. Collect and Prepare Data

Data preparation is critical for accurate predictive analysis. Follow these steps:

  1. Data Collection:
    • Gather historical data relevant to the prediction task.
    • Ensure data quality by verifying completeness and consistency.
  2. Data Cleaning:
    • Handle missing values using Transform > Replace Missing Values.
    • Remove duplicates and correct inconsistencies.
  3. Data Transformation:
    • Recode categorical variables into numeric formats (Transform > Recode into Different Variables).
    • Normalize or standardize continuous variables if required.
  4. Load Data into SPSS:
    • Open the data file in SPSS by selecting File > Open > Data.

3. Explore the Data

Before building predictive models, understand your data using descriptive statistics and visualizations:

  1. Descriptive Statistics:
    • Use Analyze > Descriptive Statistics > Frequencies or Descriptives to compute measures like mean, median, and standard deviation.
  2. Visualization:
    • Create histograms, scatterplots, or boxplots using Graphs > Chart Builder to identify trends and anomalies.

Building Predictive Models in SPSS

1. Linear Regression

Linear regression predicts a continuous dependent variable based on one or more independent variables. Steps include:

  1. Go to Analyze > Regression > Linear.
  2. Select the dependent variable and independent variables.
  3. Click OK to run the analysis.
  4. Interpret the coefficients in the output to understand variable impact.

2. Logistic Regression

Logistic regression is used when the dependent variable is binary (e.g., yes/no, 0/1). Steps include:

  1. Go to Analyze > Regression > Binary Logistic.
  2. Specify the dependent variable and predictors.
  3. Review the odds ratios (Exp(B)) in the output to interpret the likelihood of outcomes.

3. Decision Trees

Decision trees classify data into categories or predict outcomes based on splits in the data:

  1. Navigate to Analyze > Classify > Tree.
  2. Select the dependent and independent variables.
  3. Choose a tree-growing method (e.g., CHAID, CART).
  4. Examine the tree diagram and node statistics for insights.

4. Time Series Analysis

Time series analysis forecasts future values based on historical trends:

  1. Go to Analyze > Forecasting > Create Models.
  2. Select the time series variable and model type (e.g., ARIMA, exponential smoothing).
  3. Review the model fit statistics and predicted values.

5. Neural Networks

Neural networks are advanced machine learning models for complex, non-linear relationships:

  1. Go to Analyze > Neural Networks > Multilayer Perceptron.
  2. Specify the dependent and independent variables.
  3. Customize settings like activation functions and training algorithms.
  4. Interpret the weights and hidden layer nodes for insights.

SPSS for Predictive Analysis

Evaluating Predictive Models

1. Assess Model Fit

SPSS provides metrics to evaluate model performance:

  • R-Squared: Indicates the proportion of variance explained by the model (higher is better).
  • Accuracy: Percentage of correct predictions for classification models.
  • Mean Absolute Error (MAE): Average absolute error of predictions (lower is better).

2. Validate the Model

Use cross-validation or a train-test split to ensure model generalizability:

  • Split the dataset using Data > Select Cases.
  • Build the model on the training set and test it on the validation set.
  • Compare performance metrics across datasets.

3. Check Assumptions

Ensure the model meets key assumptions:

  • Linearity: Relationships between variables should be linear for linear regression.
  • Independence: Observations should be independent.
  • Normality: Residuals should be normally distributed.

Interpreting Results

1. Relate Findings to Objectives

Interpret results in the context of the research objective. For instance:

  • A high R-squared value indicates that the model explains most of the variability in the dependent variable.
  • Significant predictors (p < 0.05) provide actionable insights for decision-making.

2. Use Visualizations

SPSS allows you to generate charts and plots for better interpretation:

  • Use scatterplots for regression line fit.
  • Create classification matrices for logistic regression.
  • Visualize decision tree paths.

3. Report Confidence Levels

Include confidence intervals and p-values to communicate the reliability of your predictions.

Advanced Predictive Techniques in SPSS

1. Ensemble Methods

Combine multiple models to improve prediction accuracy. SPSS Modeler supports techniques like bagging and boosting.

2. Text Analytics

Analyze unstructured data (e.g., customer reviews) by integrating SPSS with text analytics tools.

3. Predictive Modeling Extensions

Extend SPSS functionality with Python or R for custom predictive algorithms.

Common Challenges and Solutions

1. Overfitting

  • Challenge: The model performs well on training data but poorly on unseen data.
  • Solution: Use regularization techniques or simplify the model.

2. Missing Data

  • Challenge: Incomplete data can bias predictions.
  • Solution: Impute missing values or use robust models.

3. Multicollinearity

  • Challenge: Highly correlated predictors distort coefficients.
  • Solution: Use variable selection methods or dimensionality reduction.

SPSS for Predictive Analysis

Applications of Predictive Analysis in SPSS

SPSS is widely used across industries:

  • Marketing: Predict customer lifetime value, segment markets.
  • Healthcare: Forecast disease progression, evaluate treatment efficacy.
  • Finance: Assess credit risk, predict stock prices.
  • Education: Predict student performance, optimize resource allocation.

Learning Resources for SPSS Predictive Analysis

  1. IBM SPSS Tutorials: Official guides and examples.
  2. Online Courses: Platforms like Coursera and edX offer SPSS training.
  3. Books: Reference texts such as Data Analysis Using SPSS by Darren George.
  4. Forums and Communities: Join discussions on ResearchGate or SPSS user groups.

Conclusion

Using SPSS for predictive analysis assignments can unlock valuable insights and support data-driven decision-making. By following this guide, you can confidently prepare data, build robust models, and interpret results like a pro. Whether you are forecasting trends, identifying risks, or optimizing strategies, SPSS is a powerful ally in predictive analysis. Getspsshelp.com provides expert guidance on using SPSS for predictive analysis assignments, helping students apply advanced statistical techniques to forecast trends and outcomes. Their support ensures accurate model building and interpretation, making complex predictive analysis accessible and manageable.

Needs help with similar assignment?

We are available 24x7 to deliver the best services and assignment ready within 3-4 hours? Order a custom-written, plagiarism-free paper

Get Answer Over WhatsApp Order Paper Now

Understanding Statistical Significance in SPSS: A Beginner’s Guide|2025

Statistical significance is a fundamental concept in data analysis, particularly in research settings where it helps validate findings. For beginners using SPSS (Statistical Package for the Social Sciences), understanding statistical significance can seem overwhelming. This guide aims to demystify the concept and provide actionable steps for interpreting statistical significance in SPSS effectively. By the end, you will have a solid foundation to confidently analyze and present your data.


Statistical Significance in SPSS

What is Statistical Significance?

Statistical significance indicates whether the results of an analysis are likely due to chance or if they represent genuine relationships in the data. In simpler terms, it tells you if your findings are reliable enough to make inferences about a larger population.

Key Terms:

  1. p-value: The probability that the observed results occurred by chance. A p-value less than 0.05 is typically considered statistically significant.
  2. Null Hypothesis (H0): A statement that assumes no effect or no difference exists in the data.
  3. Alternative Hypothesis (H1): A statement that assumes an effect or difference exists.
  4. Alpha Level (α): The threshold set by researchers (commonly 0.05) to determine statistical significance.

Importance of Statistical Significance in SPSS

1. Validation of Findings

Statistical significance ensures that your results are not due to random chance, lending credibility to your research.

2. Decision-Making

It provides a basis for accepting or rejecting hypotheses, aiding in data-driven decisions.

3. Reproducibility

Significant results are more likely to be reproducible, strengthening the reliability of research.


Steps to Understand Statistical Significance in SPSS

Step 1: Input and Prepare Your Data

  • Open SPSS and load your dataset.
  • Clean your data by addressing missing values and errors.
  • Define variables appropriately (e.g., categorical or continuous).

Step 2: Choose the Right Test

The choice of statistical test depends on your research question and data type:

  • t-tests: Compare means between two groups.
  • ANOVA: Compare means across multiple groups.
  • Chi-Square Test: Assess relationships between categorical variables.
  • Correlation: Measure the strength of relationships between continuous variables.
  • Regression: Analyze the impact of one or more predictors on an outcome.

Step 3: Run the Analysis

  • Navigate to the appropriate menu in SPSS (e.g., Analyze > Compare Means > Independent-Samples T-Test).
  • Select your dependent and independent variables.
  • Specify test options and execute the analysis.

Step 4: Interpret the Outputs

  • Look for the p-value in the output table.
  • Compare the p-value to your alpha level (α = 0.05):
    • If p < α, reject the null hypothesis.
    • If p ≥ α, fail to reject the null hypothesis.

Step 5: Report Your Findings

  • Clearly state whether the results were statistically significant.
  • Include relevant metrics (e.g., mean differences, effect sizes) for context.

Statistical Significance in SPSS

Examples of Statistical Significance in SPSS

1. Independent-Samples T-Test

  • Scenario: Comparing test scores between male and female students.
  • Output: A p-value of 0.03 indicates a significant difference in scores.

2. Chi-Square Test

  • Scenario: Examining the relationship between gender and voting preference.
  • Output: A p-value of 0.01 suggests a significant association.

3. Correlation Analysis

  • Scenario: Assessing the relationship between study hours and exam scores.
  • Output: A p-value of 0.04 indicates a significant positive correlation.

Common Misconceptions About Statistical Significance

1. Statistical vs. Practical Significance

  • Statistical significance does not always imply practical relevance.
  • Example: A statistically significant difference in weight loss might only be 0.5 kg, which may not be meaningful in real life.

2. High Sample Size Bias

  • Large samples can produce statistically significant results even for trivial effects.

3. p-value Misinterpretation

  • A p-value of 0.05 does not mean there is a 95% chance the result is true. It reflects the probability of observing the results if the null hypothesis is true.

Tips for Beginners Using SPSS

1. Learn the Basics

  • Familiarize yourself with SPSS’s interface and functionalities through online tutorials.

2. Understand Your Data

  • Know the types of variables and their appropriate tests.

3. Practice Regularly

  • Use sample datasets to run different analyses and interpret outputs.

4. Consult Resources

  • Refer to books like “Discovering Statistics Using IBM SPSS Statistics” by Andy Field for in-depth understanding.

5. Seek Expert Help


Advanced Concepts Related to Statistical Significance

1. Effect Size

  • Measures the magnitude of the difference or relationship.
  • Common metrics include Cohen’s d, R-squared, and eta-squared.

2. Confidence Intervals

  • Provide a range of values within which the true effect is likely to lie.
  • Example: A 95% confidence interval of [2.5, 5.0] indicates high precision.

3. Multiple Comparisons

  • Adjust p-values using methods like Bonferroni correction to account for multiple tests.

Statistical Significance in SPSS

Benefits of Understanding Statistical Significance in SPSS

1. Improved Research Quality

  • Accurate interpretation of results enhances the validity of research.

2. Efficient Decision-Making

  • Informed decisions based on reliable data.

3. Enhanced Academic Performance

  • Clear and precise reporting of findings impresses evaluators.

4. Career Advancement

  • Proficiency in SPSS is a valuable skill for roles in data analysis, research, and academia.

Conclusion

Understanding Statistical Significance in SPSS: A Beginner’s Guide underscores the importance of mastering this critical concept. By following the steps and strategies outlined in this guide, students can confidently analyze data, interpret results, and produce high-quality research. With practice and the right resources, navigating statistical significance in SPSS becomes an achievable and rewarding skill.

Needs help with similar assignment?

We are available 24x7 to deliver the best services and assignment ready within 3-4 hours? Order a custom-written, plagiarism-free paper
Get Answer Over WhatsApp Order Paper Now

Tips for Interpreting SPSS Regression Results Like a Pro|2025

Discover essential tips for interpreting SPSS regression results. Learn how to understand coefficients, p-values, and R-squared values to draw accurate conclusions from your data analysis! Regression analysis is a cornerstone of statistical research, helping analysts understand relationships between variables and make predictions. SPSS (Statistical Package for the Social Sciences) is a popular software for running regression analyses due to its user-friendly interface and robust features. However, interpreting SPSS regression results effectively requires a clear understanding of statistical concepts and best practices. This guide offers expert tips for interpreting SPSS regression results like a pro, ensuring you extract meaningful insights from your data.

Tips for Interpreting SPSS Regression Results

Understanding Regression Analysis in SPSS

Regression analysis examines the relationship between dependent and independent variables. SPSS supports various types of regression, including:

  • Linear Regression: Models the relationship between a continuous dependent variable and one or more independent variables.
  • Logistic Regression: Used for binary or categorical dependent variables.
  • Multiple Regression: Explores the impact of multiple independent variables on a dependent variable.

Key Components of SPSS Regression Output

When you run a regression analysis in SPSS, the output includes several critical sections:

  1. Model Summary: Provides R-squared and adjusted R-squared values, indicating the model’s explanatory power.
  2. ANOVA Table: Tests the overall significance of the regression model.
  3. Coefficients Table: Displays the regression coefficients, standard errors, and significance values for each predictor.
  4. Residuals Statistics: Offers insights into the accuracy of the predictions and identifies potential outliers.

Step-by-Step Guide to Interpreting SPSS Regression Results

1. Check the Model Fit

The first step in interpreting regression results is to evaluate how well the model fits the data:

  1. R-Squared Value:
    • Found in the Model Summary table.
    • Indicates the proportion of variance in the dependent variable explained by the independent variables.
    • Values range from 0 to 1; higher values indicate better fit.
  2. Adjusted R-Squared:
    • Adjusts for the number of predictors in the model.
    • Useful for comparing models with different numbers of predictors.
  3. Standard Error of the Estimate:
    • Measures the average distance between observed and predicted values.
    • Smaller values indicate better fit.

2. Assess the Overall Model Significance

The ANOVA table provides a test of the overall significance of the regression model:

  • F-Test:
    • Evaluates whether the model explains a significant portion of variance in the dependent variable.
    • A significant p-value (< 0.05) indicates the model is statistically significant.

Tips for Interpreting SPSS Regression Results

3. Examine Regression Coefficients

The Coefficients table is the heart of regression analysis. Key components include:

  1. Unstandardized Coefficients (B):
    • Represent the change in the dependent variable for a one-unit change in the predictor, holding other variables constant.
    • Example: If B = 2.5 for a price variable, a $1 increase in price leads to a 2.5-unit change in sales.
  2. Standardized Coefficients (Beta):
    • Express the impact of predictors in standardized units, allowing for comparison across variables.
    • Useful for identifying the strongest predictors.
  3. Significance (p-value):
    • Tests whether the coefficient differs significantly from zero.
    • Predictors with p < 0.05 are considered significant.
  4. Confidence Intervals:
    • Provide a range within which the true coefficient value lies, with a specified level of confidence (usually 95%).

4. Evaluate Residuals

Residuals represent the differences between observed and predicted values. Analyzing residuals helps identify:

  • Outliers: Cases with large residuals that may distort the model.
  • Heteroscedasticity: Unequal variance in residuals across levels of the predictor variable.

Use residual plots (Graphs > Legacy Dialogs > Scatter/Dot) to visualize patterns and check assumptions.

5. Test for Multicollinearity

Multicollinearity occurs when independent variables are highly correlated, potentially biasing coefficient estimates. Check:

  • Variance Inflation Factor (VIF):
    • Found in the Coefficients table if requested (Statistics > Collinearity Diagnostics).
    • VIF > 10 indicates problematic multicollinearity.
  • Tolerance:
    • Inverse of VIF; values < 0.1 suggest multicollinearity.

6. Interpret Logistic Regression Results

For logistic regression, SPSS provides additional outputs:

  • Odds Ratios (Exp(B)):
    • Represent the change in odds of the dependent event occurring for a one-unit change in the predictor.
    • Example: Exp(B) = 1.5 indicates a 50% increase in odds per unit increase in the predictor.
  • Classification Table:
    • Displays the accuracy of the model’s predictions.
  • Pseudo R-Squared Values:
    • Includes Cox & Snell and Nagelkerke values, which approximate model fit.

Tips for Interpreting SPSS Regression Results

Common Challenges and Solutions

1. Non-Significant Predictors

  • Challenge: Some predictors may not significantly impact the dependent variable.
  • Solution: Consider removing non-significant variables or exploring interactions.

2. Overfitting

  • Challenge: Including too many predictors can lead to overfitting.
  • Solution: Use stepwise regression or cross-validation to simplify the model.

3. Violated Assumptions

  • Challenge: Regression assumes linearity, normality, and homoscedasticity.
  • Solution: Transform variables or use non-parametric methods if assumptions are violated.

Tips for Professional-Level Interpretation

  1. Contextualize Results:
    • Relate findings to the research question and domain knowledge.
    • Example: Highlight practical implications for business or policy.
  2. Use Visuals:
    • Enhance interpretation with scatterplots, histograms, and line graphs.
    • SPSS’s Chart Builder makes it easy to create professional visuals.
  3. Report Effect Sizes:
    • Include effect sizes (e.g., R-squared, standardized coefficients) to convey the magnitude of relationships.
  4. Validate the Model:
    • Split the dataset into training and testing sets (Data > Select Cases) to test model generalizability.

Tips for Interpreting SPSS Regression Results

Applications of SPSS Regression Analysis

SPSS regression is widely used in various fields:

  • Business: Forecasting sales, analyzing customer satisfaction.
  • Healthcare: Predicting patient outcomes, evaluating treatment efficacy.
  • Education: Examining factors influencing academic performance.
  • Social Sciences: Investigating relationships between demographic and behavioral variables.

Learning Resources for SPSS Regression

  1. IBM SPSS Tutorials: Access official guides and examples.
  2. Books: Reference texts like Discovering Statistics Using SPSS by Andy Field.
  3. Online Courses: Platforms like Coursera and LinkedIn Learning offer SPSS training.
  4. Community Forums: Engage with users on ResearchGate, Stack Overflow, and SPSS user groups.

Conclusion

Interpreting SPSS regression results like a pro requires attention to detail, a solid understanding of statistical principles, and a clear focus on research objectives. By following this guide, you can effectively evaluate model fit, analyze coefficients, and draw meaningful conclusions from your regression analysis. Practice these tips, leverage available resources, and continue honing your skills to excel in your data analysis endeavors.

Getspsshelp.com is the best website for tips on interpreting SPSS regression results because it offers expert advice tailored to both beginners and advanced users. The platform provides clear, step-by-step instructions to help students understand key regression metrics like coefficients, p-values, and R-squared values. With personalized support from experienced professionals, getspsshelp.com ensures users can accurately interpret their results and apply them to real-world scenarios. The website also covers common pitfalls and mistakes, helping students avoid errors and gain confidence in their analysis. Whether you’re preparing for an assignment or a research project, getspsshelp.com equips you with the knowledge to interpret SPSS regression results like a pro.

Needs help with similar assignment?

We are available 24x7 to deliver the best services and assignment ready within 3-4 hours? Order a custom-written, plagiarism-free paper

Get Answer Over WhatsApp Order Paper Now

Exploring the Role of SPSS in Dissertation and Thesis Writing|2025

Exploring the Role of SPSS in Dissertation and Thesis Writing highlights how this powerful tool simplifies data analysis, enhances research accuracy, and supports meaningful academic conclusions. Statistical analysis plays a pivotal role in academic research, particularly in dissertations and theses. Among the various tools available, SPSS (Statistical Package for the Social Sciences) stands out for its efficiency, user-friendliness, and versatility. For students aiming to produce high-quality dissertations or theses, mastering SPSS is not just a recommendation but often a necessity.

This guide delves into the role of SPSS in dissertation and thesis writing, outlining its significance, the challenges faced by students, and the strategies for effectively utilizing this tool. With its robust capabilities, SPSS can transform complex data into meaningful insights, thereby enhancing the credibility and impact of academic research.


Exploring the Role of SPSS in Dissertation and Thesis Writing

Importance of SPSS in Academic Research

1. Comprehensive Data Handling

SPSS allows students to manage and analyze large datasets with ease. Its features include:

  • Data cleaning and transformation.
  • Handling missing data.
  • Integration with other tools like Excel and CSV files.

2. Advanced Statistical Analysis

The software provides tools for a wide range of statistical methods, including:

  • Descriptive statistics (mean, median, mode).
  • Inferential statistics (t-tests, ANOVA, regression analysis).
  • Non-parametric tests (chi-square tests, Kruskal-Wallis tests).

3. Visualization of Results

SPSS enables the creation of charts, graphs, and tables, making data interpretation and presentation more accessible and visually appealing.

4. Time Efficiency

With SPSS, students can perform complex calculations and generate reports in a fraction of the time it would take using manual methods.

5. Credibility and Accuracy

By using a standardized tool like SPSS, students ensure the reliability and validity of their statistical analyses, which is crucial for academic rigor.


Role of SPSS in Dissertation and Thesis Writing

1. Formulating Research Questions

SPSS helps in operationalizing research questions by:

  • Identifying measurable variables.
  • Structuring hypotheses for testing.

2. Data Collection and Management

  • Importing survey data from tools like Google Forms.
  • Organizing variables and coding data for analysis.

3. Statistical Testing

Students can use SPSS to conduct:

  • Hypothesis testing (e.g., null vs. alternative hypotheses).
  • Correlation and regression analyses to explore relationships between variables.
  • Comparative analyses like ANOVA to assess group differences.

4. Interpreting Results

SPSS outputs provide detailed tables and graphs that:

  • Summarize key findings.
  • Highlight statistical significance and effect sizes.

5. Writing the Results Section

SPSS aids in structuring the results section of dissertations by:

  • Offering clear and concise data summaries.
  • Providing graphical representations that align with research objectives.

6. Validation and Reliability Testing

  • Ensuring the robustness of measurement tools through reliability tests like Cronbach’s alpha.
  • Validating scales and models with confirmatory factor analysis (CFA).

Exploring the Role of SPSS in Dissertation and Thesis Writing

Challenges in Using SPSS for Academic Writing

Despite its advantages, students often face several challenges when using SPSS:

1. Understanding Statistical Concepts

  • Lack of clarity on which tests to use for specific research questions.

2. Data Preparation

  • Errors in coding and variable definition can lead to inaccurate analyses.

3. Interpreting Outputs

  • SPSS outputs can be overwhelming for beginners, making it difficult to extract meaningful insights.

4. Time Management

  • Balancing SPSS tasks with other aspects of dissertation writing can be challenging.

5. Technical Issues

  • Software glitches and compatibility issues with datasets can disrupt workflow.

Strategies for Effectively Using SPSS in Dissertations and Theses

To maximize the benefits of SPSS, students should adopt the following strategies:

1. Plan Ahead

  • Clearly define research objectives and align them with statistical methods.

2. Learn the Basics

  • Familiarize yourself with SPSS’s interface, functions, and syntax commands through tutorials and guides.

3. Use Reliable Data Sources

  • Ensure that datasets are accurate, complete, and formatted correctly for analysis.

4. Seek Expert Guidance

  • Collaborate with advisors, peers, or professional SPSS tutors to address complex analyses.

5. Practice Regularly

  • Use sample datasets to practice running different statistical tests and interpreting results.

6. Document Your Process

  • Keep a detailed record of steps taken in SPSS to ensure reproducibility and transparency.

Step-by-Step Guide to Using SPSS for Academic Research

Step 1: Understand Your Dataset

  • Identify the variables, their types, and relationships.
  • Check for missing values and outliers.

Step 2: Choose the Right Statistical Tests

  • Match tests to your research questions and data type. For example:
    • Use t-tests for comparing two groups.
    • Apply regression analysis for predicting outcomes.

Step 3: Run Analyses in SPSS

  • Navigate to the appropriate menu (e.g., Analyze > Descriptive Statistics).
  • Input variables and specify test parameters.

Step 4: Interpret Outputs

  • Focus on key metrics like p-values, R-squared values, and effect sizes.

Step 5: Visualize Results

  • Create charts and graphs to illustrate findings clearly.

Step 6: Integrate Findings into Your Paper

  • Write a detailed results section that ties statistical outcomes to your research questions.

Exploring the Role of SPSS in Dissertation and Thesis Writing

Resources for Learning SPSS

1. Books

  • “Discovering Statistics Using IBM SPSS Statistics” by Andy Field.
  • “SPSS Survival Manual” by Julie Pallant.

2. Online Tutorials

  • Coursera and Udemy courses.
  • YouTube channels like Research By Design.

3. University Resources

  • Access university-provided SPSS training workshops or software licenses.

4. Professional Help

  • Engage professional SPSS assignment help services for personalized guidance.

Common Applications of SPSS in Dissertations

1. Survey Research

  • Analyzing survey responses to identify patterns and trends.

2. Experimental Studies

  • Testing hypotheses with controlled experiments.

3. Secondary Data Analysis

  • Exploring existing datasets to answer new research questions.

4. Mixed-Methods Research

  • Integrating quantitative and qualitative data for comprehensive analysis.

Conclusion

Exploring the Role of SPSS in Dissertation and Thesis Writing reveals its transformative impact on academic research. By simplifying data analysis, enhancing result interpretation, and ensuring statistical accuracy, SPSS empowers students to produce rigorous and impactful dissertations. While challenges exist, leveraging the right strategies and resources can make SPSS a valuable ally in the academic journey. With practice and support, students can harness SPSS to unlock new dimensions of research excellence.


Needs help with similar assignment?

We are available 24x7 to deliver the best services and assignment ready within 3-4 hours? Order a custom-written, plagiarism-free paper

Get Answer Over WhatsApp Order Paper Now

How to Use SPSS for Market Research Assignments|2025

Learn how to use SPSS for market research assignments with this step-by-step guide. Master data analysis techniques to uncover insights and excel in your projects! Market research is a critical process for understanding consumer behavior, identifying trends, and making informed business decisions. SPSS (Statistical Package for the Social Sciences) is a versatile software tool that simplifies data analysis for market research assignments. Whether you’re a student working on a project or a professional aiming to derive actionable insights, mastering SPSS can significantly enhance your analytical capabilities. This comprehensive guide explores how to use SPSS effectively for market research assignments.

How to Use SPSS for Market Research Assignments

Why Use SPSS for Market Research?

SPSS is a preferred tool for market researchers because it offers:

  • User-Friendly Interface: Intuitive menus and dialog boxes make it accessible even for beginners.
  • Comprehensive Analytical Tools: Includes descriptive statistics, regression analysis, and advanced modeling techniques.
  • Data Visualization: Generates charts and graphs for easy interpretation.
  • Integration with Survey Tools: Compatible with survey platforms like Qualtrics and Google Forms.

Steps to Use SPSS for Market Research Assignments

1. Define the Research Objectives

Before diving into SPSS, clearly outline your research goals. Common objectives include:

  • Understanding consumer preferences.
  • Identifying market segments.
  • Evaluating the effectiveness of marketing campaigns.

Defining objectives helps determine the type of data to collect and the appropriate analysis techniques to use in SPSS.

2. Collect and Prepare Data

Market research often involves surveys, focus groups, or transactional data. Follow these steps to prepare your data:

  1. Design the Survey:
    • Use platforms like Qualtrics, SurveyMonkey, or Google Forms to collect data.
    • Ensure the survey includes well-structured questions relevant to your objectives.
  2. Export Data to SPSS:
    • Export your survey responses in SPSS-compatible formats (e.g., .sav, .csv).
    • Open the file in SPSS by selecting File > Open > Data.
  3. Clean the Data:
    • Remove duplicates and handle missing values.
    • Recode variables where necessary (e.g., 1 = Male, 2 = Female).

3. Explore the Data

Data exploration involves summarizing and visualizing your dataset to identify patterns and anomalies. Use the following SPSS features:

  1. Descriptive Statistics:
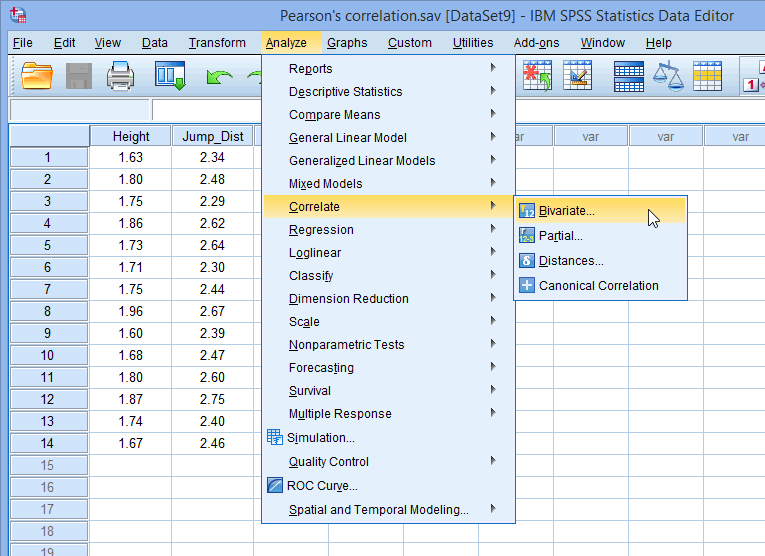
    • Go to Analyze > Descriptive Statistics > Frequencies to compute counts and percentages.
    • Use Descriptives for measures like mean, median, and standard deviation.
  2. Charts and Graphs:
    • Create bar charts, pie charts, or histograms using Graphs > Chart Builder.
    • Visualize relationships between variables with scatterplots.

4. Perform Data Analysis

SPSS provides a range of tools for analyzing market research data. Here are some common techniques:

  1. Cross-Tabulation:
    • Use Analyze > Descriptive Statistics > Crosstabs to explore relationships between categorical variables.
    • Example: Analyze the association between age group and product preference.
  2. Regression Analysis:
    • Use Analyze > Regression > Linear to predict outcomes based on independent variables.
    • Example: Predict customer satisfaction based on price, quality, and service.
  3. Cluster Analysis:
    • Use Analyze > Classify > K-Means Cluster to identify market segments.
    • Example: Group customers based on purchasing behavior.
  4. Factor Analysis:
    • Use Analyze > Dimension Reduction > Factor to uncover latent variables.
    • Example: Combine survey items into overarching constructs like brand loyalty.

5. Interpret Results

Effective interpretation is critical for drawing meaningful conclusions from your analysis. Consider the following tips:

  • Focus on significant findings: Highlight results with strong statistical significance (e.g., p < 0.05).
  • Relate findings to research objectives: Ensure your interpretation aligns with the initial goals.
  • Use visuals: Include charts, tables, and graphs to make your findings accessible.

6. Create a Report

Summarize your findings in a structured report. Key sections include:

  • Introduction: Outline the research objectives and methodology.
  • Data Analysis: Present key findings with supporting visuals.
  • Conclusions and Recommendations: Provide actionable insights based on the analysis.

How to Use SPSS for Market Research Assignments

Advanced SPSS Techniques for Market Research

1. Conjoint Analysis

Conjoint analysis helps determine how consumers value different product features. Steps include:

  • Design a choice-based survey.
  • Use Analyze > Regression > Linear to analyze the importance of each attribute.
  • Example: Determine the ideal price and feature combination for a new product.

2. Sentiment Analysis

Analyze open-ended survey responses or social media data to gauge sentiment. Steps include:

  • Import text data into SPSS.
  • Use text analytics tools or integrate SPSS with external software like Python.
  • Example: Measure customer sentiment towards a recent campaign.

3. Predictive Analytics

Use predictive modeling to forecast future trends or behaviors. Techniques include:

  • Decision trees (Analyze > Classify > Tree).
  • Logistic regression (Analyze > Regression > Binary Logistic).
  • Example: Predict the likelihood of customer churn.

Best Practices for Using SPSS in Market Research

  1. Understand Your Audience:
    • Tailor your analysis to meet the needs of stakeholders.
    • Use simple visuals for non-technical audiences.
  2. Validate Your Data:
    • Perform reliability tests (e.g., Cronbach’s alpha) to ensure consistent survey responses.
    • Cross-check findings with external data sources.
  3. Automate Repetitive Tasks:
    • Use SPSS syntax to automate routine analyses.
    • Example: Automate data cleaning with scripts.
  4. Stay Ethical:
    • Ensure data privacy and adhere to ethical guidelines.
    • Avoid manipulating data to fit preconceived narratives.

Common Challenges and Solutions

1. Handling Missing Data

  • Challenge: Missing responses can skew analysis.
  • Solution: Use imputation methods (Transform > Replace Missing Values) or exclude cases.

2. Interpreting Complex Outputs

  • Challenge: Large datasets can generate overwhelming results.
  • Solution: Focus on key metrics and use visuals to simplify.

3. Managing Large Datasets

  • Challenge: Slow performance with extensive data.
  • Solution: Use SPSS’s Split File or Select Cases options to analyze subsets.

How to Use SPSS for Market Research Assignments

Applications of SPSS in Market Research

SPSS is widely used in:

  • Consumer Behavior Analysis: Understanding preferences, loyalty, and purchasing habits.
  • Brand Perception Studies: Measuring brand equity and reputation.
  • Product Testing: Evaluating consumer response to new products.
  • Advertising Effectiveness: Assessing the impact of campaigns.

Learning Resources for SPSS

  1. Official IBM SPSS Tutorials: Comprehensive guides and documentation.
  2. Online Courses: Platforms like Coursera and Udemy offer SPSS training.
  3. Books: Reference texts such as SPSS Survival Manual by Julie Pallant.
  4. Community Forums: Engage with users on forums like ResearchGate and Stack Overflow.

Conclusion

SPSS is a powerful tool for conducting market research assignments, offering a wide array of features for data analysis and visualization. By following this guide, you can effectively prepare your data, perform robust analyses, and derive actionable insights. Practice regularly, leverage available resources, and adhere to best practices to maximize the potential of SPSS in your market research endeavors.

getspsshelp.com is your premier assignment help services.

Needs help with similar assignment?

We are available 24x7 to deliver the best services and assignment ready within 3-4 hours? Order a custom-written, plagiarism-free paper
Get Answer Over WhatsApp Order Paper Now

Solving SPSS Assignments for Social Science Students|2025

Solving SPSS assignments for social science students involves applying statistical methods to analyze complex data, helping students gain valuable insights for their research projects. SPSS (Statistical Package for the Social Sciences) is a powerful statistical software tool widely used in social science research. Its ability to handle complex datasets, perform advanced statistical analyses, and present results visually makes it indispensable for social science students. Whether analyzing survey data, performing hypothesis testing, or creating detailed reports, mastering SPSS can significantly enhance students’ academic and professional prospects.

In this guide, we’ll explore the importance of SPSS in social science education, common challenges students face, and practical strategies for solving SPSS assignments effectively. We’ll also highlight essential tips and resources to help students succeed in their SPSS-related tasks.


Solving SPSS Assignments for Social Science Students

Importance of SPSS for Social Science Students

1. Comprehensive Data Analysis

SPSS allows social science students to perform a wide range of statistical analyses, such as:

  • Descriptive statistics (mean, median, standard deviation).
  • Inferential statistics (t-tests, ANOVA, regression).
  • Non-parametric tests (chi-square, Mann-Whitney U).

2. Simplified Data Management

The software provides robust tools for importing, cleaning, and organizing datasets, enabling students to focus on analysis rather than manual data handling.

3. Visualization and Reporting

SPSS helps students create detailed charts, graphs, and tables, making it easier to communicate findings effectively in assignments and research papers.

4. Real-World Applications

Skills in SPSS prepare students for careers in academia, market research, public policy, and various other fields where data analysis is crucial.


Challenges in Solving SPSS Assignments

Despite its benefits, many students encounter difficulties while working on SPSS assignments. Common challenges include:

1. Understanding Statistical Concepts

  • Students may struggle to choose appropriate tests or interpret results correctly.

2. Data Preparation

  • Cleaning and transforming raw data can be time-consuming and confusing for beginners.

3. SPSS Interface Familiarity

  • Navigating the SPSS interface and using its features effectively require practice and guidance.

4. Time Constraints

  • Managing complex assignments alongside other coursework can be overwhelming.

5. Technical Issues

  • Errors in coding, syntax, or data input can lead to incorrect results.

Solving SPSS Assignments for Social Science Students

Strategies for Solving SPSS Assignments Effectively

To overcome these challenges and excel in SPSS assignments, students can adopt the following strategies:

1. Understand the Assignment Requirements

  • Read the instructions carefully to identify the objectives, datasets, and statistical tests required.

2. Familiarize Yourself with SPSS

  • Explore the software’s menus, tools, and features to build confidence in using SPSS.
  • Practice importing data, creating variables, and running basic analyses.

3. Break Down the Task

  • Divide the assignment into smaller steps, such as:
    1. Data preparation.
    2. Choosing the appropriate statistical test.
    3. Running the analysis.
    4. Interpreting results.
    5. Presenting findings.

4. Leverage Syntax Commands

  • Use SPSS syntax for advanced customization and to document your analysis steps for future reference.

5. Seek Resources and Guidance

  • Utilize online tutorials, textbooks, and academic support services for help with specific SPSS tasks.

Step-by-Step Guide to Solving SPSS Assignments

Here is a structured approach to solving SPSS assignments for social science students:

Step 1: Understand the Dataset

  • Familiarize yourself with the variables and their types (e.g., nominal, ordinal, scale).
  • Check for missing or inconsistent data and clean the dataset as needed.

Step 2: Define Your Objectives

  • Determine the research question or hypothesis you aim to address.
  • Example: “Does socioeconomic status influence academic performance?”

Step 3: Choose the Right Statistical Test

  • Match the test to your data and objectives:
    • Use t-tests for comparing means between two groups.
    • Apply ANOVA for comparing means across multiple groups.
    • Employ chi-square tests for categorical data relationships.

Step 4: Run the Analysis in SPSS

  • Navigate to the appropriate menu (e.g., Analyze > Compare Means).
  • Input variables and specify parameters.
  • Review the output for key statistics (e.g., p-values, effect sizes).

Step 5: Interpret Results

  • Summarize findings in plain language, linking them to your research question.
  • Example: “The t-test revealed a significant difference in test scores between urban and rural students (p < 0.05).”

Step 6: Present Findings

  • Create visual aids (e.g., bar graphs, pie charts) to enhance your report.
  • Ensure clarity and professionalism in your presentation.

Solving SPSS Assignments for Social Science Students

Tips for Excelling in SPSS Assignments

  1. Practice Regularly:
    • Consistent practice is key to mastering SPSS.
  2. Use Online Tutorials:
    • Platforms like YouTube, Coursera, and Udemy offer free and paid SPSS tutorials.
  3. Join Study Groups:
    • Collaborate with peers to exchange knowledge and troubleshoot challenges.
  4. Consult Professors and Mentors:
    • Seek guidance from instructors for complex analyses or theoretical doubts.
  5. Refer to Academic Journals:
    • Study published research papers to understand how SPSS is applied in social science studies.
  6. Utilize SPSS Help Communities:
    • Engage with forums like IBM’s SPSS Community, ResearchGate, or Reddit for expert advice.

Common SPSS Assignments for Social Science Students

1. Survey Data Analysis

  • Analyze survey responses to identify trends and correlations.
  • Example: Examining the relationship between social media usage and mental health.

2. Experimental Research

  • Test hypotheses using experimental data.
  • Example: Assessing the impact of a new teaching method on student performance.

3. Case Studies

  • Perform descriptive statistics to summarize case study data.
  • Example: Analyzing demographic profiles of a target population.

4. Predictive Modeling

  • Use regression analysis to predict outcomes.
  • Example: Forecasting job satisfaction based on workplace factors.

5. Policy Analysis

  • Evaluate the effectiveness of policies using inferential statistics.
  • Example: Measuring the impact of a minimum wage increase on employment rates.

Solving SPSS Assignments for Social Science Students

Resources for Solving SPSS Assignments

1. Books:

  • “SPSS Survival Manual” by Julie Pallant.
  • “Discovering Statistics Using IBM SPSS Statistics” by Andy Field.

2. Online Courses:

  • Coursera: “Introduction to SPSS” by Wesleyan University.
  • Udemy: “SPSS for Beginners”.

3. YouTube Channels:

  • Statistics How To.
  • Research By Design.

4. Software Documentation:

  • IBM’s official SPSS user guides and tutorials.

5. Academic Support Services:

  • University writing centers and tutoring programs often provide SPSS assistance.

Conclusion

Solving SPSS Assignments for Social Science Students requires a combination of statistical knowledge, technical skills, and strategic planning. By mastering SPSS, students can enhance their research capabilities, improve their academic performance, and prepare for data-driven careers. Leveraging resources like tutorials, books, and professional help can make the process more manageable and rewarding. Ultimately, proficiency in SPSS is a valuable asset that empowers social science students to excel in their academic and professional journeys.

Getspsshelp.com is the best website for solving SPSS assignments for social science students because it offers specialized support tailored to the unique data analysis needs of this field. The platform’s team of experts provides clear and detailed guidance on applying SPSS to social science research, ensuring students can effectively analyze complex datasets. With personalized assistance, getspsshelp.com helps students interpret results, generate meaningful insights, and present their findings accurately. The website also provides tips on how to handle various statistical techniques commonly used in social science research, such as regression analysis and factor analysis. Whether you are a beginner or advanced student, getspsshelp.com equips you with the knowledge and tools to excel in your SPSS assignments.

Needs help with similar assignment?

We are available 24x7 to deliver the best services and assignment ready within 3-4 hours? Order a custom-written, plagiarism-free paper

Get Answer Over WhatsApp Order Paper Now

How to Conduct Factor Analysis in SPSS|2025

Learn how to conduct factor analysis in SPSS with this comprehensive guide. Discover the steps to identify underlying variables, interpret results, and enhance your data analysis skills! Factor analysis is a statistical method used to uncover the underlying relationships between variables by identifying groups or clusters known as factors. SPSS (Statistical Package for the Social Sciences) provides a straightforward way to perform factor analysis, making it an invaluable tool for researchers in fields like psychology, sociology, and marketing. This guide walks you through the step-by-step process of conducting factor analysis in SPSS, ensuring clarity and accuracy in your analysis.

How to Conduct Factor Analysis in SPSS

What is Factor Analysis?

Factor analysis is used to:

  • Reduce Dimensionality: Simplify large datasets by combining correlated variables into factors.
  • Identify Underlying Constructs: Detect hidden patterns or structures within a dataset.
  • Improve Data Interpretation: Make complex data more understandable and manageable.

There are two main types of factor analysis:

  1. Exploratory Factor Analysis (EFA): Used when you do not have prior assumptions about the structure of the data.
  2. Confirmatory Factor Analysis (CFA): Used to test hypotheses or confirm a predetermined factor structure.

This guide focuses on EFA, which is more commonly conducted in SPSS.

Step-by-Step Guide to Conducting Factor Analysis in SPSS

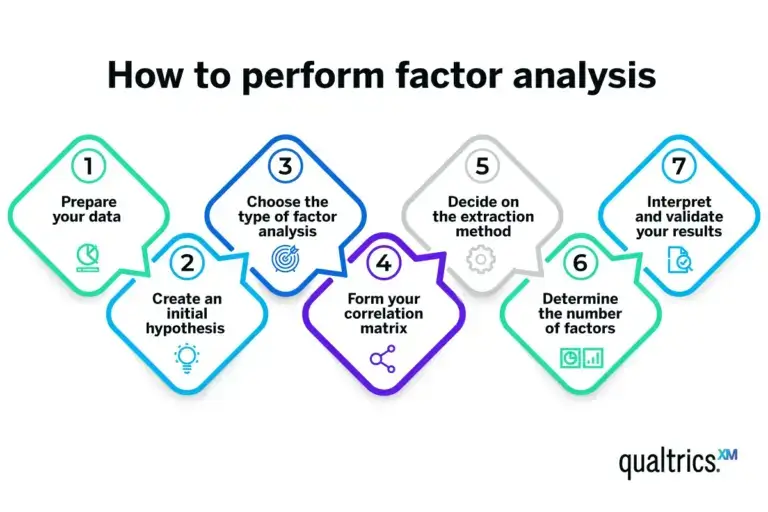
1. Prepare Your Data

Before performing factor analysis, ensure your data is suitable:

  • Sufficient Sample Size: Aim for at least 10 observations per variable.
  • Normality: Check if your data is approximately normally distributed.
  • No Multicollinearity: Ensure variables are not excessively correlated (check correlations below 0.9).

2. Load Your Data into SPSS

  1. Open SPSS and import your dataset.
  2. Go to File > Open > Data and select your file.
  3. Ensure all variables intended for factor analysis are included and appropriately coded.

3. Check Assumptions for Factor Analysis

  1. Kaiser-Meyer-Olkin (KMO) Measure:
    • Measures sampling adequacy. Values above 0.6 indicate that factor analysis is appropriate.
  2. Bartlett’s Test of Sphericity:
    • Tests if your variables are correlated. A significant p-value (< 0.05) confirms suitability for factor analysis.

To run these tests:

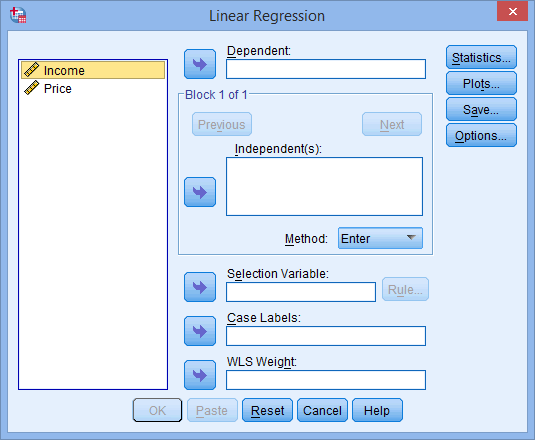
  • Go to Analyze > Dimension Reduction > Factor.
  • Move your variables to the “Variables” box.
  • Click “Descriptives” and select “KMO and Bartlett’s test.”

4. Choose the Extraction Method

The extraction method determines how factors are derived. The most commonly used methods include:

  • Principal Component Analysis (PCA): Extracts maximum variance and is useful for data reduction.
  • Principal Axis Factoring (PAF): Suitable when the focus is on uncovering latent constructs.

In SPSS:

  • Go to Analyze > Dimension Reduction > Factor.
  • Under “Extraction,” select your desired method (e.g., PCA).
  • Specify the number of factors to extract or let SPSS determine this automatically based on eigenvalues (>1).

How to Conduct Factor Analysis in SPSS

5. Determine the Number of Factors

The number of factors to retain can be determined using:

  • Eigenvalues: Retain factors with eigenvalues greater than 1.
  • Scree Plot: Look for the “elbow” point where eigenvalues level off.
  • Parallel Analysis: Compare eigenvalues with randomly generated data.

In SPSS:

  • Check “Scree plot” in the “Extraction” window.
  • Review the results in the output file.

6. Perform Factor Rotation

Rotation simplifies the interpretation of factors by maximizing high loadings and minimizing low ones. Common rotation methods include:

  • Varimax (Orthogonal): Produces uncorrelated factors.
  • Oblimin (Oblique): Allows factors to be correlated.

To apply rotation in SPSS:

  • Click “Rotation” in the Factor Analysis dialog box.
  • Choose your desired method (e.g., Varimax).

7. Interpret the Factor Loadings

Factor loadings indicate the relationship between variables and factors:

  • Values > 0.4 are typically considered significant.
  • Review the rotated component matrix for clear groupings.

If necessary, suppress small coefficients to simplify interpretation:

  • Go to “Options” and set a loading threshold (e.g., 0.4).

8. Save Factor Scores

Factor scores are new variables representing each case’s score on the extracted factors. To save these:

  • Check “Save as variables” in the Factor Analysis dialog box.
  • SPSS will create new columns in the dataset for the factor scores.

Best Practices for Factor Analysis

  1. Understand Your Variables:
    • Ensure your variables are conceptually related.
    • Avoid including irrelevant or redundant variables.
  2. Validate Your Results:
    • Replicate the analysis on a different dataset.
    • Use reliability analysis (e.g., Cronbach’s alpha) to assess the consistency of factors.
  3. Document Your Process:
    • Record all decisions, including extraction methods, rotation types, and number of factors retained.

Example: Factor Analysis in SPSS

Scenario

A researcher collects data on customer satisfaction using a survey with the following variables:

  • Quality of Service
  • Pricing
  • Staff Behavior
  • Ambiance
  • Product Variety

Steps

  1. Check Assumptions:
    • Run KMO and Bartlett’s tests.
    • Ensure the dataset meets sampling adequacy and correlation criteria.
  2. Perform Factor Analysis:
    • Use PCA as the extraction method.
    • Retain factors with eigenvalues > 1.
  3. Interpret Results:
    • Review the rotated component matrix.
    • Identify patterns, such as “Service Quality” and “Product Variety” forming separate factors.
  4. Save Factor Scores:
    • Use these scores for further analysis, such as regression or cluster analysis.

How to Conduct Factor Analysis in SPSS

Common Challenges and Solutions

  1. Low KMO Values:
    • Remove variables with low communalities (< 0.3).
    • Increase the sample size.
  2. Complex Factor Structures:
    • Use oblique rotation to account for correlated factors.
    • Reevaluate the number of factors retained.
  3. Difficulty Interpreting Factors:
    • Review variable definitions and context.
    • Consult domain experts for insights.

Applications of Factor Analysis

Factor analysis is widely used in various fields:

  • Psychology: Identifying underlying traits in personality tests.
  • Education: Analyzing student performance across subjects.
  • Marketing: Grouping customer preferences or behaviors.
  • Healthcare: Understanding patient satisfaction or symptoms clustering.

Conclusion

Factor analysis in SPSS is a powerful tool for uncovering hidden patterns and reducing data complexity. By following this step-by-step guide, you can confidently conduct factor analysis, interpret results, and apply findings to your research or projects. Practice regularly, validate your results, and stay informed about best practices to enhance your skills and outcomes. Getspsshelp.com offers expert assistance for students and professionals with factor analysis in SPSS, ensuring accurate data interpretation and reliable results. Whether you’re working on a research project or an academic assignment, their support helps simplify complex statistical concepts and improve your analysis efficiency.

Needs help with similar assignment?

We are available 24x7 to deliver the best services and assignment ready within 3-4 hours? Order a custom-written, plagiarism-free paper
Get Answer Over WhatsApp Order Paper Now

The Importance of SPSS in Academic Research: How Students Benefit|2025

Academic research has evolved significantly over the past few decades, becoming increasingly reliant on data analysis to uncover patterns, validate hypotheses, and derive meaningful conclusions. Among the many tools available for statistical analysis, SPSS (Statistical Package for the Social Sciences) stands out as a preferred choice for students and researchers alike. Its intuitive interface, comprehensive features, and versatility make it indispensable in academic research.

This article delves into the importance of SPSS in academic research and explores how students benefit from mastering this powerful software.


The Importance of SPSS in Academic Research

Understanding SPSS and Its Role in Academic Research

SPSS is a statistical software package designed for data management, statistical analysis, and graphical representation. Developed initially for social science researchers, it is now widely used across disciplines, including education, health sciences, business, and engineering.

Key Features of SPSS:

  1. Data Management:
    • Efficiently handle and manipulate large datasets.
    • Perform data cleaning and transformation.
  2. Statistical Analysis:
    • Conduct a wide range of statistical tests, including t-tests, ANOVA, regression, and chi-square tests.
  3. Visualization:
    • Create detailed charts, graphs, and tables to represent data visually.
  4. Predictive Analytics:
    • Build predictive models using machine learning techniques.
  5. User-Friendly Interface:
    • Intuitive interface suitable for beginners and advanced users.

The Importance of SPSS in Academic Research

SPSS simplifies complex statistical analysis, enabling students and researchers to focus on interpreting results rather than grappling with computational challenges. Below are key reasons why SPSS is integral to academic research:

1. Versatility Across Disciplines:

  • SPSS supports diverse fields, from sociology and psychology to marketing and medicine. This versatility makes it a universal tool in academia.

2. Accuracy and Reliability:

  • The software’s robust algorithms ensure precise calculations, reducing the likelihood of errors in statistical analyses.

3. Enhanced Research Quality:

  • By facilitating detailed and comprehensive analysis, SPSS elevates the quality and credibility of research findings.

4. Time Efficiency:

  • Automating repetitive tasks saves researchers valuable time, allowing them to focus on data interpretation and report writing.

5. Educational Accessibility:

  • Many universities provide students with access to SPSS, making it readily available for academic purposes.

The Importance of SPSS in Academic Research

How Students Benefit from SPSS

1. Improved Understanding of Data:

  • SPSS enables students to delve deeper into their data, uncovering insights that might otherwise go unnoticed.
  • Example: In a psychology study, students can analyze survey responses to identify correlations between variables.

2. Enhanced Academic Performance:

  • Mastery of SPSS often leads to better grades in research projects, dissertations, and assignments.

3. Skill Development:

  • Proficiency in SPSS is a valuable skill that enhances employability, especially in data-driven industries.
  • Popular careers include data analyst, market researcher, and healthcare statistician.

4. Simplified Research Process:

  • SPSS streamlines the research process, from data entry to result interpretation, making it less daunting for students.

5. Collaboration Opportunities:

  • Students proficient in SPSS often collaborate with peers and faculty on research projects, fostering teamwork and networking.

Key Applications of SPSS in Academic Research

1. Survey Analysis:

  • SPSS helps students analyze survey data to understand trends, opinions, and behaviors.
  • Techniques: Descriptive statistics, cross-tabulation, and factor analysis.

2. Experimental Studies:

  • Conduct hypothesis testing to validate experimental results.
  • Techniques: T-tests, ANOVA, and regression analysis.

3. Thesis and Dissertation Research:

  • SPSS is widely used in theses and dissertations to handle complex datasets and produce robust results.

4. Case Studies and Reports:

  • Students use SPSS to analyze real-world data for case studies, enhancing the practical relevance of their research.

5. Predictive Modeling:

  • Build models to forecast outcomes, such as predicting student performance or consumer behavior.

The Importance of SPSS in Academic Research

Challenges Students Face with SPSS and How to Overcome Them

Despite its advantages, students may encounter challenges when using SPSS. Here’s how to address these common issues:

1. Lack of Familiarity:

  • Solution: Take online tutorials or attend workshops to learn SPSS basics.

2. Complex Data Cleaning:

  • Solution: Break down the cleaning process into smaller steps and use SPSS’s automated tools.

3. Misinterpretation of Results:

  • Solution: Refer to guides and textbooks to understand statistical concepts better.

4. Time Constraints:

  • Solution: Plan assignments well in advance and allocate dedicated time for SPSS analysis.

5. Technical Issues:

  • Solution: Seek help from university IT support or SPSS online communities.

Tips for Using SPSS Effectively in Academic Research

  1. Understand Your Data:
    • Familiarize yourself with the dataset before performing any analysis.
  2. Choose Appropriate Tests:
    • Select statistical tests that align with your research objectives and data type.
  3. Use Syntax Commands:
    • Learn SPSS syntax for advanced customization and automation.
  4. Leverage Visualization Tools:
    • Use SPSS’s chart and graph tools to present data effectively.
  5. Review Outputs Carefully:
    • Double-check SPSS outputs to ensure accuracy and relevance.
  6. Seek Guidance:
    • Collaborate with peers or seek professional SPSS help for complex assignments.

The Importance of SPSS in Academic Research

Combining SPSS with Other Tools for Research Excellence

Integrating SPSS with other tools can enhance the research process:

  1. Excel:
    • Use Excel for data preparation and import datasets into SPSS for analysis.
  2. R and Python:
    • Complement SPSS with R or Python for advanced statistical modeling.
  3. Qualtrics:
    • Collect survey data with Qualtrics and analyze it in SPSS.
  4. NVivo:
    • Use NVivo for qualitative data analysis alongside SPSS for quantitative insights.

Future of SPSS in Academic Research

The role of SPSS in academic research will continue to grow as data-driven methodologies gain prominence. Emerging trends include:

  1. Integration with Big Data:
    • SPSS is evolving to handle large-scale datasets from diverse sources.
  2. AI and Machine Learning:
    • Incorporating AI features for predictive analytics and automated insights.
  3. Cloud-Based Platforms:
    • SPSS is moving towards cloud-based solutions for enhanced accessibility and collaboration.
  4. Real-Time Analytics:
    • Researchers will increasingly use SPSS for real-time data analysis and decision-making.

Conclusion

The Importance of SPSS in Academic Research: How Students Benefit cannot be overstated. As a powerful tool for statistical analysis and data management, SPSS empowers students to conduct high-quality research, improve their academic performance, and prepare for data-driven careers. By mastering SPSS and leveraging its capabilities, students can unlock new opportunities in their academic and professional journeys. Whether through self-learning or professional guidance, investing in SPSS proficiency is a step toward academic excellence and research success.

Getspsshelp.com is the best website for understanding the importance of SPSS in academic research due to its team of experts who provide comprehensive support in data analysis. The platform offers step-by-step guidance, making it easier for students to navigate SPSS and apply it effectively in their research projects. With a focus on accuracy and efficiency, getspsshelp.com helps users extract valuable insights from their data, enhancing the quality of their academic work. Additionally, the website caters to various academic disciplines, ensuring tailored assistance for each research field. Whether you’re a beginner or advanced user, getspsshelp.com offers the resources and expertise needed to succeed in academic research using SPSS.

Needs help with similar assignment?

We are available 24x7 to deliver the best services and assignment ready within 3-4 hours? Order a custom-written, plagiarism-free paper

Get Answer Over WhatsApp Order Paper Now

SPSS Data Entry and Coding: A Beginner’s Guide|2025

Data analysis is a cornerstone of research, and SPSS (Statistical Package for the Social Sciences) is one of the most widely used tools for this purpose. For beginners, understanding how to perform data entry and coding in SPSS can be daunting. This guide will walk you through the essential steps, tips, and techniques for effective SPSS data entry and coding, ensuring that you start your data analysis journey on the right foot.

SPSS Data Entry and Coding

Why Is SPSS Data Entry and Coding Important?

Accurate data entry and coding are fundamental to ensuring valid and reliable results. Here’s why it matters:

  • Minimizes Errors: Proper data entry reduces mistakes that could compromise your analysis.
  • Enhances Data Organization: Coding helps categorize and manage variables effectively.
  • Facilitates Analysis: Clean and coded data are easier to analyze and interpret.

Getting Started With SPSS Data Entry

1. Setting Up Your Data File

Before entering data, it’s crucial to set up your SPSS data file properly:

  • Open SPSS and select File > New > Data.
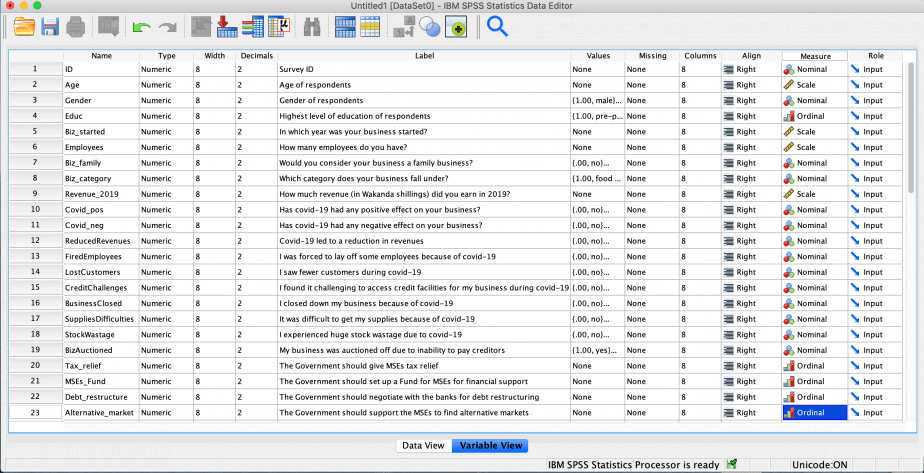
  • Define the variables in the Variable View tab:
    • Name: Assign a unique name to each variable (e.g., “Age”, “Gender”).
    • Type: Choose the appropriate variable type (e.g., Numeric, String).
    • Label: Add a descriptive label for each variable.
    • Values: For categorical variables, assign numeric codes (e.g., 1 = Male, 2 = Female).
    • Measure: Specify the scale of measurement (e.g., Nominal, Ordinal, Scale).

2. Entering Data

Once the variables are set up, switch to the Data View tab to input your data:

  • Each row represents a case (e.g., a survey respondent).
  • Each column corresponds to a variable.
  • Enter data manually or copy-paste from a spreadsheet.

Best Practices for Data Entry

  • Double-Check Variable Setup: Ensure variable names, types, and labels are correct before entering data.
  • Avoid Missing Values: Use a consistent code (e.g., -99) for missing data and document it.
  • Validate Entries: Regularly review your data for typos or inconsistencies.

SPSS Data Entry and Coding

Introduction to Coding in SPSS

Coding is the process of transforming raw data into a structured format for analysis. It involves assigning numeric or symbolic codes to represent different categories or responses.

1. Why Coding Is Essential

  • Simplifies data entry and storage.
  • Makes it easier to perform statistical analyses.
  • Enhances consistency and reduces ambiguity.

2. Coding Categorical Variables

Categorical variables, such as gender or education level, require coding to be analyzed in SPSS. Follow these steps:

  • In the Variable View, select the variable you want to code.
  • Click on the Values cell and define the codes:
    • Enter the numeric value (e.g., 1).
    • Add the corresponding label (e.g., Male).
    • Repeat for all categories.

3. Recoding Variables

Sometimes, you may need to recode variables to group categories or create new ones. Use the following steps:

  • Go to Transform > Recode into Same Variables or Recode into Different Variables.
  • Select the variable to recode and specify the new values.
  • Save the recoded variable with a new name if creating a separate variable.

4. Using SPSS Syntax for Coding

While the SPSS interface is user-friendly, using syntax provides greater flexibility and efficiency:

  • Open the Syntax Editor (File > New > Syntax).
  • Write commands, such as:
    RECODE Gender ("Male" = 1) ("Female" = 2) INTO Gender_Code.
    EXECUTE.
  • Run the syntax to execute the coding.

Tips for Effective SPSS Data Entry and Coding

  1. Plan Ahead:
    • Define variables and coding schemes before data collection.
    • Use a data dictionary to document codes and labels.
  2. Be Consistent:
    • Use uniform coding practices across variables.
    • Avoid mixing numeric and string values in the same variable.
  3. Leverage SPSS Tools:
    • Use the Data Validation feature to check for inconsistencies.
    • Utilize the Define Variable Properties tool to streamline variable setup.
  4. Save Regularly:
    • Save your work frequently to prevent data loss.
    • Maintain backup copies of your data file.

SPSS Data Entry and Coding

Common Challenges in SPSS Data Entry and Coding

1. Handling Missing Data

  • Identify missing values using Analyze > Descriptive Statistics > Frequencies.
  • Use appropriate strategies to handle missing data:
    • Imputation techniques for small datasets.
    • Excluding cases or variables with excessive missing data.

2. Dealing With Large Datasets

  • Import data directly from spreadsheets or databases to save time.
  • Use SPSS’s Split File and Select Cases options to manage subsets of data.

3. Avoiding Typographical Errors

  • Use drop-down menus and predefined codes to minimize manual entry errors.
  • Double-check entries against the original data source.

Practical Example: Data Entry and Coding in SPSS

Scenario

A researcher conducts a survey on job satisfaction among employees. The dataset includes variables such as:

  • Age (continuous variable)
  • Gender (categorical variable: Male, Female)
  • Job Satisfaction (categorical variable: Satisfied, Neutral, Dissatisfied)

Steps

  1. Define Variables:
    • In Variable View, create variables: Age, Gender, Job_Satisfaction.
    • Assign labels and codes (e.g., Gender: 1 = Male, 2 = Female).
  2. Enter Data:
    • Switch to Data View and input data for each respondent.
  3. Code Variables:
    • Use Transform > Recode to create grouped age categories (e.g., 1 = “Under 30”, 2 = “30-50”, 3 = “Above 50”).
  4. Analyze Data:
    • Perform descriptive statistics and visualize results using bar charts or histograms.

Learning Resources for SPSS Data Entry and Coding

  1. Official SPSS Documentation: Comprehensive guides from IBM.
  2. Online Tutorials: Platforms like YouTube, Coursera, and Udemy offer detailed walkthroughs.
  3. Practice Datasets: Use open datasets from platforms like Kaggle or Data World to hone your skills.
  4. Community Forums: Engage with SPSS users on forums like Stack Overflow or ResearchGate.

Conclusion

Mastering SPSS data entry and coding is essential for accurate and efficient data analysis. By understanding the basics of variable setup, coding practices, and common challenges, beginners can build a strong foundation in SPSS. Practice regularly, leverage available resources, and follow best practices to enhance your skills and confidence in working with SPSS.

Getspsshelp.com is the best website for SPSS data entry and coding because it provides expert guidance tailored to beginners, helping users understand the basics of data formatting and coding. The platform offers clear, step-by-step instructions, ensuring that even those with minimal experience can navigate SPSS with ease. With a team of professionals skilled in data entry and coding techniques, students receive accurate and efficient support for their assignments. Additionally, the website offers personalized help, addressing specific challenges faced by users in organizing and coding their datasets. By providing practical tips and solutions, getspsshelp.com ensures a smooth learning experience for anyone new to SPSS.

Needs help with similar assignment?

We are available 24x7 to deliver the best services and assignment ready within 3-4 hours? Order a custom-written, plagiarism-free paper

Get Answer Over WhatsApp Order Paper Now

SPSS Help for MBA Students: Solving Business Analytics Assignments|2025

SPSS Help for MBA Students provides essential guidance to master statistical analysis, streamline business research, and excel in academic projects with confidence. In the rapidly evolving business landscape, data-driven decision-making is paramount for success. For MBA students, mastering business analytics and tools like SPSS (Statistical Package for the Social Sciences) is crucial for tackling complex data challenges. SPSS offers a robust platform for analyzing, interpreting, and presenting data, making it an indispensable tool for business analytics assignments.

This comprehensive guide explores the role of SPSS in business analytics for MBA students and provides actionable insights into how professional SPSS help can enhance their academic and professional journey.


SPSS Help for MBA Students

Understanding SPSS in Business Analytics

SPSS is a versatile statistical software widely used in academia and industry for data analysis. Its user-friendly interface and powerful capabilities make it ideal for handling complex business analytics tasks, such as market research, financial forecasting, and customer segmentation.

Why SPSS is Essential for MBA Students:

  1. Data Management:
    • Efficiently organize and manage large datasets.
  2. Advanced Statistical Analysis:
    • Perform descriptive and inferential statistics, including regression, ANOVA, and chi-square tests.
  3. Visualization:
    • Generate graphs and charts for clear data representation.
  4. Predictive Modeling:
    • Develop models to forecast business trends and outcomes.
  5. Integration:
    • Seamlessly integrate with Excel, CSV files, and other data formats.

Common Challenges MBA Students Face with SPSS Assignments

Despite its strengths, SPSS can be challenging for MBA students, particularly those new to statistical software or business analytics.

Key Challenges:

  1. Understanding Statistical Concepts:
    • Grasping concepts like p-values, standard deviation, and confidence intervals.
  2. Data Cleaning:
    • Identifying and rectifying errors in raw datasets.
  3. Complex Analyses:
    • Executing multivariate analyses or logistic regression without errors.
  4. Time Constraints:
    • Balancing SPSS assignments with other MBA coursework.
  5. Interpretation:
    • Translating SPSS output into actionable business insights.

SPSS Help for MBA Students

Benefits of SPSS Help for MBA Students

Professional SPSS help provides tailored solutions to overcome these challenges, ensuring students excel in their assignments and build confidence in using the software.

Key Benefits:

  1. Expert Guidance:
    • Work with seasoned statisticians who specialize in SPSS and business analytics.
  2. Customized Solutions:
    • Receive personalized support tailored to specific assignment requirements.
  3. Error-Free Analysis:
    • Ensure accuracy in data input, analysis, and output interpretation.
  4. Time Efficiency:
    • Save time by outsourcing complex tasks.
  5. Skill Development:
    • Learn best practices and techniques to independently handle future SPSS tasks.

Types of SPSS Assignments in MBA Programs

MBA programs often integrate SPSS into various coursework and projects. Here are some common types of assignments where SPSS plays a vital role:

1. Market Research:

  • Analyze consumer behavior, preferences, and satisfaction levels using survey data.
  • Techniques: Descriptive statistics, cross-tabulation, and chi-square tests.

2. Financial Analysis:

  • Forecast trends and assess risks through regression analysis and time series modeling.
  • Techniques: Linear regression, correlation analysis.

3. Operations Management:

  • Optimize processes and resource allocation with data-driven insights.
  • Techniques: ANOVA, hypothesis testing.

4. Human Resources Analytics:

  • Study employee performance, retention, and satisfaction.
  • Techniques: Logistic regression, clustering.

5. Customer Segmentation:

  • Segment customers based on demographics and behavior.
  • Techniques: Factor analysis, cluster analysis.

How to Approach SPSS Business Analytics Assignments

Here’s a step-by-step guide for MBA students to approach their SPSS assignments effectively:

Step 1: Understand the Objective

  • Clearly define the problem statement and expected outcomes.

Step 2: Prepare the Dataset

  • Collect, clean, and format data to ensure accuracy.

Step 3: Select Appropriate Analysis

  • Identify the statistical tests or models that align with the assignment objectives.

Step 4: Execute Analysis in SPSS

  • Use SPSS to perform data analysis, ensuring proper commands and syntax are applied.

Step 5: Interpret Results

  • Translate SPSS output into actionable insights with clear narratives and visualizations.

Step 6: Present Findings

  • Compile results into a professional report with graphs, tables, and business implications.

SPSS Help for MBA Students

Top Platforms for SPSS Help

1. Academic Assistance Websites

2. Freelance Platforms

  • Connect with professionals offering specialized SPSS services.

3. University Resources

  • Leverage university labs, professors, and peer groups for SPSS guidance.

4. Online Communities

  • Engage with forums like Reddit or ResearchGate to discuss SPSS-related queries.

5. Paid SPSS Services

  • Opt for premium platforms offering end-to-end SPSS solutions.

Tips for MBA Students to Maximize SPSS Help

  1. Clearly Define Requirements:
    • Provide detailed assignment instructions and datasets for accurate assistance.
  2. Ask Questions:
    • Engage with experts to understand the process and rationale behind analyses.
  3. Review Outputs:
    • Double-check SPSS outputs to ensure alignment with assignment objectives.
  4. Learn Through Practice:
    • Use professional help as a learning tool to build your SPSS proficiency.
  5. Stay Ethical:
    • Ensure your usage of SPSS help complies with academic integrity guidelines.

Combining SPSS Help with Self-Learning

To truly excel in business analytics, MBA students should complement professional SPSS help with self-learning efforts:

Recommended Resources:

  1. Books:
    • “SPSS for Dummies” by Arthur Griffith.
    • “Discovering Statistics Using IBM SPSS Statistics” by Andy Field.
  2. Online Courses:
    • Coursera, Udemy, and LinkedIn Learning offer structured SPSS courses.
  3. Video Tutorials:
    • YouTube channels dedicated to SPSS basics and advanced techniques.
  4. Practice Datasets:

SPSS Help for MBA Students

The Future of SPSS in Business Analytics

As data-driven decision-making becomes increasingly vital, SPSS will remain a critical tool in business analytics. For MBA students, proficiency in SPSS not only aids in academic success but also enhances career prospects in fields like consulting, market research, and financial analysis.

Emerging Trends:

  1. Integration with AI:
    • SPSS is evolving to incorporate AI and machine learning capabilities.
  2. Cloud-Based Analytics:
    • Cloud platforms are making SPSS more accessible and collaborative.
  3. Real-Time Analytics:
    • Businesses are leveraging SPSS for real-time decision-making.

Conclusion

SPSS Help for MBA Students: Solving Business Analytics Assignments bridges the gap between theoretical knowledge and practical application. By combining professional SPSS help with self-learning, MBA students can effectively tackle complex assignments, enhance their analytical skills, and prepare for a data-driven business world. Whether through expert guidance or hands-on practice, mastering SPSS is a valuable investment in one’s academic and professional journey.

Needs help with similar assignment?

We are available 24x7 to deliver the best services and assignment ready within 3-4 hours? Order a custom-written, plagiarism-free paper
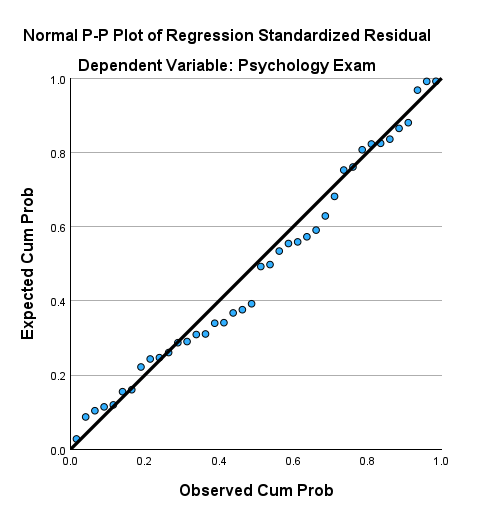
Get Answer Over WhatsApp Order Paper Now