Chi-Square Test in STATA: An In-Depth Analysis|2025
Learn Chi-Square Test in STATA with step-by-step guidance. Discover how to test associations between categorical variables and interpret results accurately.
Statistical analysis plays a crucial role in various fields, from social sciences to economics, biology, and health research. One of the most commonly used statistical tests is the Chi-Square test, which is designed to examine whether there is a significant association between categorical variables. In this paper, we will delve into the Chi-Square test in the context of STATA, a powerful statistical software commonly used for data analysis.
The Chi-Square test is often used to analyze the relationship between categorical variables and can be applied in various forms, including the Chi-Square test of independence, Chi-Square test of proportions, and Chi-Square tests involving multiple variables. This paper will provide a comprehensive guide on how to perform the Chi-Square test in STATA, including how to interpret the results, the p-value, and how to handle multiple variables.
What is the Chi-Square Test?
The Chi-Square test is a statistical method used to determine whether there is a significant association between two categorical variables. In essence, it compares the observed frequencies of occurrences in different categories with the frequencies that would be expected under the null hypothesis (i.e., no association between the variables). The Chi-Square statistic follows a Chi-Square distribution with a specific degree of freedom.
There are two main types of Chi-Square tests:
- Chi-Square Test of Independence – This test is used to determine if two categorical variables are independent of each other.
- Chi-Square Test of Homogeneity or Proportions – This test is used to compare the proportions of categories across different groups.
How to Perform a Chi-Square Test in STATA
Performing a Chi-Square test in STATA is relatively straightforward. However, the steps vary slightly depending on the type of test you are conducting. Below is a step-by-step guide for conducting a Chi-Square test in STATA.
Chi-Square Test of Independence in STATA
To perform a Chi-Square test of independence in STATA, follow these steps:
- Load Data into STATA: You first need to load your dataset into STATA. For example, if you are working with a CSV file, you can use the
import delimitedcommand to load your data. - Cross-tabulate Variables: To run a Chi-Square test of independence, you need to cross-tabulate the two categorical variables. You can do this using the
tabulatecommand:Here,
var1andvar2are the two categorical variables you wish to test for independence. Thechi2option specifies that STATA should perform the Chi-Square test. - Interpret the Output: STATA will provide you with a contingency table along with the Chi-Square statistic, degrees of freedom, and the p-value. The p-value tells you whether there is enough evidence to reject the null hypothesis of independence. If the p-value is less than 0.05, you can reject the null hypothesis and conclude that the two variables are significantly associated.
Chi-Square Test of Proportions in STATA
When you want to compare the proportions of a categorical variable across different groups, you can use the Chi-Square test of proportions. To perform this test in STATA:
- Specify the Variables: Let’s assume you have a categorical variable (
var1) and you want to compare the proportions across different levels of a grouping variable (group_var). - Use the
tabulateCommand: You can use thetabulatecommand with thechi2option to perform the Chi-Square test of proportions: - Examine the Results: As with the Chi-Square test of independence, STATA will provide the Chi-Square statistic, degrees of freedom, and p-value. A p-value less than 0.05 suggests that the proportions differ significantly across the groups.
Chi-Square Test Involving Multiple Variables in STATA
STATA allows you to extend the Chi-Square test to more than two variables. If you wish to analyze the relationship between multiple categorical variables, you can use the tabulate command in conjunction with the chi2 option.
For example, suppose you have three categorical variables: var1, var2, and var3. You can create a multi-way contingency table using:
This will generate a table with the frequencies of the combinations of values in var1, var2, and var3 and perform the Chi-Square test for association.

Interpreting the Chi-Square Test Results in STATA
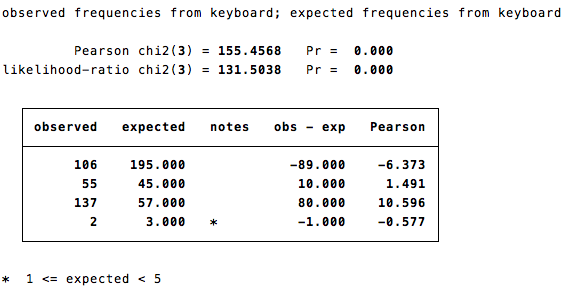
When STATA performs a Chi-Square test, the results will include the following key components:
- Chi-Square Statistic (χ²): This value is calculated by comparing the observed frequencies to the expected frequencies under the null hypothesis. A higher Chi-Square statistic indicates a greater difference between the observed and expected frequencies.
- Degrees of Freedom (df): The degrees of freedom are calculated based on the number of categories in the variables. For a Chi-Square test of independence with two categorical variables, the degrees of freedom are calculated as:df=(r−1)(c−1)\text{df} = (r – 1)(c – 1)where
ris the number of rows (categories in the first variable) andcis the number of columns (categories in the second variable). - P-Value: The p-value is the probability that the observed data would occur if the null hypothesis were true. A low p-value (typically less than 0.05) suggests that the null hypothesis can be rejected, indicating a significant association between the variables.
- If the p-value is less than 0.05, you can reject the null hypothesis and conclude that there is a significant relationship between the variables.
- If the p-value is greater than 0.05, you fail to reject the null hypothesis, implying no significant relationship between the variables.
Example of a Chi-Square Test in STATA
Let’s consider an example where we examine the relationship between gender (gender) and smoking status (smoking_status), both of which are categorical variables. The gender variable has two categories: Male and Female. The smoking_status variable has three categories: Non-smoker, Smoker, and Former smoker.
- Load the Data:
- Run the Chi-Square Test of Independence:
- Interpret the Output:
- If the Chi-Square statistic is large and the p-value is less than 0.05, you can conclude that there is a significant relationship between gender and smoking status.
- If the p-value is greater than 0.05, you would conclude that gender and smoking status are independent.

Chi-Square Test Assumptions
There are several assumptions that must be met when using the Chi-Square test:
- Independence of Observations: Each observation must belong to only one category, and the categories must be mutually exclusive.
- Sufficient Sample Size: The expected frequency in each cell of the contingency table should be at least 5 to ensure the accuracy of the Chi-Square approximation.
- Categorical Data: The variables being analyzed must be categorical, meaning they should consist of distinct categories or groups.
Conclusion
The Chi-Square test is a versatile and essential tool for analyzing categorical data in STATA. Whether testing for independence, comparing proportions, or analyzing the relationship between multiple variables, STATA makes it easy to perform and interpret Chi-Square tests. The key to successful implementation is understanding the underlying assumptions and properly interpreting the results, particularly the p-value. By following the steps outlined in this paper, researchers and analysts can confidently use STATA to perform Chi-Square tests and gain valuable insights from their data.
For further study, users can explore various online resources such as Chi-Square test in STATA PDF guides, online tutorials, and more advanced textbooks that delve deeper into statistical tests and their application using STATA.
Needs help with similar assignment?
We are available 24x7 to deliver the best services and assignment ready within 3-4 hours? Order a custom-written, plagiarism-free paper
