How to Conduct Factor Analysis in Stata: A Comprehensive Guide|2025
/in STATA Articles /by BesttutorHow to Conduct Factor Analysis in Stata: A Comprehensive Guide offers step-by-step instructions for performing factor analysis in Stata. Learn essential techniques to interpret results and apply them effectively in your data analysis projects.
Factor analysis is a complex statistical technique used to identify underlying relationships between variables. It is often employed in social sciences, psychology, economics, and other fields to reduce dimensionality and uncover latent factors. This paper offers a step-by-step guide on how to conduct factor analysis in Stata, discussing key concepts such as exploratory factor analysis (EFA), confirmatory factor analysis (CFA), principal component analysis (PCA), and their implementation within Stata.
We also explore how to compare factor analysis approaches in Stata with those in other software like SPSS and the usage of advanced options like the Confirmatory Factor Analysis (CFA) package from UCLA. The guide includes practical examples and step-by-step instructions to provide a clear roadmap for researchers to perform factor analysis with confidence.
Table of Contents
ToggleIntroduction
Factor analysis (FA) is a statistical method designed to identify the underlying structure of a dataset. It helps to reduce the number of observed variables into fewer, unobserved variables or “factors,” which are more manageable and can reveal important patterns in the data. Factor analysis has two main types: exploratory factor analysis (EFA) and confirmatory factor analysis (CFA). These techniques allow researchers to uncover latent structures and test hypotheses about the factors underlying their data. The use of principal component analysis (PCA) is also prevalent in factor analysis as a method for dimensionality reduction.
Stata is one of the leading statistical software packages widely used for conducting factor analysis. It is known for its robust capabilities in handling both exploratory and confirmatory factor analysis, offering tools that are simple to execute while still providing advanced options for thorough analysis. This paper explores how to conduct factor analysis in Stata, compares the process with other software like SPSS, and addresses techniques such as principal component factor analysis and confirmatory factor analysis in Stata.
Chapter 1: Overview of Factor Analysis
Factor analysis can be divided into two main types:
- Exploratory Factor Analysis (EFA): This technique is used when the researcher does not have any preconceived ideas about the structure of the data. EFA seeks to discover the underlying factor structure by examining correlations between variables. It is often used for data reduction when the goal is to simplify the dataset and identify patterns.
- Confirmatory Factor Analysis (CFA): CFA is used when the researcher has prior knowledge about the factor structure and wants to test whether the data fits this hypothesized structure. CFA is more theory-driven and allows for testing of hypotheses about factor loadings and measurement models.
In both EFA and CFA, Stata provides powerful tools for conducting factor analysis with various options for rotation, extraction methods, and model fitting.
Chapter 2: Conducting Exploratory Factor Analysis (EFA) in Stata
Exploratory Factor Analysis (EFA) is typically the first step when conducting factor analysis. The goal of EFA is to identify the number of factors and their relationships with observed variables without assuming a predefined factor structure.
2.1 Steps to Perform EFA in Stata
Step 1: Preparing Your Data
Before conducting factor analysis, ensure that your dataset is clean and appropriate for factor analysis. Factor analysis assumes that variables are continuous, linearly related, and have multivariate normal distributions. Missing data should be handled appropriately (e.g., imputation or listwise deletion).
Step 2: Choosing Variables for Factor Analysis
Select the set of variables that you believe might be correlated and related to underlying factors. Factor analysis is best suited for datasets with a relatively large number of variables (at least 5 or more) and a sample size of at least 100 cases.
Step 3: Running Factor Analysis
To run EFA in Stata, the factor command is used. For example, to perform a factor analysis on variables var1, var2, var3, and var4, you would use the following syntax:
factor var1 var2 var3 var4
This will run a basic factor analysis on the selected variables. By default, Stata will extract the factors based on the eigenvalue greater than one rule (Kaiser criterion).
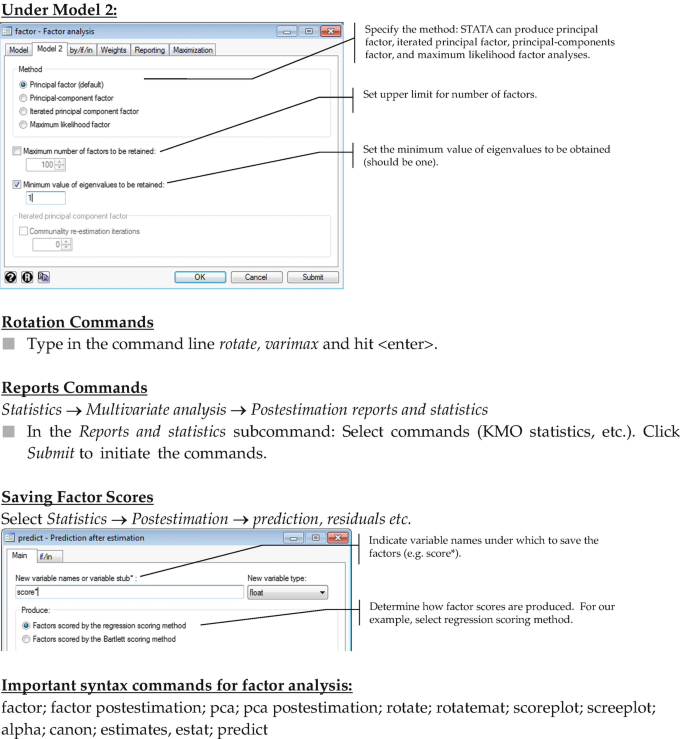
Step 4: Rotation
Rotation helps to achieve a more interpretable factor solution. The most common rotation methods are varimax (orthogonal rotation) and oblimin (oblique rotation). In Stata, you can specify the rotation method as follows:
factor var1 var2 var3 var4, rotate(varimax)
Alternatively, use rotate(oblimin) for oblique rotation, which assumes that factors can be correlated.
Step 5: Interpreting the Results
The output will show eigenvalues, the proportion of variance explained by each factor, and factor loadings. Factor loadings represent the correlation between each variable and the factors. Higher factor loadings (closer to ±1) indicate a stronger relationship between the variable and the factor.
2.2 Example of EFA in Stata
Suppose you have a dataset containing survey responses from 200 participants on five questions about job satisfaction. You wish to perform an EFA to uncover the underlying factors driving job satisfaction.
factor q1 q2 q3 q4 q5

rotate(varimax)
The output will provide you with factor loadings for each of the five items on the factors, helping you interpret the underlying dimensions of job satisfaction (e.g., “work environment” and “employee benefits”).
Chapter 3: Principal Component Analysis (PCA) in Stata
Principal Component Analysis (PCA) is often used to reduce the dimensionality of data by transforming correlated variables into a smaller number of uncorrelated components. While PCA is technically not factor analysis, it is sometimes used as a preliminary step in factor analysis, especially when seeking to reduce the number of variables before running an EFA.
3.1 Performing PCA in Stata
PCA can be performed in Stata using the pca command. For example, to conduct PCA on the same variables (var1, var2, var3, and var4):
pca var1 var2 var3 var4
This will generate principal components and display the proportion of variance explained by each component.
Chapter 4: Conducting Confirmatory Factor Analysis (CFA) in Stata
Confirmatory Factor Analysis (CFA) allows researchers to test a predefined factor model. This is more structured than EFA and is often used to validate theoretical models. Stata provides several tools for CFA, including the sem (structural equation modeling) command, which can be used for testing CFA models.
4.1 Steps to Perform CFA in Stata
Step 1: Define Your Model
In CFA, you must define the number of factors and which observed variables load onto each factor. For example, let’s assume that you hypothesize two factors: “Factor 1” is measured by var1 and var2, while “Factor 2” is measured by var3 and var4.
Step 2: Specify the CFA Model
Use Stata’s sem command to specify the factor structure. Here’s an example where we specify a two-factor model:
sem (Factor1 -> var1 var2) (Factor2 -> var3 var4)
This tells Stata that Factor1 is measured by var1 and var2, and Factor2 is measured by var3 and var4.
Step 3: Fit the Model and Interpret the Results
Once you run the CFA model, Stata will provide output that includes fit indices such as chi-square, RMSEA, CFI, and TLI, which can help you assess the fit of your model to the data.
Chapter 5: Factor Analysis in Other Software: Stata vs SPSS
While Stata is widely used for factor analysis, other software packages like SPSS also offer similar capabilities. SPSS has an intuitive graphical interface for conducting both EFA and CFA, and it supports several rotation methods. However, Stata provides more flexibility and advanced options for programming and output interpretation.
In SPSS, you would use the Factor Analysis procedure under the “Analyze” menu, and it provides the option to choose between PCA, EFA, or other methods like maximum likelihood extraction. Both Stata and SPSS offer graphical representations of factor loadings and eigenvalues.

Chapter 6: Conclusion
Factor analysis in Stata is a powerful and flexible tool for uncovering the underlying structures in complex datasets. Whether you are performing exploratory factor analysis (EFA) to identify latent variables or confirmatory factor analysis (CFA) to test predefined models, Stata provides the tools necessary to conduct a robust factor analysis. In comparison to other software such as SPSS, Stata offers greater control and precision, making it an ideal choice for researchers seeking to conduct thorough and reproducible analyses.
By understanding the differences between EFA, CFA, and PCA and utilizing the commands and options available in Stata, researchers can successfully conduct factor analysis to answer important questions in their field.
Needs help with similar assignment?
We are available 24x7 to deliver the best services and assignment ready within 3-4 hours? Order a custom-written, plagiarism-free paper
