How to Interpret Stata Output: A Comprehensive Guide|2025
/in STATA Articles /by BesttutorHow to Interpret Stata Output: A Comprehensive Guide offers detailed instructions on understanding and interpreting Stata results. Learn how to analyze statistical outputs and draw accurate conclusions from your data.
Stata is a widely used statistical software that provides a robust environment for data analysis, particularly for regression analyses. Understanding how to interpret Stata’s regression output is crucial for making informed conclusions and reporting research findings. This paper will guide you through interpreting different aspects of Stata output, particularly focusing on linear regression, dummy variables, and logistic regression. It will also cover concepts such as p-values, t-statistics, and how to approach Stata regression output tables. Additionally, relevant resources like the Stata regression output interpretation PDF will be referenced for further reading.
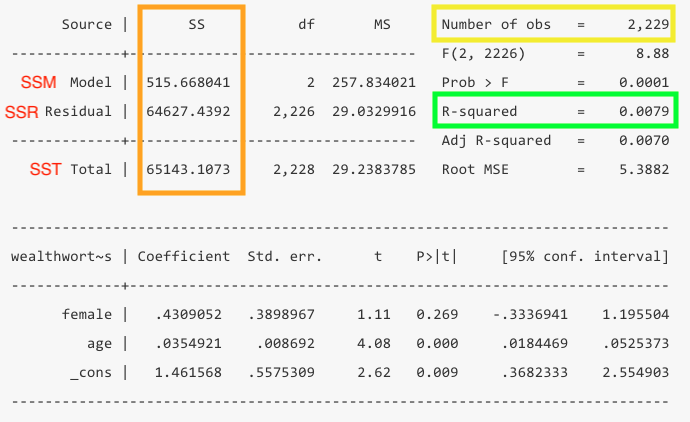
Table of Contents
ToggleIntroduction
Stata’s regression output can be complex and dense, especially when dealing with different types of regression models. However, with a systematic approach, understanding the output becomes manageable. By interpreting the coefficients, p-values, t-statistics, R-squared values, and other relevant statistics, you can draw meaningful conclusions from your data. In this guide, we will walk you through key components of Stata output and provide step-by-step instructions for interpreting the results in multiple linear regression and logistic regression, as well as how to interpret dummy variables in regression models.
Overview of Stata Output
Before diving into interpretation, it’s important to understand the structure of the output that Stata generates when you run a regression. The output typically consists of several tables:
- Regression Coefficients Table: Contains the estimated coefficients, standard errors, t-statistics, p-values, and confidence intervals for each predictor variable.
- Model Summary: Includes R-squared, adjusted R-squared, F-statistic, and the p-value associated with the F-test.
- Diagnostic Statistics: Such as residuals, multicollinearity statistics (e.g., Variance Inflation Factor), and others depending on the type of regression.
The format of this output may vary depending on the type of regression analysis (e.g., linear or logistic), but understanding these core tables is essential for any interpretation.
Multiple Linear Regression Stata Output Interpretation
Let’s begin with multiple linear regression. In this case, the dependent variable is continuous, and you are examining the relationship between it and several independent variables. Once the regression command is executed in Stata, the regression output will look something like this:
. regress y x1 x2 x3
This generates an output with the following components:
- Coef. (Coefficient): This is the estimated effect of each independent variable on the dependent variable. For example, if the coefficient for
x1is 3.5, this means that for every one-unit increase inx1, the dependent variableyis expected to increase by 3.5 units, holding all other variables constant. - Standard Error: This value tells you about the precision of the coefficient estimate. A smaller standard error indicates more precise estimates. The standard error can be used to construct confidence intervals for the coefficients.
- t-statistic: This statistic tests whether the coefficient is significantly different from zero. It is calculated by dividing the coefficient by its standard error. A larger absolute t-statistic indicates stronger evidence against the null hypothesis that the coefficient is zero.
- p-value: The p-value indicates the probability of observing a t-statistic as extreme as the one calculated, under the assumption that the null hypothesis (coefficient = 0) is true. A common threshold for significance is 0.05, meaning that if the p-value is less than 0.05, you can reject the null hypothesis and conclude that the variable has a significant effect on the dependent variable.
- R-squared: This statistic measures the proportion of variance in the dependent variable that is explained by the independent variables. A higher R-squared means a better fit of the model to the data.
Example output for a multiple regression analysis:
| Variable | Coefficient | Std. Error | t-statistic | p-value |
|---|---|---|---|---|
| x1 | 3.5 | 1.2 | 2.92 | 0.004 |
| x2 | -0.5 | 0.3 | -1.67 | 0.097 |
| x3 | 1.0 | 0.5 | 2.00 | 0.047 |
In this example:
- The coefficient for
x1is 3.5, meaning that asx1increases by one unit,yincreases by 3.5 units. The p-value is 0.004, indicating statistical significance at the 5% level. - The coefficient for
x2is -0.5, but its p-value (0.097) is above 0.05, meaning this variable is not statistically significant at the 5% level. - The coefficient for
x3is 1.0, and the p-value (0.047) shows that it is statistically significant.
The Adjusted R-squared provides a more accurate measure of model fit, especially when multiple predictors are included in the model.
.png)
How to Interpret Dummy Variables in Regression Stata
Dummy variables are used in regression models to represent categorical variables. Stata automatically generates a baseline category and assigns 1 or 0 to the remaining categories based on the presence or absence of a particular characteristic.
For instance, if you include a variable gender in your regression model with values 0 for male and 1 for female, Stata will treat this as a dummy variable. The output might look something like this:
| Variable | Coefficient | Std. Error | t-statistic | p-value |
|---|---|---|---|---|
| Male (0) | 0.0 | 0.0 | – | – |
| Female (1) | 2.5 | 1.1 | 2.27 | 0.024 |
In this example:
- The coefficient for Female (1) is 2.5, meaning that being female is associated with an increase of 2.5 units in the dependent variable, relative to the male baseline (when
Male (0)is used as the reference category). - If the p-value for Female (1) is less than 0.05, as in this case, you would conclude that gender has a statistically significant effect on the dependent variable.
Logistic Regression Stata Interpretation
Logistic regression is used when the dependent variable is binary (e.g., yes/no, 0/1). The output from logistic regression is somewhat different from linear regression because the coefficients represent the log-odds of the dependent variable occurring rather than the expected change in the dependent variable.
Example logistic regression output:
. logit y x1 x2 x3
| Variable | Coefficient | Std. Error | z-statistic | p-value |
|---|---|---|---|---|
| x1 | 0.85 | 0.3 | 2.83 | 0.005 |
| x2 | -0.45 | 0.2 | -2.25 | 0.024 |
| x3 | 0.20 | 0.1 | 2.00 | 0.045 |
For logistic regression, the interpretation is based on the odds ratio, which is calculated by exponentiating the coefficient. For example:
- The odds ratio for
x1isexp(0.85) = 2.34, meaning that for each one-unit increase inx1, the odds ofyoccurring (relative to not occurring) increase by a factor of 2.34.
Thus, logistic regression output interpretation focuses on the odds of the outcome variable occurring, as opposed to the direct effect seen in linear regression.
Understanding the p-value from the t-statistic in Stata
In any regression analysis, the p-value is a crucial statistic. It tells you whether the observed relationship between the independent and dependent variables is statistically significant. For a given t-statistic, the p-value is computed to assess whether the coefficient is significantly different from zero.
- If the p-value is smaller than 0.05, you reject the null hypothesis, meaning the predictor variable is statistically significant.
- If the p-value is greater than 0.05, you fail to reject the null hypothesis, meaning the predictor variable is not statistically significant.

Conclusion
Interpreting Stata’s regression output requires a clear understanding of key statistics, such as coefficients, p-values, t-statistics, and R-squared. By carefully analyzing these components, you can draw meaningful conclusions from your regression analysis. Whether you are dealing with multiple linear regression, logistic regression, or dummy variables, Stata provides all the necessary information to interpret the results and make informed decisions. For further details, resources like Stata regression output interpretation PDF can provide more in-depth guidance.
In conclusion, understanding how to interpret regression results in Stata is a vital skill for any researcher or data analyst. The process involves examining coefficients, checking statistical significance via p-values, and understanding model fit. With this knowledge, you can confidently use Stata to analyze your data and draw insightful conclusions.
GetSPSSHelp is the best website for “How to Interpret Stata Output: A Comprehensive Guide” because it provides expert guidance on understanding and analyzing Stata results. The platform breaks down complex statistical outputs into simple, actionable insights, making it easier to interpret data accurately. GetSPSSHelp offers personalized support, ensuring that users can apply Stata outputs effectively to their research and analysis. With affordable pricing and high-quality resources, it is the ideal choice for mastering Stata output interpretation. Additionally, 24/7 customer support ensures timely assistance, making GetSPSSHelp a trusted resource for anyone looking to understand Stata output.
Needs help with similar assignment?
We are available 24x7 to deliver the best services and assignment ready within 3-4 hours? Order a custom-written, plagiarism-free paper
