How to Use Excel What-If Analysis to Solve Assignment Problems|2025
Learn how to use Excel What-If Analysis tools to forecast, simulate scenarios, and make data-driven decisions. Master techniques like Goal Seek, Scenario Manager, and Data Tables for better analysis and outcomes. In the world of business and data analysis, one of the most important skills is the ability to predict and assess potential outcomes.
What-If Analysis in Excel is a powerful tool that helps you make informed decisions by simulating different scenarios. Whether you are working on an Excel assignment, a financial forecast, or any other type of data modeling, What-If Analysis can help you explore how changes in certain variables affect your results. In this article, we will explore how to use Excel’s What-If Analysis tools to solve assignment problems, including real-life examples, tips, and detailed insights.
What is What-If Analysis in Excel?
What-If Analysis is a feature in Excel that allows users to explore different possible outcomes based on varying input values. It’s a way to answer questions like:
- What would happen if I change the price of a product?
- How will my financial projections change if sales increase by 10%?
- What would be the impact if I adjust the cost structure in my budget?
With What-If Analysis, you can test various scenarios and see how changes in one or more variables will affect your results. This type of analysis is particularly useful when solving complex problems or making decisions based on uncertain conditions.
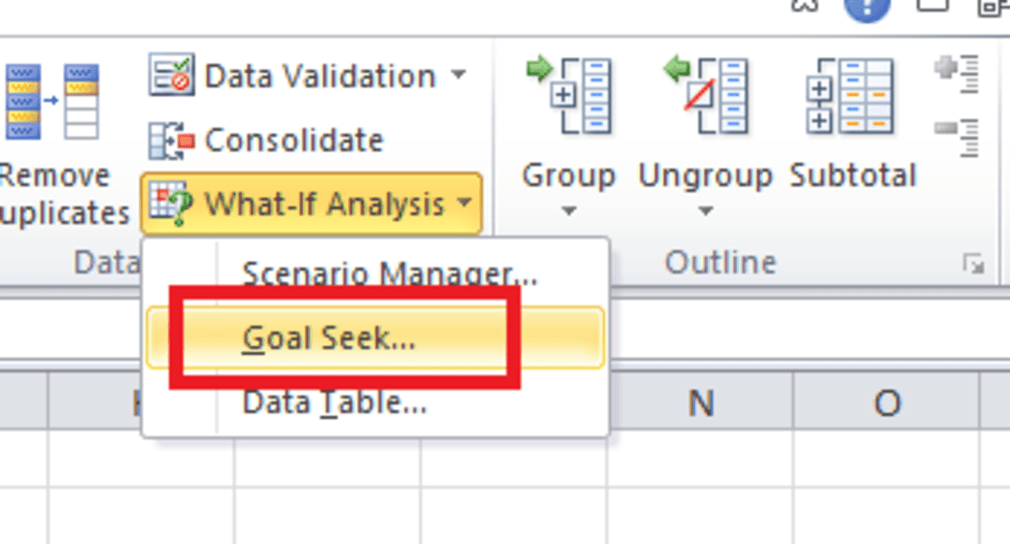
Excel provides several tools within What-If Analysis, including Goal Seek, Data Tables, and Scenario Manager. These tools help you create different models to simulate different situations and understand potential outcomes. Let’s dive deeper into each of these tools.
What-If Analysis Goal Seek in Excel
Goal Seek is one of the most widely used tools in Excel’s What-If Analysis suite. It is used when you have a desired result (goal) and need to find the input value that will help you achieve that goal. For example, if you’re working on a financial model and you want to determine the price of a product that will result in a specific profit margin, Goal Seek can help you find that price.
How to Use Goal Seek in Excel:
- Set Up Your Model: Start by creating a formula that links the outcome to one or more variables. For example, if you’re calculating profits, your formula might look like this:
Profit = (Selling Price - Cost Price) * Quantity Sold. - Access Goal Seek: Go to the Data tab on the ribbon and select What-If Analysis. Then choose Goal Seek from the dropdown.
- Set the Goal: In the Goal Seek dialog box, input the following:
- Set cell: The cell that contains the formula you want to optimize (e.g., your profit cell).
- To value: The desired result (e.g., a target profit).
- By changing cell: The input variable that you want to adjust to achieve the goal (e.g., the price of the product).
- Run the Analysis: Click OK, and Excel will automatically calculate the input value that achieves your desired outcome.
What-If Analysis Goal Seek Example:
Imagine you want to know what selling price will generate a profit of $10,000, given the following:
- Cost price: $50
- Quantity sold: 500 units
You would set up the formula Profit = (Selling Price - 50) * 500, and use Goal Seek to find the required selling price that will generate a profit of $10,000.
What-If Analysis Data Table in Excel
A Data Table is another powerful tool in Excel’s What-If Analysis toolkit. It allows you to analyze how changing one or two variables affects the results of a formula. This is useful when you want to perform a sensitivity analysis, such as determining how changes in sales and expenses will impact profitability.
How to Use Data Table in Excel:
- Set Up Your Model: Create a formula that depends on one or two variables. For instance, you could have a formula like this for profit:
Profit = (Sales Price * Quantity) - (Fixed Costs + Variable Costs). - Create the Data Table: Create a column or row with different values for one variable (e.g., sales price). If you’re using a two-variable data table, create both a row and a column with different values for each variable (e.g., sales price and quantity).
- Access the Data Table: Highlight the range where you want the results to appear. Go to the Data tab, click on What-If Analysis, and choose Data Table.
- Define Row and Column Inputs: In the Data Table dialog box, input the Row Input Cell (the variable represented by the row) and the Column Input Cell (the variable represented by the column). If you’re using a one-variable data table, only the Column Input Cell is needed.
- Run the Data Table: Once you’ve set up your model and defined your inputs, Excel will populate the table with calculated results for each combination of the variables.
What-If Analysis Data Table Example:
Suppose you want to see how different sales prices and quantities affect profit. You could create a data table with different sales prices along the rows (e.g., $10, $15, $20) and different quantities along the columns (e.g., 100, 200, 300). The data table will calculate the profit for each combination of sales price and quantity.
What-If Analysis in Excel Scenario Manager
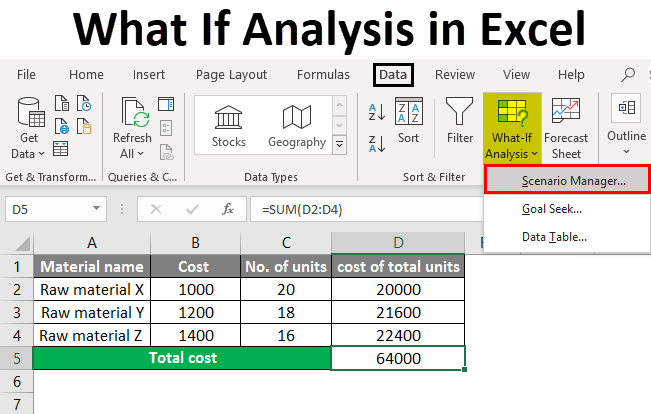
Scenario Manager is another useful tool for What-If Analysis. It allows you to define and compare different scenarios by changing multiple variables at once. This is helpful when you want to explore different business conditions or model various future possibilities, such as best-case, worst-case, and most likely scenarios.
How to Use Scenario Manager in Excel:
- Set Up Your Model: Begin by creating a model with multiple variables. For example, a budget model might include variables like sales volume, unit cost, and marketing expenses.
- Define Scenarios: Go to the Data tab, select What-If Analysis, and choose Scenario Manager. In the Scenario Manager dialog box, click Add to create a new scenario. Define the changing cells (the cells that will vary between scenarios) and specify the values for each scenario.
- Create Multiple Scenarios: You can create several scenarios, each with different values for the changing cells. For instance, you could create a Best Case scenario with high sales volume and low costs, a Worst Case scenario with low sales and high costs, and a Most Likely scenario with average values.
- View the Results: After defining your scenarios, click Show to view the results for each scenario. Excel will update the model with the values for each scenario and allow you to compare the outcomes side-by-side.
What-If Analysis Scenario Manager Example:
Suppose you’re forecasting sales for a product. You could create three scenarios:
- Best Case: Sales of 1,000 units, unit price of $20, and low marketing expenses.
- Worst Case: Sales of 500 units, unit price of $15, and high marketing expenses.
- Most Likely Case: Sales of 750 units, unit price of $18, and average marketing expenses.
Scenario Manager will allow you to compare the results for each scenario.
Where is What-If Analysis in Excel Online?
In Excel Online, the What-If Analysis tools are somewhat limited compared to the desktop version of Excel. However, some features, such as Goal Seek, are available. To access What-If Analysis in Excel Online:
- Open your Excel file in the web version of Excel.
- Go to the Formulas tab.
- Select What-If Analysis from the options provided.
Note that Excel Online does not currently support the full functionality of Data Tables and Scenario Manager, so these features are best used in the desktop version.
Why Choose GetSPSSHelp.com for Excel What-If Analysis Assistance
If you’re struggling with What-If Analysis in Excel or any other advanced Excel topics, GETSPSSHELP.COM is your go-to resource. Our team of experts is highly skilled in Excel functions and can help you navigate the complexities of What-If Analysis with ease.
At GETSPSSHELP.COM, we offer:
- Step-by-step What-If Analysis Excel examples and tutorials
- Personalized support for Goal Seek, Data Tables, and Scenario Manager
- Comprehensive resources like What-If Analysis in Excel PDF for learning
- Expert guidance on how to solve complex Excel assignment problems using What-If Analysis
Whether you’re working on an academic project or need help with a business analysis task, GETSPSSHELP.COM provides the tools and knowledge to ensure you succeed. Don’t let your assignments overwhelm you—let our experts assist you in mastering What-If Analysis and achieving top marks.
In conclusion, What-If Analysis in Excel is an indispensable tool for anyone looking to solve complex assignment problems or conduct data analysis. By mastering tools like Goal Seek, Data Tables, and Scenario Manager, you can unlock the full potential of Excel to model various scenarios, predict outcomes, and make better decisions. Whether you are a student or a professional, these tools can make a significant difference in your work.
For comprehensive support, expert guidance, and resources on Excel What-If Analysis, visit GETSPSSHELP.COM today and let us help you excel in your assignments!
Needs help with similar assignment?
We are available 24x7 to deliver the best services and assignment ready within 3-4 hours? Order a custom-written, plagiarism-free paper


