Stata Descriptive Statistics Tutorial|2025
/in STATA Articles /by BesttutorStata Descriptive Statistics Tutorial provides a step-by-step guide to summarizing and analyzing data. Learn how to calculate means, medians, standard deviations, and more using Stata’s powerful tools.
Stata is a powerful statistical software that allows users to perform various data analysis tasks, including descriptive statistics. Descriptive statistics are essential tools for summarizing and understanding the basic features of a dataset, such as central tendency, dispersion, and distribution. Stata provides several commands and functions to generate descriptive statistics, making it a popular choice among researchers, data analysts, and statisticians.
This tutorial is aimed at helping beginners navigate through the process of generating descriptive statistics using Stata. It will cover various aspects such as basic descriptive statistics commands, generating statistics by groups, handling categorical variables, and exporting the results. Additionally, we will highlight resources like the “Stata Descriptive Statistics Tutorial PDF” for further reading and learning.
:max_bytes(150000):strip_icc()/Descriptive_statistics-5c8c9cf1d14d4900a0b2c55028c15452.png)
Table of Contents
ToggleIntroduction to Descriptive Statistics in Stata
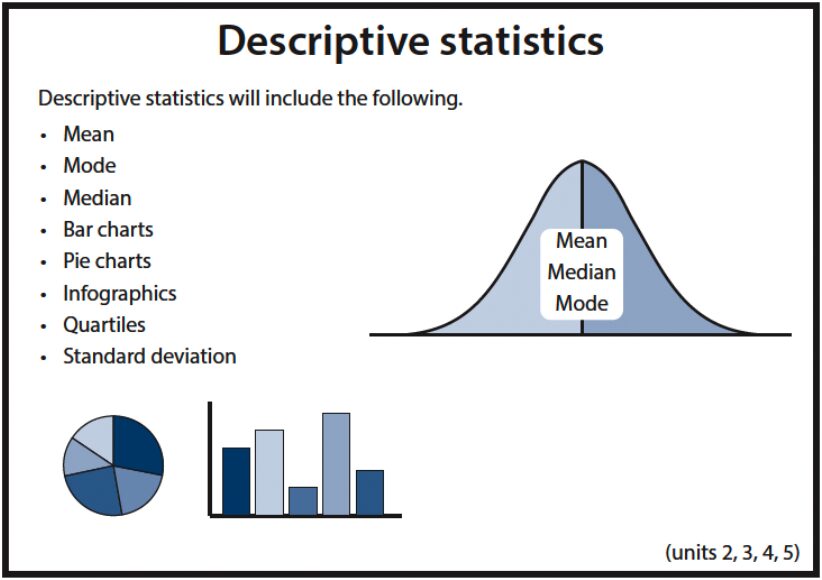
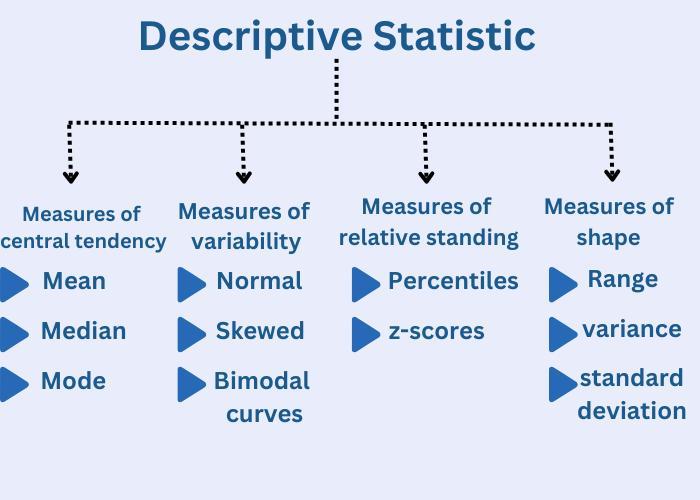
Descriptive statistics in Stata include measures such as the mean, median, standard deviation, variance, minimum, and maximum. These measures provide a snapshot of the data and can be useful for understanding the data’s distribution before performing more complex analyses. Descriptive statistics are often the first step in any data analysis process.
In Stata, there are a variety of commands that allow users to generate these statistics. The most commonly used command is summarize, which provides a summary of the variables in the dataset. Other commands, such as tabulate, table, and describe, also offer descriptive information depending on the user’s needs.
Stata Descriptive Statistics Command
The core command for generating descriptive statistics in Stata is summarize. This command can be used to calculate basic statistics for one or more variables in a dataset. Here’s how to use the summarize command:
summarize varlist
varlist: The list of variables for which you want to generate descriptive statistics.
For example, to generate descriptive statistics for the variables age and income, you would use:
summarize age income
This command will return the following statistics for each variable:
- Mean: The average value of the variable.
- Standard Deviation: A measure of how spread out the values are.
- Minimum: The smallest value in the dataset.
- Maximum: The largest value in the dataset.
- Number of observations: The total number of non-missing values.
If you want more detailed statistics, including percentiles (such as the median), you can use the detail option:
summarize age income, detail
This will provide additional statistics such as:
- Percentiles: The values below which certain percentages of observations fall.
- Variance: A measure of the dispersion of values.
- Skewness: The asymmetry of the distribution.
- Kurtosis: The “tailedness” of the distribution.
Stata Descriptive Statistics by Group
In many research scenarios, you might need to calculate descriptive statistics for different subgroups within the dataset. Stata allows you to do this easily using the by prefix. For instance, if you want to calculate the descriptive statistics of income by gender, you would use:
by gender: summarize income
This command will display the descriptive statistics of income separately for each gender in the dataset. The by prefix is useful for generating statistics for subgroups based on a categorical variable.
If you want more detailed statistics for each group, you can again use the detail option:
by gender: summarize income, detail
This will provide the same detailed statistics (mean, standard deviation, percentiles, etc.) but split by the values of the gender variable.
Stata Descriptive Statistics for Categorical Variables
For categorical variables, you can use the tabulate or table commands to get frequency distributions and proportions. For example, if you have a variable education_level with categories such as “High School”, “Bachelor’s”, “Master’s”, and “PhD”, you can generate a frequency table using:
tabulate education_level
This will show the number and percentage of observations in each category. For a two-way frequency table (i.e., a contingency table), you can use the following command:
tabulate education_level gender
This will provide a cross-tabulation of the education_level and gender variables, showing the counts and percentages for each combination of categories.
Stata Descriptive Statistics Table
When you want to present the results in a table format for better readability, you can use the table command. This command allows you to create a customized table of summary statistics. For example, to generate a table of the mean and standard deviation for income and age by gender, you can use:
table gender, c(mean income mean age sd income sd age)
This will create a table where the mean and standard deviation of income and age are displayed separately for each gender.

Stata Descriptive Statistics Tutorial for Beginners
If you are new to Stata and want to learn more about generating descriptive statistics, there are several resources available, including tutorials and PDFs. The “Stata Descriptive Statistics Tutorial PDF” is a valuable resource for beginners, providing step-by-step instructions and examples.
To begin, it is essential to understand the following key concepts:
- Variables: These are the characteristics or measurements that you are analyzing (e.g., age, income, gender).
- Commands: Stata uses commands to perform specific tasks, such as summarizing data or generating tables.
- Options: Many Stata commands have options that allow you to customize the output, such as adding more detailed statistics or grouping data by a variable.
You can access the Stata help documentation directly in the software by typing:
help summarize
This will display the documentation for the summarize command, including a detailed explanation of the command and its options.
Export Descriptive Statistics in Stata
Once you have generated the descriptive statistics you need, you may want to export the results for further analysis or reporting. Stata provides several options for exporting results to external files, such as text files, Excel, or CSV formats.
One simple way to export the output of a summarize command to a text file is by using the outreg2 command, which is available through the ssc install package. Here’s how to install and use outreg2:
- Install
outreg2:
ssc install outreg2
- Run the
summarizecommand and export the results:
summarize age income, detail

outreg2 using descriptives.txt, replace
This will save the detailed statistics of age and income in a text file called descriptives.txt.
Alternatively, you can use the export excel command to export the results to an Excel file:
export excel using descriptives.xlsx, firstrow(variables) replace
This will save the descriptive statistics in an Excel file named descriptives.xlsx.
Stata Descriptive Statistics for Beginners PDF
For those looking for more comprehensive guidance, you can download a Stata descriptive statistics tutorial PDF that offers detailed examples and explanations. A simple online search for “Stata descriptive statistics tutorial PDF” will provide you with several resources to download and study at your own pace.
These PDFs are often formatted for easy reference and include:
- Step-by-step instructions for using Stata commands
- Sample datasets to practice with
- Screenshots and explanations of output
- Tips and tricks for beginners
The “Stata Descriptive Statistics Tutorial for Beginners” PDF will be especially useful for individuals who are just starting to work with Stata, as it covers all the basics and provides practice exercises.

Conclusion
In this tutorial, we have covered the fundamental aspects of generating descriptive statistics in Stata, including:
- Basic commands like
summarizeandtabulate - Descriptive statistics by group using the
byprefix - Handling categorical variables with
tabulateandtable - Exporting descriptive statistics to external files
Descriptive statistics are an essential first step in data analysis, providing a clear overview of the dataset. By mastering these basic commands and techniques, you can begin to understand the structure of your data and prepare it for more advanced statistical analysis. For more detailed guidance, you can refer to the “Stata Descriptive Statistics Tutorial PDF” and explore the various resources available online.
This tutorial provides a solid foundation for beginners, and with practice, you will become proficient in using Stata to generate and interpret descriptive statistics.
Needs help with similar assignment?
We are available 24x7 to deliver the best services and assignment ready within 3-4 hours? Order a custom-written, plagiarism-free paper
