The AVERAGE Function in Excel: A Comprehensive Guide|2025
Discover how to use the AVERAGE function in Excel to quickly calculate the mean of a dataset. Master this essential tool for efficient data analysis and accurate reporting!
Microsoft Excel is a powerful tool used for data analysis, financial modeling, and statistical calculations. One of the fundamental functions in Excel is the AVERAGE function, which calculates the arithmetic mean of a range of numbers. Understanding how to use this function effectively can help users summarize and analyze data efficiently. This paper explores the AVERAGE function in Excel, advanced variations of the function, and its applications in calculating percentages, grades, and summations.
How to Calculate the AVERAGE Function in Excel
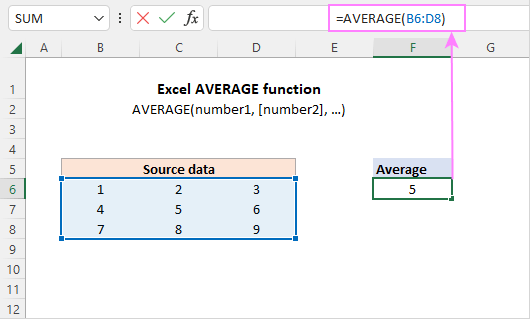
The AVERAGE function in Excel computes the mean of a set of values. The syntax of the function is as follows:
=AVERAGE(number1, [number2], ...)Where:
number1, number2, ...are the numeric values or cell references that the function will average.
Example:
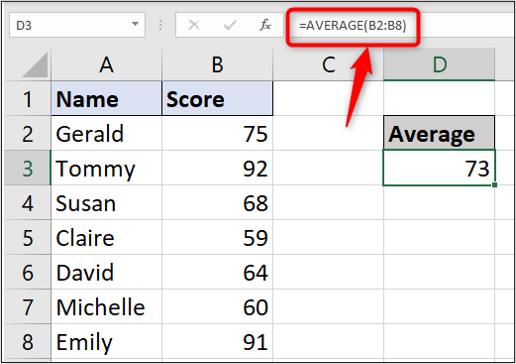
If you have a dataset in cells A1 to A5 with values {10, 20, 30, 40, 50}, you can calculate the average using:
=AVERAGE(A1:A5)The result will be 30, as the sum of the numbers (150) divided by the count of numbers (5) equals 30.
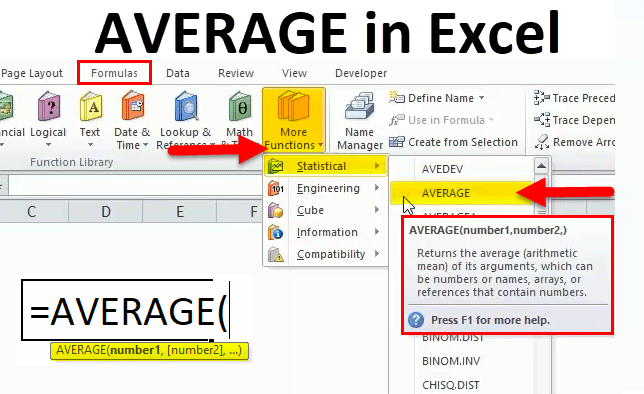
AVERAGE Function in Excel Shortcut
For users who want to quickly apply the AVERAGE function without typing the formula manually, Excel provides shortcuts:
- Select the range of numbers.
- Press Alt + M + U + A (Excel 2013 and later) or Alt + H + A + V.
- Excel will automatically insert the AVERAGE function for the selected range.
Advanced Average Formula in Excel
While the standard AVERAGE function works well for basic calculations, Excel provides advanced techniques to calculate the average based on specific conditions.
Using AVERAGEIF Function in Excel
The AVERAGEIF function allows users to compute the average of values that meet a specific condition. The syntax is:
=AVERAGEIF(range, criteria, [average_range])Example:
If you have a dataset in A1:A10 representing sales figures and B1:B10 representing product categories, you can calculate the average sales for a specific category (e.g., “Electronics”) using:
=AVERAGEIF(B1:B10, "Electronics", A1:A10)This formula calculates the average sales for all rows where the category is “Electronics.”
How to Calculate Average Percentage in Excel
To find the average percentage in Excel, you must correctly compute percentages and then apply the AVERAGE function.
Example:
If a student scores {80%, 90%, 85%, 95%} in four exams (A1:A4), the average percentage is calculated as:
=AVERAGE(A1:A4)This method ensures that the average percentage reflects the arithmetic mean of the values.
Percentage Formula in Excel
Excel provides different methods to calculate percentages. The basic percentage formula is:
= (Part / Total) * 100Example:
If you have a total sales figure of $10,000 in A1 and a specific product sales of $2,500 in A2, the percentage contribution of the product is:
=A2/A1*100This formula calculates that $2,500 contributes 25% to the total sales.
Grade Formula in Excel
In educational institutions, Excel is widely used to compute student grades based on scores.
Example:
If a student’s scores are in B1:B5, and grading criteria are:
- A (90-100)
- B (80-89)
- C (70-79)
- D (60-69)
- F (<60)
You can use the following IF formula to assign grades:
=IF(B1>=90, "A", IF(B1>=80, "B", IF(B1>=70, "C", IF(B1>=60, "D", "F"))))Applying this formula to a column of student scores automatically assigns corresponding grades.
SUM Formula in Excel
The SUM function calculates the total of a range of numbers. The syntax is:
=SUM(number1, [number2], ...)Example:
If values are in cells A1:A5, the total sum is calculated as:
=SUM(A1:A5)This function is often combined with AVERAGE to perform complex calculations.

Conclusion
The AVERAGE function in Excel is a vital tool for statistical and data analysis. By understanding basic and advanced usage, including shortcuts, conditional averages, and percentage calculations, users can improve efficiency in data processing. Additionally, functions like SUM, AVERAGEIF, and IF enhance the flexibility of Excel, making it an indispensable tool for businesses, educators, and analysts alike.
Needs help with similar assignment?
We are available 24x7 to deliver the best services and assignment ready within 3-4 hours? Order a custom-written, plagiarism-free paper
