Understanding Multiple Regression Analysis in STATA: Theory, Implementation, and Interpretation|2025
Master the essentials of Understanding Multiple Regression Analysis in STATA with this detailed guide, covering model setup, interpretation of coefficients, and practical insights for effective data analysis.
Multiple regression analysis is a powerful statistical technique used to explore the relationship between one dependent variable and multiple independent variables. This method is widely utilized in various fields such as economics, social sciences, and healthcare, among others. In this paper, we explore how to conduct multiple regression analysis in STATA, covering both the theoretical aspects and practical steps for implementation. We will also highlight key resources such as PDFs, PPTs, and examples to support learning.
Theoretical Background of Multiple Regression Analysis
Multiple regression is an extension of simple linear regression that involves two or more predictor variables. It allows researchers to assess the impact of several variables on a single dependent variable. The formula for a multiple linear regression model can be expressed as:
Y=β0+β1X1+β2X2+…+βnXn+ϵY = \beta_0 + \beta_1X_1 + \beta_2X_2 + … + \beta_nX_n + \epsilon
Where:
- YY is the dependent variable
- X1,X2,…,XnX_1, X_2, …, X_n are the independent variables
- β0\beta_0 is the intercept
- β1,β2,…,βn\beta_1, \beta_2, …, \beta_n are the coefficients of the independent variables
- ϵ\epsilon is the error term
This equation is fundamental to understanding how each independent variable influences the dependent variable while holding other variables constant.
Multiple Regression Analysis in STATA
Key Commands in STATA
STATA provides a straightforward interface for running multiple regression analyses. The basic command to run a multiple regression is:
Where Y is the dependent variable and X1, X2, X3 are the independent variables.
Additionally, some common variations of this command include:
regress Y X1 X2, robust: To obtain robust standard errors.regress Y X1 X2 X3 if condition: To apply a condition (e.g., certain subset of data).
Conducting Multiple Regression in STATA: Step-by-Step Example
Consider a dataset where Income (Y) is predicted based on Education, Experience, and Age (X1, X2, X3). The steps for analysis are as follows:
- Load the dataset:
- Check the data structure:
- Run the regression:
- Interpret the Output: The STATA output will display the coefficients for each independent variable, standard errors, t-statistics, p-values, and R-squared values.
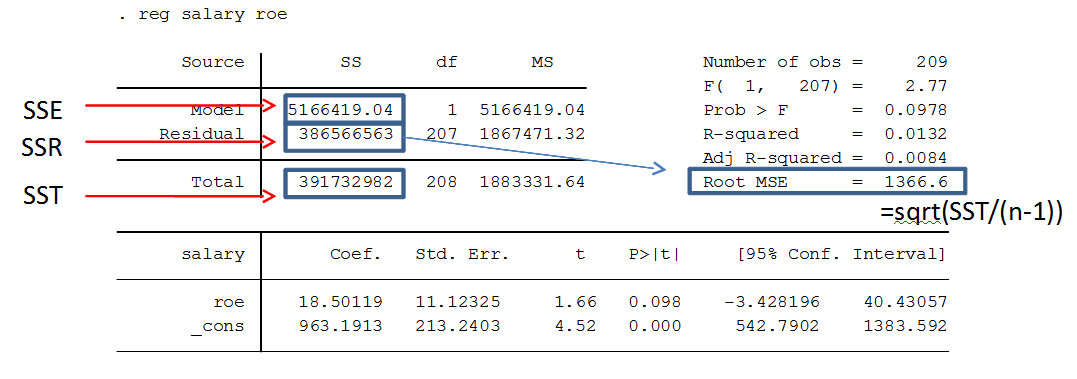
Interpreting STATA Output for Multiple Regression
The output from a multiple regression analysis in STATA includes several important statistics:
- Coefficients: The estimated impact of each independent variable on the dependent variable. For example, if the coefficient for
Educationis 5000, this means that each additional year of education is associated with an increase of 5000 units in income, holding other factors constant. - Standard Errors: Measure the precision of the estimated coefficients.
- t-statistics and p-values: These are used to test the hypothesis that each coefficient is different from zero. A p-value below 0.05 typically indicates statistical significance.
- R-squared: This measures how well the independent variables explain the variation in the dependent variable. A higher R-squared value indicates a better fit.
- Adjusted R-squared: This adjusts the R-squared value to account for the number of predictors used in the model.
Example of Output Interpretation
Here’s an example of a possible output:
In this case:
EducationandExperienceare statistically significant, whileAgeis not.- The model explains 85% of the variation in income, as indicated by the R-squared value.
Multiple Linear Regression vs Multivariate Regression
It’s important to distinguish between multiple linear regression and multivariate regression:
- Multiple linear regression involves multiple independent variables predicting one dependent variable.
- Multivariate regression involves multiple dependent variables, which can be modeled simultaneously.
For instance, if we wanted to predict both Income and Health based on Education, Experience, and Age, this would be a multivariate regression.
Advanced Topics in Multiple Regression
Interaction Effects
STATA allows researchers to model interaction effects, where the effect of one variable on the dependent variable depends on the value of another variable. For example:
This includes an interaction term between X1 and X2, indicating that the effect of X1 may differ depending on the level of X2.
Model Diagnostics
After running the regression, it’s important to check the assumptions of linear regression:
- Linearity: The relationship between the dependent and independent variables should be linear.
- Normality: The residuals should follow a normal distribution.
- Homoscedasticity: The variance of residuals should be constant across all levels of the independent variables.
STATA provides several commands to check these assumptions:
estat ic: To check for information criteria.estat hettest: To test for heteroscedasticity.rvfplot: To plot residuals and check for patterns.
Resources for Learning Multiple Regression in STATA
- Multiple Regression Analysis in STATA PDF: There are many resources available online, such as the official STATA documentation, which offers detailed explanations on regression models.
- Multiple Regression Analysis in STATA PPT: Many online platforms provide PPT presentations to visually explain how to perform multiple regression analysis in STATA.
- Multiple Regression in STATA with SPSS: While STATA and SPSS differ in syntax, both can be used to perform multiple regression. For example, in SPSS, you would use the “Linear Regression” option under the Analyze menu.
- Multiple Regression Analysis in STATA Example: Examples and case studies are helpful in understanding the practical application of the theory. Various datasets such as the “auto.dta” dataset are often used in STATA tutorials.
Conclusion
Multiple regression analysis is a key tool for understanding complex relationships between variables. STATA provides a user-friendly environment for performing these analyses, offering both simplicity and flexibility. By mastering multiple regression in STATA, researchers can unlock deeper insights into the data and make informed decisions based on their findings.
Needs help with similar assignment?
We are available 24x7 to deliver the best services and assignment ready within 3-4 hours? Order a custom-written, plagiarism-free paper
