How to Analyse Likert Scale Data in SPSS|2025
Learn How to Analyse Likert Scale Data in SPSS with expert guidance. Get step-by-step instructions on data coding, interpretation, and statistical analysis to enhance your research results.
Analyzing Likert scale data is a common requirement in social sciences, business, education, and healthcare research. Likert scales allow researchers to measure attitudes, perceptions, and opinions, making them essential for surveys and questionnaires. This guide provides a comprehensive overview of how to analyze Likert scale data using SPSS, including step-by-step instructions, key considerations, and useful tips for researchers.
Understanding Likert Scales
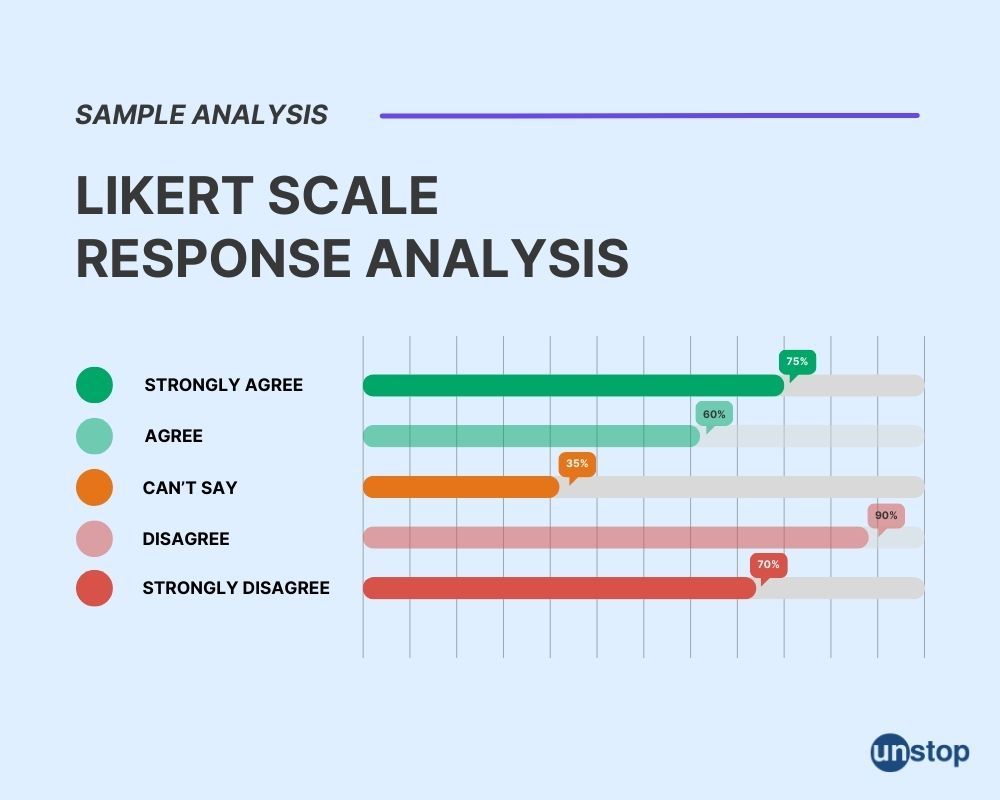
A Likert scale is a psychometric scale commonly used in research to measure attitudes or opinions. Respondents indicate their level of agreement or disagreement with a statement, typically on a 5-point or 7-point scale (e.g., 1 = Strongly Disagree, 5 = Strongly Agree).
Types of Likert Scales:
- Unipolar Scales: Measure intensity in one direction (e.g., “Not at all” to “Extremely”).
- Bipolar Scales: Measure two opposite attitudes (e.g., “Strongly Disagree” to “Strongly Agree”).
Characteristics of Likert Data:
- Often considered ordinal but treated as interval data in advanced statistical analysis.
- Allows for descriptive and inferential statistical methods depending on the research design.
Preparing Likert Scale Data for SPSS
Step 1: Input Data into SPSS
- Open SPSS and create a new dataset.
- Enter survey data into columns, with each column representing a Likert scale question.
- Assign appropriate variable names and labels for clarity.
Step 2: Define Variable Properties
- Click on the “Variable View” tab.
- Specify the Type (e.g., Numeric), Measure (e.g., Ordinal or Scale), and provide Value Labels for each response option.
Step 3: Check for Missing Data
- Run descriptive statistics to identify missing values.
- Use SPSS functions like “Replace Missing Values” or listwise deletion, depending on your analysis requirements.
Techniques for Analyzing Likert Scale Data in SPSS
Descriptive Statistics
Descriptive analysis provides an overview of the data distribution.
- Go to “Analyze > Descriptive Statistics > Frequencies.”
- Select Likert scale variables and generate frequency tables and bar charts.
Reliability Analysis
Assess the internal consistency of Likert scale items using Cronbach’s alpha.
- Navigate to “Analyze > Scale > Reliability Analysis.”
- Add all relevant Likert items to the “Items” box.
- Interpret Cronbach’s alpha (α > 0.7 is generally acceptable).
Factor Analysis
Identify underlying dimensions in Likert scale data.
- Use “Analyze > Dimension Reduction > Factor.”
- Choose Principal Component Analysis (PCA) or Exploratory Factor Analysis (EFA).
- Examine the scree plot and factor loadings.
Inferential Statistics
Depending on the research question, apply inferential tests:
- T-tests: Compare mean scores between two groups.
- “Analyze > Compare Means > Independent Samples T-Test.”
- ANOVA: Compare mean scores across multiple groups.
- “Analyze > Compare Means > One-Way ANOVA.”
- Correlation Analysis: Explore relationships between variables.
- “Analyze > Correlate > Bivariate.”

Handling Common Challenges in Analyzing Likert Scale Data
Challenge 1: Treating Likert Data as Ordinal vs. Interval
- Traditional view: Likert data is ordinal, meaning intervals between points are not necessarily equal.
- Practical approach: Likert data is often treated as interval to apply parametric tests. Ensure this aligns with your research assumptions.
Challenge 2: Managing Skewed Data
- Skewed distributions are common in Likert data.
- Use non-parametric tests like Mann-Whitney U or Kruskal-Wallis when parametric assumptions are violated.
Challenge 3: Combining Items into Composite Scores
- Summing or averaging Likert items is common to create a composite score.
- Ensure all items measure the same construct and have adequate reliability.
Advanced Analysis Techniques for Likert Scale Data
Regression Analysis
- Predict outcomes based on Likert scale data.
- Navigate to “Analyze > Regression > Linear” and input variables.
Cluster Analysis
- Group respondents based on similar patterns of responses.
- Use “Analyze > Classify > K-Means Cluster.”
Structural Equation Modeling (SEM)
- Test complex relationships between variables.
- Use software like AMOS (integrated with SPSS) for SEM analysis.
Practical Tips for Using SPSS with Likert Scale Data
- Use Visualizations: Enhance understanding with bar charts, histograms, and box plots.
- Document Analysis Steps: Keep a detailed record of all steps for transparency and reproducibility.
- Export Results: Use “File > Export” to save tables and graphs for reports.
Conclusion
Analyzing Likert scale data in SPSS requires a mix of foundational knowledge and practical skills. By following structured steps—from data preparation to advanced analysis—researchers can extract meaningful insights. Whether conducting descriptive analysis, reliability checks, or inferential tests, SPSS provides robust tools to handle Likert scale data effectively. With these strategies, you can confidently tackle research projects and make informed decisions based on survey findings.
Needs help with similar assignment?
We are available 24x7 to deliver the best services and assignment ready within 3-4 hours? Order a custom-written, plagiarism-free paper
