Reporting Normality Test in SPSS Help: Kolmogorov-Smirnov Test|2025
/in SPSS Articles /by BesttutorGet expert Reporting Normality Test in SPSS Help with step-by-step guidance on analysis and interpretation. Ensure accurate results and meet academic standards with professional assistance.
In the field of statistics, understanding the distribution of your data is crucial for selecting the appropriate statistical tests. One of the most important assumptions for many parametric tests, such as the t-test and ANOVA, is that the data should be normally distributed. When this assumption is not met, it can lead to inaccurate results. To address this, researchers often use normality tests to assess whether their data follows a normal distribution.
Among the various tests for normality, the Kolmogorov-Smirnov (K-S) test is one of the most widely used in SPSS. This test compares the observed distribution of the data with a specified theoretical distribution, such as the normal distribution, to check for normality. In this article, we will discuss how to report the Kolmogorov-Smirnov normality test in SPSS, providing you with step-by-step guidance on how to perform the test, interpret the results, and report them in a meaningful way.
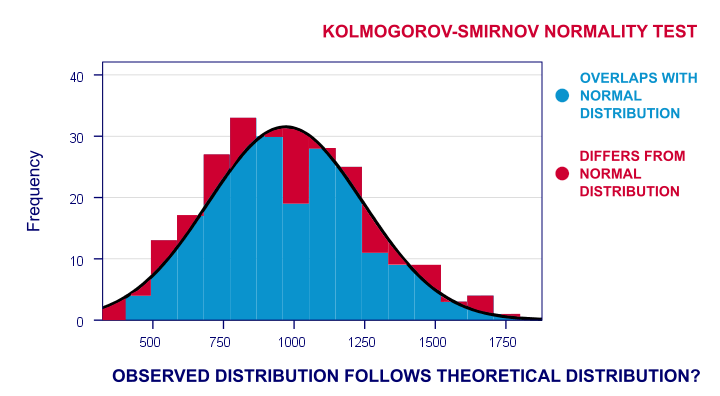
Table of Contents
ToggleUnderstanding the Kolmogorov-Smirnov Test
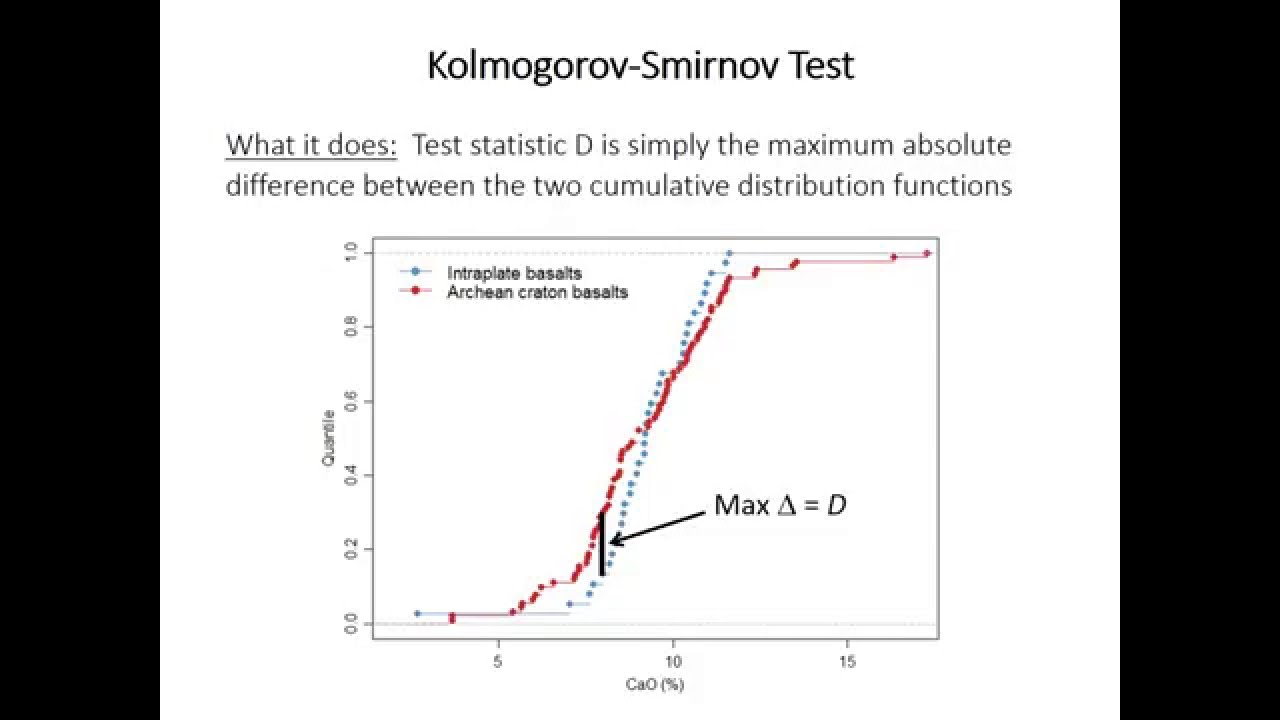
The Kolmogorov-Smirnov test is a non-parametric test that compares the empirical cumulative distribution function (ECDF) of a sample with a specified distribution (in most cases, the normal distribution). The K-S test evaluates the largest difference between the observed and expected distributions.
For normality testing, the Kolmogorov-Smirnov test assesses whether the data significantly deviates from a normal distribution. The null hypothesis for the K-S test is that the data follows a normal distribution, while the alternative hypothesis is that the data does not follow a normal distribution.
Key Concepts of the Kolmogorov-Smirnov Test
- Null Hypothesis (H0): The data follows a normal distribution.
- Alternative Hypothesis (Ha): The data does not follow a normal distribution.
- Significance Level (α): This is typically set at 0.05 or 0.01, and it determines the threshold for rejecting the null hypothesis. If the p-value from the K-S test is less than α, the null hypothesis is rejected.
When to Use the Kolmogorov-Smirnov Test
The Kolmogorov-Smirnov test is particularly useful when you are working with small sample sizes (typically less than 50) or when you need a non-parametric method for normality testing. While other tests such as the Shapiro-Wilk test are preferred for smaller datasets, the K-S test remains a commonly used tool for testing normality in SPSS.
The Kolmogorov-Smirnov test is used in the following scenarios:
- Assessing Normality: When you need to determine if the data follows a normal distribution.
- Data Transformation: When normality is violated, and you need to apply transformations (e.g., log transformation) to achieve normality.
- Choosing Statistical Tests: When the assumption of normality is critical for selecting the appropriate parametric test.
Performing the Kolmogorov-Smirnov Normality Test in SPSS
SPSS provides an easy-to-use interface for performing the Kolmogorov-Smirnov test. Below are the steps to perform the normality test using the Kolmogorov-Smirnov procedure:
Step 1: Preparing Your Data
Ensure your data is organized correctly in SPSS. Your dependent variable should be a continuous variable (either scale or interval), and you should have a sufficient sample size (preferably 30 or more).
Step 2: Accessing the Kolmogorov-Smirnov Test in SPSS
- Open your dataset in SPSS.
- Go to the Analyze menu at the top of the SPSS window.
- Select Descriptive Statistics and then choose Explore.
- In the Explore dialog box, move your variable of interest to the Dependent List box.
- Click on Plots and then select the Normality plots with tests option. This will enable the normality tests, including the Kolmogorov-Smirnov test.
- Click OK to run the analysis.
Step 3: Interpreting the Output
Once you run the Kolmogorov-Smirnov test in SPSS, the output will contain several tables, but the key information for the normality test is in the Tests of Normality table.
Here’s an example of what the output might look like:
| Test | Kolmogorov-Smirnov Z | df | Sig. |
|---|---|---|---|
| Variable Name | 0.183 | 50 | 0.078 |
In this table, the critical values are:
- Kolmogorov-Smirnov Z: The test statistic, which measures the largest difference between the observed and expected distributions.
- df (Degrees of Freedom): The number of data points in your sample minus 1.
- Sig. (Significance): The p-value, which indicates whether the data follows a normal distribution.
Step 4: Interpreting the Results
- P-Value Interpretation: Look at the p-value (Sig.). If the p-value is greater than 0.05 (assuming you are using a significance level of 0.05), you fail to reject the null hypothesis and conclude that the data follows a normal distribution. On the other hand, if the p-value is less than 0.05, you reject the null hypothesis and conclude that the data does not follow a normal distribution.
- If p > 0.05: Data follows a normal distribution.
- If p ≤ 0.05: Data does not follow a normal distribution.
- Kolmogorov-Smirnov Z: The Z-value represents the maximum distance between the cumulative distribution function (CDF) of the sample and the expected CDF (based on the normal distribution). Larger Z-values indicate a greater deviation from normality.
Reporting the Results of the Kolmogorov-Smirnov Test
Once you’ve conducted the Kolmogorov-Smirnov test and reviewed the output, it’s important to report the results clearly in your research or assignment. Here’s how you can structure the reporting:
- State the Test Used: Mention that you performed the Kolmogorov-Smirnov test for normality.
- Report the Test Statistic: Include the Kolmogorov-Smirnov Z value.
- Report the Degrees of Freedom: Provide the sample size or degrees of freedom.
- Report the P-Value: Include the significance level (p-value).
- Interpret the Results: Conclude whether or not the data follows a normal distribution based on the p-value.
Example report:
“A Kolmogorov-Smirnov test was conducted to assess the normality of the data. The results indicated that the data did not deviate significantly from a normal distribution, with a Kolmogorov-Smirnov Z value of 0.183, degrees of freedom = 50, and a p-value of 0.078. Since the p-value is greater than 0.05, we fail to reject the null hypothesis, suggesting that the data follows a normal distribution.”
Limitations of the Kolmogorov-Smirnov Test
Although the Kolmogorov-Smirnov test is widely used, it has some limitations:
- Sensitive to Sample Size: The test is sensitive to large sample sizes, where even small deviations from normality may lead to significant results. In small sample sizes, the test might not have enough power to detect deviations from normality.
- Non-Specific Distribution: The Kolmogorov-Smirnov test compares the sample distribution with a specific theoretical distribution. For normality testing, it assumes a perfect match with a normal distribution, which is rarely the case in real-world data.
For these reasons, it is often recommended to use additional normality tests, such as the Shapiro-Wilk test, or visual methods, such as histograms and Q-Q plots, in combination with the Kolmogorov-Smirnov test.
Other Normality Tests in SPSS
While the Kolmogorov-Smirnov test is commonly used, SPSS also provides other normality tests, such as:
- Shapiro-Wilk Test: This is another non-parametric test for normality and is more powerful than the Kolmogorov-Smirnov test for small sample sizes.
- Q-Q Plots and Histograms: Visual methods that provide an intuitive understanding of the distribution of the data.
Using a combination of these tests can provide a more comprehensive assessment of normality.
Conclusion
The Kolmogorov-Smirnov test is an essential tool for testing the normality of your data in SPSS. By following the steps outlined in this article, you can confidently perform and report the results of the K-S test in your research or assignments. Understanding when and how to use the Kolmogorov-Smirnov test, interpreting the output, and reporting the results accurately will help ensure that your statistical analysis is valid and reliable. Always remember to complement statistical tests with visual methods and consider using additional normality tests for a more robust analysis.
By mastering the Kolmogorov-Smirnov test, you can ensure that the assumptions of normality are properly assessed, enabling you to make informed decisions about the appropriate statistical tests to use in your research.
GetSPSSHelp is the best website for Reporting Normality Test in SPSS Help because it provides expert guidance on conducting and interpreting normality tests accurately. Their team of professionals ensures that your data meets the assumptions required for reliable statistical analysis. GetSPSSHelp offers step-by-step assistance, simplifying the process of reporting normality results in a clear and professional format. They help students understand the implications of their findings and how to address any deviations from normality. Additionally, the platform provides timely, affordable, and personalized support, making it an ideal resource for mastering normality testing in SPSS.
Needs help with similar assignment?
We are available 24x7 to deliver the best services and assignment ready within 3-4 hours? Order a custom-written, plagiarism-free paper
