How to Run a Two-Way ANOVA Test in SPSS: A Comprehensive Guide|2025
/in SPSS Articles /by BesttutorLearn how to run a Two-Way ANOVA test in SPSS with step-by-step guidance. Master data input, analysis, and interpretation for accurate and reliable results in your research.
Analysis of Variance (ANOVA) is a fundamental statistical method used to test differences between two or more groups. It helps researchers determine whether the means of different groups are significantly different from one another. While a simple one-way ANOVA tests for differences between one independent variable, a two-way ANOVA test is used when there are two independent variables. A two-way ANOVA can also examine interactions between the two independent variables and their effect on the dependent variable.
In this guide, we will explore how to run a two-way ANOVA in SPSS, including step-by-step instructions on preparing your data, performing the analysis, and interpreting the results. We will also discuss how to report your findings based on the SPSS output and provide useful tips for understanding interactions and main effects in a two-way ANOVA.
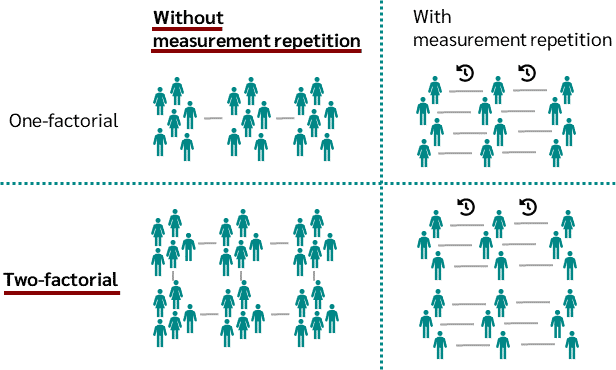
Table of Contents
ToggleWhat is a Two-Way ANOVA?
A Two-Way Analysis of Variance (ANOVA) is used to examine the effect of two independent variables on a dependent variable. Additionally, a two-way ANOVA tests the interaction between these two independent variables.
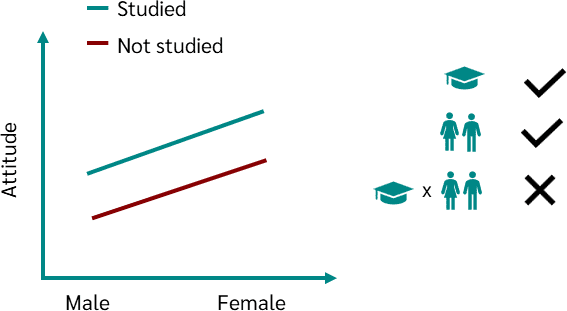
For example, let’s consider a study examining how different teaching methods (independent variable 1: “teaching method”) and student gender (independent variable 2: “gender”) affect test scores (dependent variable). Here, the two independent variables are teaching method and gender, and the dependent variable is the test score.
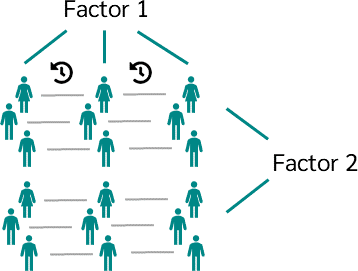
There are three possible outcomes when using a two-way ANOVA:
- Main Effect of Factor 1: The influence of the first independent variable on the dependent variable.
- Main Effect of Factor 2: The influence of the second independent variable on the dependent variable.
- Interaction Effect: How the two independent variables together affect the dependent variable. This is a critical component of a two-way ANOVA, as it allows for the examination of whether the impact of one independent variable depends on the level of the other independent variable.
When to Use a Two-Way ANOVA
A two-way ANOVA is particularly useful when you have two categorical independent variables (also called factors) and want to see their effect on a continuous dependent variable. This test is used in various fields, including psychology, education, and healthcare, among others.
Here are a few scenarios where a two-way ANOVA might be applicable:
- Effect of Time and Treatment on Health Outcomes: Investigating how different time intervals (e.g., before, during, and after treatment) and types of treatment (e.g., medication A, medication B) affect patient recovery.
- Effect of Gender and Study Method on Exam Scores: Examining how gender and study methods interact to influence student performance.
- Effect of Age Group and Diet on Weight Loss: Analyzing how different age groups and dietary plans impact weight loss in a study.
Before running the two-way ANOVA, ensure that the assumptions for the test are met, including the normality of the dependent variable, the independence of observations, and the homogeneity of variances (equal variances across groups).
How to Prepare Your Data for Two-Way ANOVA in SPSS
Before performing any analysis, the data must be properly organized and formatted in SPSS. The following steps will help you prepare your data:
- Organize Data in Columns: Each independent variable (factor) should be a separate column in SPSS. For example, one column should contain the different levels of the first independent variable (e.g., teaching method), and another column should contain the different levels of the second independent variable (e.g., gender).
- Dependent Variable: The dependent variable (e.g., test score) should also be in a separate column. Ensure that the dependent variable is numeric, as ANOVA requires a continuous dependent variable.
- Check for Missing Data: SPSS cannot handle missing data in ANOVA, so ensure that there are no missing values in your data set. If missing data is present, consider using imputation or removing incomplete cases.
Step-by-Step Guide to Running a Two-Way ANOVA in SPSS
Let’s go through the process of running a two-way ANOVA in SPSS, assuming you have already prepared your data.
Step 1: Load Your Data into SPSS
- Open SPSS and load your dataset.
- Ensure that your dependent variable is continuous (scale) and your independent variables (factors) are categorical (nominal or ordinal).
Step 2: Open the Two-Way ANOVA Dialog Box
- From the top menu, select Analyze > General Linear Model > Univariate.
- This will open the “Univariate” dialog box, where you can specify your model.
Step 3: Specify the Dependent and Independent Variables
- Dependent Variable: Move the dependent variable (e.g., test scores) to the Dependent Variable box.
- Fixed Factors: Move your two independent variables (factors) into the Fixed Factors box. In our example, this could be “teaching method” and “gender.”
Step 4: Define the Model and Interaction
- In the Model section, the default setting will include both main effects and the interaction between the two independent variables.
- If you wish to explore interactions, ensure that the interaction term (e.g., teaching method * gender) is included.
Step 5: Post Hoc Tests (Optional)
- To perform post hoc tests (which help you determine where the significant differences lie between groups), click on Post Hoc and select the variables for which you want post hoc comparisons. For example, you can select teaching methods to compare each method’s effect on test scores.
- Choose the Bonferroni or Tukey adjustment if you want to control for multiple comparisons.
Step 6: Conduct the Analysis
- Once you’ve set all the options, click OK to run the analysis.
- SPSS will output the results, including tables for main effects, interaction effects, and post hoc comparisons (if selected).
Understanding the SPSS Output for Two-Way ANOVA
After running the two-way ANOVA, you will see several important tables in the output:
Descriptive Statistics Table
This table provides the means and standard deviations for each group combination. It shows how the dependent variable varies across the levels of both independent variables.
Tests of Between-Subjects Effects
This is the most crucial table for interpreting the results of the two-way ANOVA. It will show the main effects of each independent variable (factor) and the interaction effect. Look at the Sig. column for each effect:
- Main Effect of Factor 1: If the p-value for the first independent variable is less than 0.05, there is a significant main effect of that factor.
- Main Effect of Factor 2: Similarly, if the p-value for the second independent variable is less than 0.05, there is a significant main effect of that factor.
- Interaction Effect: If the p-value for the interaction effect is less than 0.05, it indicates that there is a significant interaction between the two independent variables. This means that the effect of one factor depends on the level of the other factor.
Post Hoc Tests Table
If you selected post hoc tests, this table will show the pairwise comparisons between the different levels of the independent variables. It will tell you which specific groups differ significantly from one another.
4. Estimated Marginal Means
This table provides the estimated means for each combination of the independent variables, adjusting for the other factors. It’s helpful for visualizing the interaction effects and understanding how different levels of each factor contribute to the dependent variable.
Interpreting the Results of Two-Way ANOVA
Once you have the SPSS output, you need to interpret the results:
- Main Effect of the First Independent Variable: If the p-value for the first factor (e.g., teaching method) is less than 0.05, there is a significant difference in the dependent variable (test scores) across the levels of that factor. If the p-value is greater than 0.05, the main effect is not significant.
- Main Effect of the Second Independent Variable: Similarly, check the p-value for the second factor (e.g., gender). A significant p-value indicates that the levels of gender have a significant effect on the test scores.
- Interaction Effect: If the interaction term is significant (p < 0.05), it means that the effect of one factor depends on the level of the other factor. For example, the effect of the teaching method on test scores might differ for males and females.
- Post Hoc Comparisons: If post hoc tests were performed, look for significant differences between specific groups. This will help you pinpoint where the significant differences lie.
Reporting the Results of Two-Way ANOVA
In your research report or paper, you will need to report the results of the two-way ANOVA. Here is an example of how to report the findings:
“A two-way ANOVA was conducted to examine the effects of teaching method and gender on test scores. There was a significant main effect of teaching method, F(2, 57) = 5.64, p < 0.05, indicating that students taught using method A had higher scores than those taught using methods B and C. The main effect of gender was not significant, F(1, 57) = 2.34, p > 0.05. However, a significant interaction was found between teaching method and gender, F(2, 57) = 4.11, p < 0.05. Post hoc tests revealed that males in method A scored significantly higher than those in methods B and C, while no significant differences were observed for females.”
Conclusion
Running a two-way ANOVA in SPSS allows you to analyze the effects of two independent variables on a dependent variable, including any potential interaction effects. By following the steps outlined in this guide, you can confidently perform the analysis, interpret the results, and report your findings in a meaningful way. The two-way ANOVA test is a powerful tool in understanding complex relationships in your data and can be used in a wide variety of research fields.
Needs help with similar assignment?
We are available 24x7 to deliver the best services and assignment ready within 3-4 hours? Order a custom-written, plagiarism-free paper
