How to Run Friedman Test in SPSS|2025
Learn How to Run Friedman Test in SPSS with our step-by-step guide. Perfect for analyzing non-parametric data and comparing multiple related samples. Master SPSS today!
The Friedman test is a non-parametric alternative to the repeated-measures ANOVA and is used to detect differences in treatments across multiple test attempts when the data is ordinal. Unlike ANOVA, it does not assume normality in the data. This paper provides a comprehensive guide on how to run the Friedman test in SPSS, with practical examples, interpretation, and reporting guidelines following APA format.
When to Use the Friedman Test
The Friedman test is used when:
- You have one independent variable with three or more related groups (matched or repeated measures).
- The dependent variable is measured on an ordinal scale.
- The assumptions of repeated-measures ANOVA (normality) are violated.
- The same participants are tested under different conditions.
How to Run Friedman Test in SPSS
Step 1: Enter the Data
Before running the Friedman test in SPSS, you need to structure your data appropriately. Assume you conducted a study measuring customer satisfaction (on a scale of 1 to 5) for three different shopping websites (A, B, and C). Each participant rated all three websites.
- Open SPSS and enter the data in the Data View.
- Structure the data with columns representing different conditions (e.g., “Website_A”, “Website_B”, “Website_C”).
- Each row represents a participant’s ratings for all three websites.
| Participant | Website_A | Website_B | Website_C |
|---|---|---|---|
| 1 | 3 | 4 | 5 |
| 2 | 2 | 3 | 4 |
| 3 | 4 | 5 | 5 |
| 4 | 3 | 3 | 4 |
| 5 | 5 | 4 | 5 |
Step 2: Running the Friedman Test
- Click on Analyze in the SPSS menu.
- Select Nonparametric Tests > Related Samples.
- In the “Objective” tab, select Customize Analysis.
- Click on the “Fields” tab and move the dependent variables (Website_A, Website_B, Website_C) into the “Test Fields” box.
- In the “Settings” tab, choose Friedman test.
- Click Run.
SPSS will perform the Friedman test and display the results in the output window.
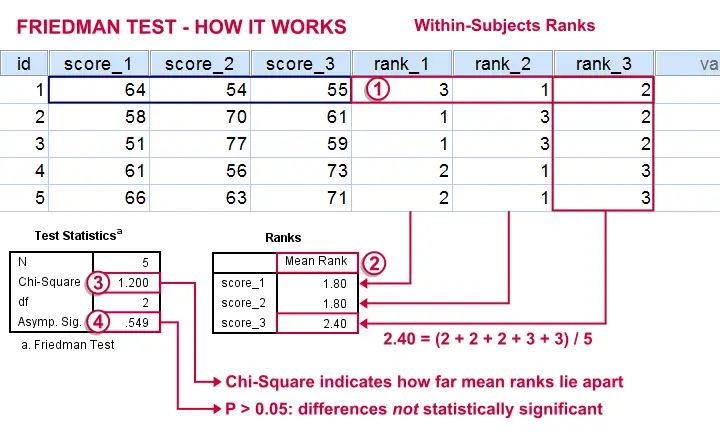
How to Interpret Friedman Test Results
Once the test is run, SPSS provides the test statistic and significance value.
- Chi-Square Value (χ²): The test statistic which determines if there are differences among the groups.
- Degrees of Freedom (df): The number of groups minus one (k-1).
- p-value: If p < 0.05, reject the null hypothesis, indicating a significant difference among the conditions.
Example Output Interpretation
SPSS Output Example:
Friedman Test

N = 5
Chi-Square = 6.400
df = 2
p = 0.041
Interpretation:
- The p-value (0.041) is less than 0.05, meaning there is a statistically significant difference in customer satisfaction across the three websites.
How to Report Friedman Test Results in APA Format
When reporting the Friedman test results in APA format, follow this structure:
Example APA report: “A Friedman test was conducted to evaluate differences in customer satisfaction ratings across three websites. The test was statistically significant, χ²(2) = 6.40, p = .041, indicating a significant difference in satisfaction scores.”
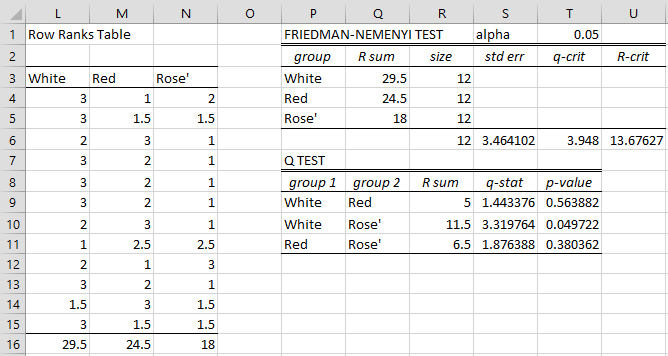
If post-hoc pairwise comparisons are conducted, report them using the Wilcoxon Signed-Rank Test with a Bonferroni correction.
Friedman Test Example Problems
Problem 1
A researcher wants to determine if three different teaching methods (Lecture, Video, Interactive) affect students’ test scores. A group of 10 students is tested under each method. The researcher collects the scores and applies the Friedman test.
Problem 2
A company tests three different advertising strategies to determine which leads to the highest customer engagement. Customers rate each advertisement, and the Friedman test is used to analyze differences in ratings.
Friedman Test Formula
The Friedman test statistic (χ²) is calculated using:
where:
- n = number of subjects,
- k = number of conditions,
- R = sum of ranks for each condition.
Conclusion
The Friedman test is a useful statistical method when dealing with ordinal data and repeated measures. SPSS provides an easy way to conduct this test, interpret results, and report findings in APA format. By following the steps outlined in this paper, researchers can effectively apply the Friedman test to their studies and derive meaningful conclusions.
Needs help with similar assignment?
We are available 24x7 to deliver the best services and assignment ready within 3-4 hours? Order a custom-written, plagiarism-free paper
