How to Run an Independent Sample T-Test in SPSS|2025
/in SPSS Articles /by BesttutorLearn How to Run an Independent Sample T-Test in SPSS with step-by-step instructions. Understand assumptions, analyze group differences, and interpret results easily.
The independent sample t-test is a statistical method used to compare the means of two independent groups to determine whether there is a significant difference between them. This test is essential in various fields, including psychology, education, medicine, and social sciences, where researchers need to analyze differences between two groups, such as treatment vs. control groups, male vs. female participants, or pre-test vs. post-test results. In this guide, we will explore how to run an independent sample t-test in SPSS, providing a step-by-step explanation along with examples. Additionally, we will discuss the interpretation of results, related concepts like the paired sample t-test, and provide downloadable resources.
Table of Contents
ToggleUnderstanding the Independent Sample T-Test
The independent sample t-test compares the means of two independent (unrelated) groups. For example, comparing the test scores of two groups of students, one that received a particular teaching method and another that received a traditional method. The null hypothesis (H0) assumes that there is no significant difference between the group means, while the alternative hypothesis (H1) assumes that there is a significant difference.
Assumptions of the Independent Sample T-Test
Before running an independent sample t-test in SPSS, it is crucial to check the assumptions of the test:
- Independence of observations: The two groups must be independent of each other, meaning no participant should belong to both groups.
- Normality: The data in each group should follow a normal distribution. This assumption can be checked using graphical methods (e.g., histograms, Q-Q plots) or statistical tests (e.g., Shapiro-Wilk test).
- Homogeneity of variance: The variances in the two groups should be equal. This assumption can be tested using Levene’s Test for Equality of Variances.
Steps to Run an Independent Sample T-Test in SPSS
Step 1: Entering Data in SPSS
Before running any analysis in SPSS, you must enter your data into the software. The data should be organized with one column representing the dependent variable (e.g., test scores) and another column representing the grouping variable (e.g., group 1 or group 2).
For example:
| Group | Test Scores |
|---|---|
| 1 | 85 |
| 1 | 90 |
| 2 | 88 |
| 2 | 92 |
In this table, “Group” represents the independent variable, and “Test Scores” is the dependent variable. Group 1 and Group 2 represent the two independent groups being compared.
Step 2: Running the T-Test in SPSS
- Open your dataset in SPSS.
- Click on Analyze in the top menu, then select Compare Means, and choose Independent-Samples T Test.
- In the dialog box that appears, select the dependent variable (e.g., Test Scores) and move it to the Test Variable(s) box.
- Select the grouping variable (e.g., Group) and move it to the Grouping Variable box.
- Click on Define Groups, and specify the values that represent the two groups. For example, if your groups are coded as 1 and 2, enter “1” and “2” in the Group 1 and Group 2 fields, respectively.
- Click OK to run the analysis.
Step 3: Interpreting the Output
After running the t-test, SPSS will generate an output with several important sections. Key results to focus on include:
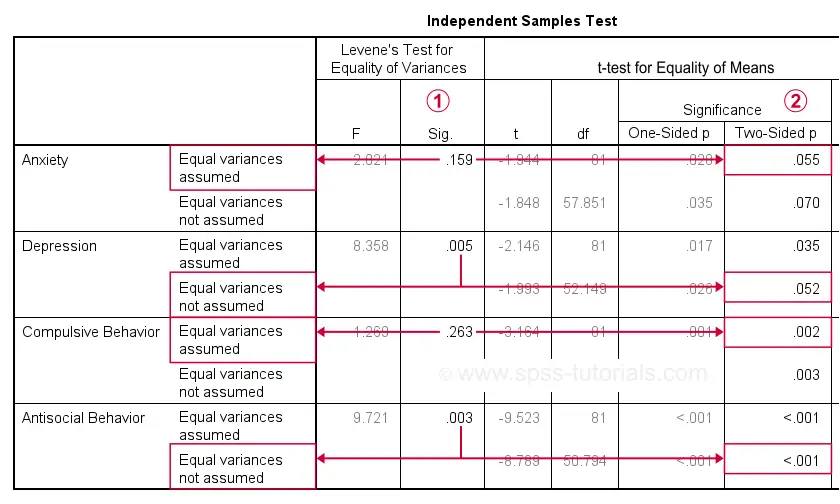
1. Levene’s Test for Equality of Variances
Levene’s test tests the assumption of homogeneity of variances. If the p-value of Levene’s test is less than 0.05, this indicates that the variances are significantly different, and you should use the results from the “Equal variances not assumed” row. If the p-value is greater than 0.05, then the assumption is met, and you can use the “Equal variances assumed” row.
2. T-Test Results
The t-test output will include the following information:
- t-value: This is the test statistic, which is the ratio of the difference between group means to the variability of the groups.
- df (degrees of freedom): The degrees of freedom for the test, calculated as the total number of observations minus the number of groups.
- Sig. (2-tailed): The p-value, which indicates whether the difference between the groups is statistically significant. If the p-value is less than 0.05, the null hypothesis is rejected, and we conclude that there is a significant difference between the two groups.
3. Confidence Interval
SPSS also provides a 95% confidence interval for the difference in means. If the confidence interval does not include zero, this suggests that the difference is statistically significant.
Example Output
| Group | N | Mean | Std. Deviation | Std. Error Mean |
|---|---|---|---|---|
| 1 | 50 | 85.4 | 7.1 | 1.0 |
| 2 | 50 | 90.2 | 6.8 | 0.9 |
| Levene’s Test for Equality of Variances | t-value | df | Sig. (2-tailed) | Mean Difference | Std. Error Difference |
|---|---|---|---|---|---|
| Equal variances assumed | -3.36 | 98 | 0.001 | -4.8 | 1.4 |
In this example, the p-value of Levene’s test (0.001) suggests that the assumption of equal variances is violated, so we look at the row “Equal variances not assumed.” The p-value of the t-test (0.001) is less than 0.05, indicating a significant difference between the means of the two groups.
Step 4: Reporting the Results
Based on the output, the results can be reported as follows:
- Levene’s Test: Levene’s test for equality of variances was significant (p = 0.001), indicating that the assumption of equal variances was violated.
- Independent t-test: An independent samples t-test revealed that there was a significant difference between the two groups, t(97) = -3.36, p = 0.001. The mean score for Group 1 (M = 85.4) was significantly lower than that of Group 2 (M = 90.2).
How to Run Independent Sample T-Test in SPSS Using SPSS Syntax
SPSS allows for the use of syntax commands to perform statistical analyses. This can be helpful for automation or reproducibility of results.
Here is an example of the syntax for running an independent sample t-test:
T-TEST GROUPS=group(1,2)

/VARIABLES=test_scores

/MISSING=ANALYSIS.
This command tells SPSS to perform a t-test comparing the variable test_scores between the two groups coded as 1 and 2. The /MISSING=ANALYSIS option tells SPSS to exclude cases with missing data from the analysis.
Paired Sample T-Test vs. Independent Sample T-Test
While the independent sample t-test compares the means of two independent groups, the paired sample t-test is used when the same subjects are measured under two different conditions, such as before and after a treatment. The paired sample t-test is also available in SPSS under Analyze > Compare Means > Paired-Samples T Test.
The main difference between the two tests lies in the data structure. In the independent sample t-test, the groups are independent of one another, while in the paired sample t-test, the data points are related or matched in some way.
Example of Paired Sample T-Test:
| Subject | Pre-test | Post-test |
|---|---|---|
| 1 | 45 | 55 |
| 2 | 50 | 60 |
To perform a paired sample t-test in SPSS, select Analyze > Compare Means > Paired-Samples T Test, then define the two variables (e.g., Pre-test and Post-test).
Independent Sample T-Test Interpretation
Interpreting the results of an independent sample t-test involves examining the p-value, t-value, and confidence interval:
- t-value: A higher t-value indicates a larger difference between the group means relative to the variability within groups.
- p-value: If the p-value is less than 0.05, you can reject the null hypothesis and conclude that there is a significant difference between the groups.
- Confidence Interval: The 95% confidence interval for the difference in means provides a range of values within which the true difference is likely to fall. If zero is not within this interval, it suggests a significant difference between the groups.

Conclusion
Running an independent sample t-test in SPSS is straightforward once you have your data properly organized. The process involves entering data, running the analysis, and interpreting the results. By following the steps outlined in this guide, you can confidently perform and interpret t-tests in SPSS for a variety of research questions.
Needs help with similar assignment?
We are available 24x7 to deliver the best services and assignment ready within 3-4 hours? Order a custom-written, plagiarism-free paper
