Tips for Mastering SAGE Business Intelligence Tools|2025
Discover essential tips for mastering SAGE Business Intelligence tools. Learn strategies to optimize data analysis, reporting, and decision-making with SAGE BI.
SAGE Business Intelligence (BI) tools are powerful solutions designed to help businesses analyze data, generate reports, and make informed decisions. Mastering these tools is crucial for businesses aiming to gain insights into their operations, optimize performance, and maintain a competitive edge. This paper provides comprehensive tips on effectively utilizing SAGE BI tools, covering data management, report generation, dashboard customization, automation, and advanced analytics.
Understanding SAGE Business Intelligence (BI) Tools
SAGE BI tools integrate with SAGE ERP systems and other data sources to provide real-time insights into business performance. These tools allow businesses to:
- Access key performance indicators (KPIs)
- Generate and customize reports
- Perform predictive analytics
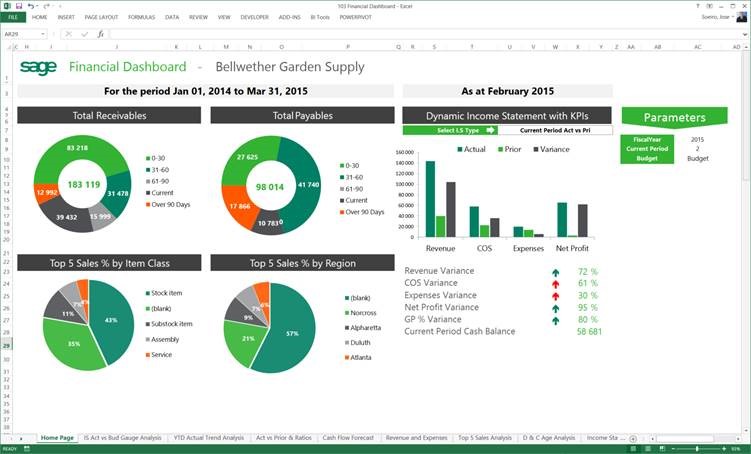
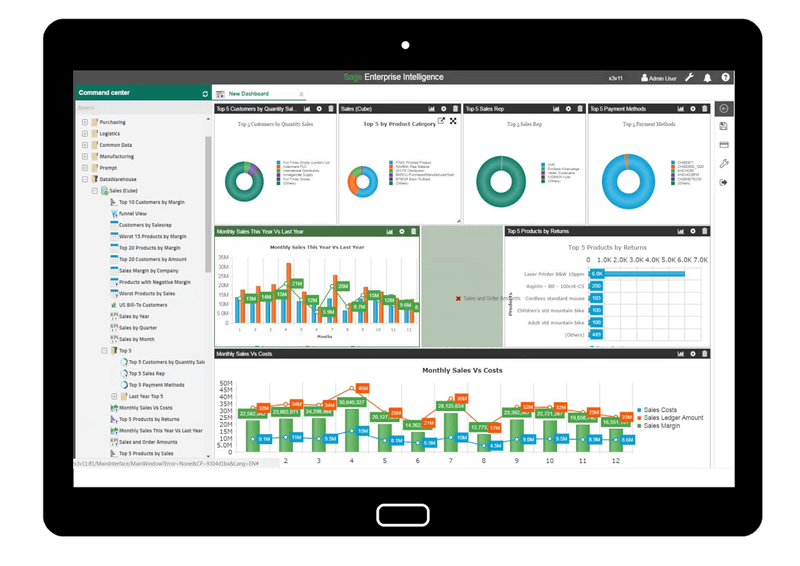
- Visualize data through dashboards
- Automate data collection and analysis
To leverage SAGE BI effectively, users need to understand its key functionalities and how to apply them to their specific business needs.
Getting Started with SAGE BI Tools
Familiarize Yourself with the Interface
Before diving into complex analyses, take the time to explore the user interface. Key elements include:
- Navigation panel: Access different modules such as reports, dashboards, and data sources.
- Toolbar: Contains options for filtering, exporting, and formatting data.
- Workspace: Where users interact with reports, dashboards, and data visualization tools.
Understanding the interface enhances usability and efficiency when working with SAGE BI tools.
Configure User Access and Permissions
SAGE BI tools offer role-based access control. To maintain data security and streamline operations:
- Assign different access levels based on user roles (e.g., administrator, analyst, viewer).
- Restrict sensitive financial or operational data to authorized personnel.
- Regularly review and update permissions as organizational needs evolve.
Data Management Best Practices
Ensure Data Accuracy and Consistency
Data integrity is critical for meaningful analysis. To maintain accuracy:
- Regularly update and validate data sources.
- Standardize data entry procedures across departments.
- Remove duplicate or erroneous entries to avoid inconsistencies.
Integrate Multiple Data Sources
SAGE BI allows integration with multiple data sources, including SAGE ERP, CRM, and external databases. To maximize insights:
- Use connectors to link different data repositories.
- Map data fields correctly to ensure seamless integration.
- Test data synchronization to confirm accurate merging of information.
Optimizing Report Generation
Utilize Pre-Built Reports
SAGE BI provides a variety of pre-built reports for common business needs, such as:
- Financial statements (balance sheets, income statements)
- Sales and inventory reports
- Operational performance metrics
Leveraging these templates saves time and ensures standardized reporting.
Customize Reports for Specific Business Needs
To tailor reports for unique business requirements:
- Apply filters to focus on specific time periods, departments, or regions.
- Use calculated fields to create custom metrics (e.g., profit margins, customer retention rates).
- Group data logically to improve readability and insights.
Automate Report Scheduling
Manually generating reports can be time-consuming. Automate report generation by:
- Setting up scheduled reports to run at specified intervals (daily, weekly, monthly).
- Sending reports automatically via email to relevant stakeholders.
- Configuring alerts for critical metrics that require immediate attention.
Enhancing Dashboards for Better Insights
Customize Dashboards for Different Users
Different stakeholders require different insights. Customize dashboards by:
- Creating executive dashboards with high-level financial and operational KPIs.
- Designing sales dashboards for monitoring revenue, conversions, and pipeline activity.
- Developing operational dashboards to track supply chain and inventory performance.
Use Visualizations Effectively
Data visualization enhances comprehension and decision-making. Best practices include:
- Using charts and graphs to illustrate trends and patterns.
- Employing heat maps for comparative data analysis.
- Avoiding clutter by displaying only essential information on a single screen.
Implement Real-Time Data Tracking
Real-time dashboards provide up-to-date insights that drive quick decision-making. To implement:
- Ensure data sources support real-time synchronization.
- Set up alerts for anomalies, such as sudden drops in revenue or spikes in expenses.
- Use drill-down features to explore data at different levels of granularity.
Leveraging Advanced Analytics
Utilize Predictive Analytics
SAGE BI includes predictive analytics capabilities that help forecast future trends. To make the most of predictive analytics:
- Use historical data to model future outcomes.
- Apply machine learning algorithms to detect patterns.
- Conduct scenario analysis to plan for different business conditions.
Implement Data Mining Techniques
Data mining helps uncover hidden patterns and relationships. Key techniques include:
- Clustering for segmenting customers based on purchasing behavior.
- Association rule learning to identify product bundles frequently bought together.
- Regression analysis for determining key drivers of business performance.
Benchmark Performance Against Industry Standards
Comparing performance against industry benchmarks helps identify strengths and weaknesses. Use SAGE BI tools to:
- Gather industry data for benchmarking purposes.
- Create comparative reports showing business performance versus competitors.
- Adjust strategies based on insights gained from benchmarking analyses.
Automating Workflows and Processes
Streamline Data Entry and Collection
Manual data entry increases errors and inefficiencies. Automate processes by:
- Using integration tools to pull data from ERP and CRM systems.
- Setting up data validation rules to prevent inaccurate entries.
- Automating data cleaning procedures to remove inconsistencies.
Implement Workflow Automation
Workflow automation enhances efficiency by reducing manual intervention. To implement:
- Create rule-based workflows for approvals, notifications, and escalations.
- Use automation to trigger reports and alerts based on predefined conditions.
- Integrate BI tools with business process management (BPM) solutions.
Enable Mobile Access for On-the-Go Decision Making
SAGE BI supports mobile access, allowing users to view reports and dashboards remotely. To optimize mobile usage:
- Configure dashboards for mobile-friendly viewing.
- Use cloud-based access for real-time data retrieval.
- Enable push notifications for key business alerts.
Conclusion
Mastering SAGE Business Intelligence (BI) tools empowers businesses to optimize data analysis, enhance decision-making, and improve operational efficiency. By understanding the interface, ensuring data integrity, customizing reports and dashboards, leveraging advanced analytics, and automating workflows, organizations can unlock the full potential of SAGE BI. Continuous learning and adapting to evolving business needs will ensure that users stay ahead in a data-driven world.
Needs help with similar assignment?
We are available 24x7 to deliver the best services and assignment ready within 3-4 hours? Order a custom-written, plagiarism-free paper
