Data Cleaning and Preparation Challenges in SPSS|2025
Introduction
Data analysis begins with data collection, but its reliability and accuracy hinge on how well the data is cleaned and prepared. Before any statistical procedure can be conducted, it is critical to ensure that the data used is accurate, complete, and properly formatted. In this article, we explore the challenges researchers and data analysts face during data cleaning and preparation in SPSS (Statistical Package for the Social Sciences), and how to overcome them.
Importance of Data Cleaning and Preparation
The validity of statistical analysis largely depends on the quality of input data. Dirty or unprepared data can lead to incorrect conclusions, misleading statistical significance, or skewed descriptive statistics. Data cleaning and preparation are vital for:
-
Enhancing data integrity
-
Minimizing errors in analysis
-
Making datasets analysis-ready
-
Saving time in long-term data processing
Data preparation sets the foundation for credible findings, especially in fields like healthcare, social sciences, business intelligence, and market research.
Overview of SPSS in Data Management
SPSS is a widely-used statistical software suite developed by IBM. Known for its user-friendly interface and advanced statistical capabilities, SPSS is popular in academic, government, and corporate sectors. SPSS allows for a seamless transition from raw data to insightful analysis, provided the data is clean and well-prepared.
The SPSS Data Editor is split into two views: Data View and Variable View. The former allows users to see and manipulate raw data, while the latter provides metadata management such as variable names, labels, types, and measurement levels.
Common Data Cleaning and Preparation Challenges in SPSS
Inconsistent Data Formats
Data can be entered in multiple formats, especially when derived from different sources. For example, dates might appear as “01/01/2023”, “2023-01-01”, or “Jan 1, 2023”. SPSS requires consistent formatting for analysis; otherwise, errors or misinterpretations can occur.
Missing Data
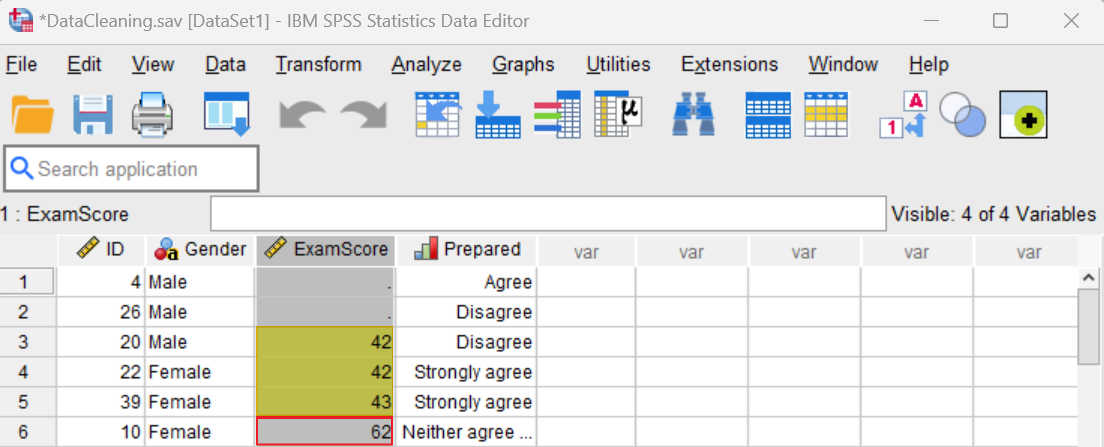
Missing values are a pervasive problem in real-world datasets. SPSS recognizes blank entries or user-defined missing values but handling them appropriately is not always straightforward. Unmanaged missing data can bias results or reduce statistical power.
Duplicate Entries
Duplicated responses in survey data or observational studies inflate sample sizes and can lead to erroneous statistical interpretations. Identifying and removing duplicates manually is time-consuming and error-prone.
Outliers and Anomalies
Outliers can distort means, inflate standard deviations, and skew regression models. In SPSS, identifying outliers requires multiple steps, such as visualizations (boxplots, scatterplots) and descriptive statistics, which can be overlooked by novice users.
Data Entry Errors
Mistyped numbers, misplaced decimal points, or incorrect categorical codes compromise data quality. SPSS does not automatically validate such errors unless stringent checks are applied.
Variable Naming and Labeling Issues
Poor variable names (e.g., “var1”, “Q5”, “xyz”) reduce data interpretability. Without clear labels, future users may struggle to understand the data context or content.
Inadequate Documentation
Without proper documentation, users may be unsure what a particular value or variable represents, especially in collaborative research. This can hinder data interpretation or replication.
Data Transformation Confusion
Many analyses require transforming data—e.g., computing z-scores, logarithmic transformations, or recoding values. Mistakes during these steps can lead to inaccurate model inputs.
Incorrect Variable Types
SPSS distinguishes between numeric, string, date, and other types. Assigning the wrong type can make data unusable for analysis (e.g., treating “age” as a string rather than numeric).
Scale and Measurement Level Problems
SPSS needs users to define whether variables are nominal, ordinal, scale, or interval. Incorrect classification can limit available statistical procedures and affect the interpretation of results.

Step-by-Step Data Cleaning Process in SPSS
-
Import Data
Import data from Excel, CSV, or database files into SPSS. -
Inspect Data
UseData ViewandVariable Viewto spot inconsistencies, anomalies, or mislabeling. -
Check for Missing Values
UseFrequencies,Descriptives, orExploreto examine missing data. -
Remove Duplicates
UseIdentify Duplicate CasesunderDatato detect repeated entries. -
Recode Variables
UseTransform > Recode into Same/Different Variablesto standardize categories. -
Create New Variables
UseCompute Variableto transform or create new columns for analysis. -
Detect Outliers
Utilize boxplots, Z-scores, or theExplorefunction to identify extreme values. -
Assign Correct Measurement Levels
Check and correct scale levels inVariable View. -
Label Variables and Values
Properly label variables and assign value labels for easier interpretation. -
Save a Cleaned Version
UseFile > Save Asto create a separate, clean data file for analysis.
Tools and Features in SPSS for Data Cleaning
-
Frequencies and Descriptives: Helps identify missing data, outliers, or distribution anomalies.
-
Explore: Offers detailed descriptive stats and boxplots for outlier detection.
-
Compute Variable: Useful for creating calculated columns.
-
Recode: Reclassifies variables for standardization.
-
Split File: Helps analyze data subsets by grouping variables.
-
Select Cases: Allows users to analyze specific segments of the dataset.
-
Sort Cases: Organizes data for easier manual review and batch operations.
-
Data Validation Rules: A powerful but underused tool to set criteria for valid data entries.
Best Practices in Data Preparation
-
Document Every Step: Keep records of cleaning decisions, including recoding and variable renaming.
-
Use Versioning: Always maintain raw data and work on a copy to avoid irreversible mistakes.
-
Set Consistent Naming Conventions: Use clear, concise, and informative variable names.
-
Conduct Preliminary Analysis: Run frequencies and cross-tabulations to detect anomalies early.
-
Educate Team Members: Ensure everyone understands SPSS measurement levels and formatting requirements.
-
Develop a Cleaning Checklist: Ensure that no steps are skipped during preparation.
Case Study Example
Scenario: A healthcare researcher collects patient data on demographics, symptoms, and treatment responses for a COVID-19 study across five hospitals.
Challenges Faced:
-
Data came in varied formats—Excel, paper-based transcription, and CSV.
-
Multiple entries for the same patient ID.
-
Gender coded differently across sites (e.g., “Male”, “M”, “1”).
-
Missing treatment dates.
-
Several age entries appeared as “0” or over “150”.
Cleaning Process:
-
Standardized gender values using Recode.
-
Identified and removed duplicate patient IDs.
-
Treated “0” and “150+” as outliers; either corrected or excluded.
-
Recalculated variables like hospital stay duration using Compute.
-
Assigned value labels and variable names for clarity.
Outcome: The cleaned dataset was successfully used for logistic regression modeling, with clear, replicable steps documented in the study appendix.

Conclusion
Data cleaning and preparation are non-negotiable steps in any SPSS analysis project. While SPSS offers powerful tools, users must be vigilant and methodical to address challenges like missing values, outliers, formatting inconsistencies, and incorrect variable settings. By adopting best practices and using SPSS features effectively, researchers can significantly improve data quality and the validity of their analytical findings.
Needs help with similar assignment?
We are available 24x7 to deliver the best services and assignment ready within 3-4 hours? Order a custom-written, plagiarism-free paper
