Choosing the Right Statistical Test|2025
Choosing the Right Statistical Test: A Comprehensive Guide Using SPSS
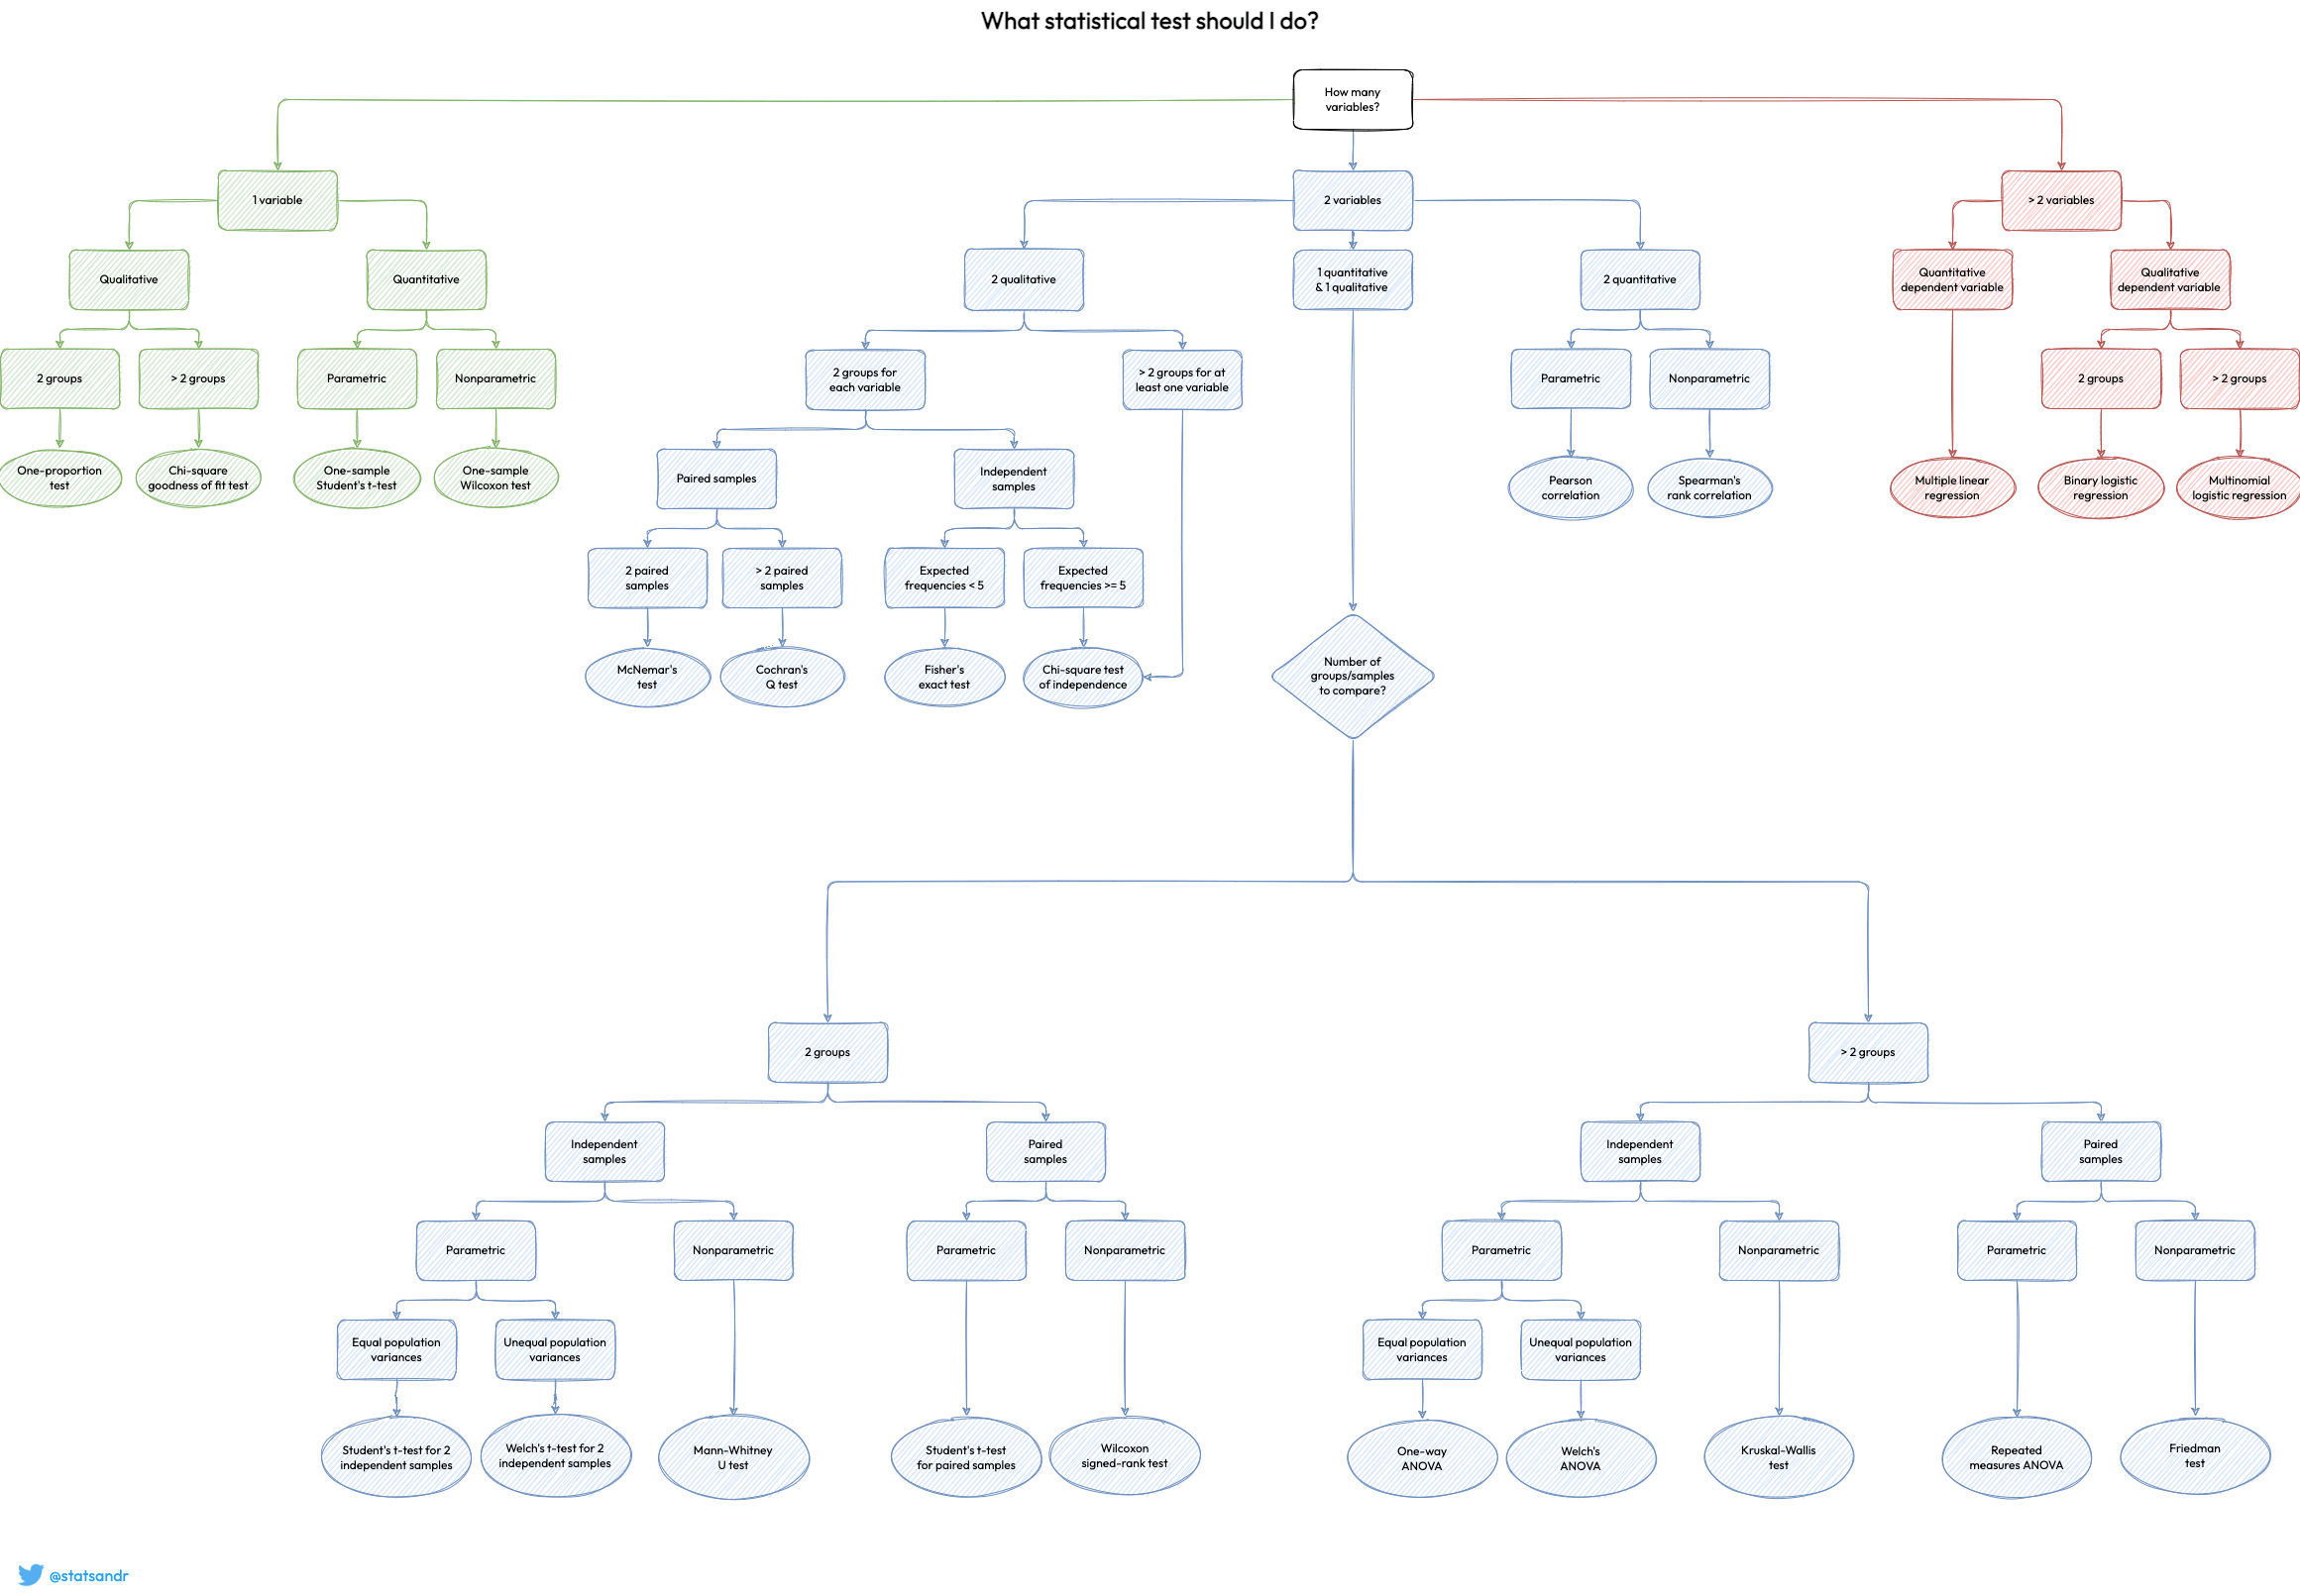
Statistical analysis is a crucial component of research across various disciplines, including psychology, medicine, business, and social sciences. Selecting the appropriate statistical test ensures accurate data interpretation and valid conclusions. However, the challenge lies in determining which test is suitable for a given dataset and research question.
SPSS (Statistical Package for the Social Sciences) is a powerful software tool that facilitates statistical analysis. However, without a proper understanding of test selection, researchers may draw incorrect inferences. This article explores the key considerations in choosing the right statistical test and demonstrates how to apply these tests in SPSS.
Understanding the Basics: Types of Data and Research Questions
Before selecting a statistical test, researchers must understand:
-
Types of Variables (Independent vs. Dependent, Categorical vs. Continuous)
-
Research Design (Experimental, Observational, Correlational)
-
Hypothesis Type (Null vs. Alternative, One-tailed vs. Two-tailed)
Types of Variables
-
Categorical (Nominal/Ordinal): Gender, Education Level, Marital Status
-
Continuous (Interval/Ratio): Age, Income, Test Scores
Research Questions
-
Descriptive: Summarizing data (Mean, Median, Mode)
-
Comparative: Comparing groups (T-tests, ANOVA)
-
Relational: Examining associations (Correlation, Regression)
-
Predictive: Forecasting outcomes (Linear Regression, Logistic Regression)
Key Considerations in Selecting a Statistical Test
Several factors influence the choice of a statistical test:
Number of Variables
-
Univariate Analysis: Single variable (Descriptive Stats)
-
Bivariate Analysis: Two variables (Correlation, Chi-Square)
-
Multivariate Analysis: Multiple variables (MANOVA, Multiple Regression)
Nature of Data
-
Parametric Tests: Assume normality, interval/ratio data (T-test, ANOVA, Pearson’s r)
-
Non-Parametric Tests: No normality assumption, ordinal/nominal data (Mann-Whitney U, Kruskal-Wallis, Spearman’s rho)
Number of Groups
-
Two Groups: Independent T-test, Paired T-test, Mann-Whitney U
-
Three or More Groups: ANOVA, Kruskal-Wallis
Relationship vs. Difference Testing
-
Testing Differences: T-tests, ANOVA
-
Testing Relationships: Correlation, Regression
Common Statistical Tests and Their Applications in SPSS
Below is a guide to selecting the right test based on research design and data type.
Comparing Means (Parametric Tests)
| Scenario | Statistical Test | SPSS Procedure |
|---|---|---|
| Compare two independent groups | Independent Samples T-test | Analyze → Compare Means → Independent-Samples T-Test |
| Compare two related groups | Paired Samples T-test | Analyze → Compare Means → Paired-Samples T-Test |
| Compare three+ independent groups | One-Way ANOVA | Analyze → Compare Means → One-Way ANOVA |
| Compare three+ related groups | Repeated Measures ANOVA | Analyze → General Linear Model → Repeated Measures |
Non-Parametric Alternatives
| Scenario | Statistical Test | SPSS Procedure |
|---|---|---|
| Compare two independent groups | Mann-Whitney U Test | Analyze → Nonparametric Tests → Independent Samples |
| Compare two related groups | Wilcoxon Signed-Rank Test | Analyze → Nonparametric Tests → Related Samples |
| Compare three+ independent groups | Kruskal-Wallis Test | Analyze → Nonparametric Tests → Independent Samples |
| Compare three+ related groups | Friedman Test | Analyze → Nonparametric Tests → Related Samples |
Testing Relationships
| Scenario | Statistical Test | SPSS Procedure |
|---|---|---|
| Association between two continuous variables | Pearson’s r | Analyze → Correlate → Bivariate |
| Association between two ordinal variables | Spearman’s rho | Analyze → Correlate → Bivariate (Check Spearman) |
| Association between categorical variables | Chi-Square Test | Analyze → Descriptive Stats → Crosstabs |
Predictive Modeling
| Scenario | Statistical Test | SPSS Procedure |
|---|---|---|
| Predict a continuous outcome | Linear Regression | Analyze → Regression → Linear |
| Predict a categorical outcome | Logistic Regression | Analyze → Regression → Binary Logistic |
Step-by-Step SPSS Guide for Common Tests
Independent Samples T-test (Comparing Two Groups)
-
Click: Analyze → Compare Means → Independent-Samples T-Test
-
Select the continuous dependent variable (e.g., Test Scores).
-
Define Groups (e.g., Group 1: Male, Group 2: Female).
-
Interpret: Check the p-value (if p < 0.05, groups differ significantly).
One-Way ANOVA (Comparing Three+ Groups)
-
Click: Analyze → Compare Means → One-Way ANOVA
-
Select the dependent variable (e.g., Sales Performance).
-
Select the categorical independent variable (e.g., Marketing Strategy).
-
Interpret: If p < 0.05, conduct Post-Hoc tests (Tukey) to identify differing groups.
Pearson’s Correlation (Testing Relationships)
-
Click: Analyze → Correlate → Bivariate
-
Select two continuous variables (e.g., Age and Income).
-
Check Pearson and click OK.
-
Interpret: Correlation coefficient (r) ranges from -1 to +1.
Chi-Square Test (Categorical Association)
-
Click: Analyze → Descriptive Statistics → Crosstabs
-
Select two categorical variables (e.g., Smoking Status and Lung Disease).
-
Check Chi-Square under Statistics.
-
Interpret: If p < 0.05, variables are associated.
Common Mistakes and How to Avoid Them
-
Using Parametric Tests on Non-Normal Data: Always check normality (Shapiro-Wilk, Q-Q plots).
-
Ignoring Assumptions: Homogeneity of variance (Levene’s Test), multicollinearity in regression.
-
Misinterpreting p-values: p < 0.05 indicates significance, but effect size matters (Cohen’s d, Eta-squared).
-
Overlooking Post-Hoc Tests: In ANOVA, always run Tukey or Bonferroni corrections.
Conclusion
Choosing the right statistical test is critical for valid research findings. By understanding data types, research questions, and test assumptions, researchers can make informed decisions. SPSS simplifies the execution of these tests, but proper selection and interpretation remain the researcher’s responsibility.
Following this structured approach ensures robust statistical analysis, leading to credible and impactful research outcomes.
Needs help with similar assignment?
We are available 24x7 to deliver the best services and assignment ready within 3-4 hours? Order a custom-written, plagiarism-free paper


