Advanced Excel Solutions for Handling Time Series Data in Assignments
/in SPSS Articles /by BesttutorDiscover advanced Excel solutions for handling time series data. Learn techniques for analyzing trends, forecasting, and visualizing time-based data to enhance your analysis and decision-making skills.
Time series data is a crucial part of many assignments across various fields, including finance, economics, healthcare, and business analysis. The ability to efficiently process, analyze, and forecast time series data is a skill that can significantly improve the quality of your academic or professional work. In this article, we will explore advanced Excel solutions for handling time series data in assignments, focusing on various features, tools, and techniques that can make your analysis more accurate and efficient. We will also address some of the common issues that users encounter when using Excel for time series analysis.
Table of Contents
ToggleUnderstanding Time Series Data
Time series data refers to a sequence of data points recorded at successive, evenly spaced time intervals. Examples of time series data include stock prices, weather measurements, and monthly sales figures. Handling such data requires specific techniques to analyze trends, seasonal patterns, and forecasts. Excel, with its powerful features and flexibility, is widely used for time series analysis due to its accessibility and vast array of functions.
Key Features of Excel for Time Series Analysis
Before diving into advanced solutions, let’s review some of the essential Excel features that are useful for time series analysis:
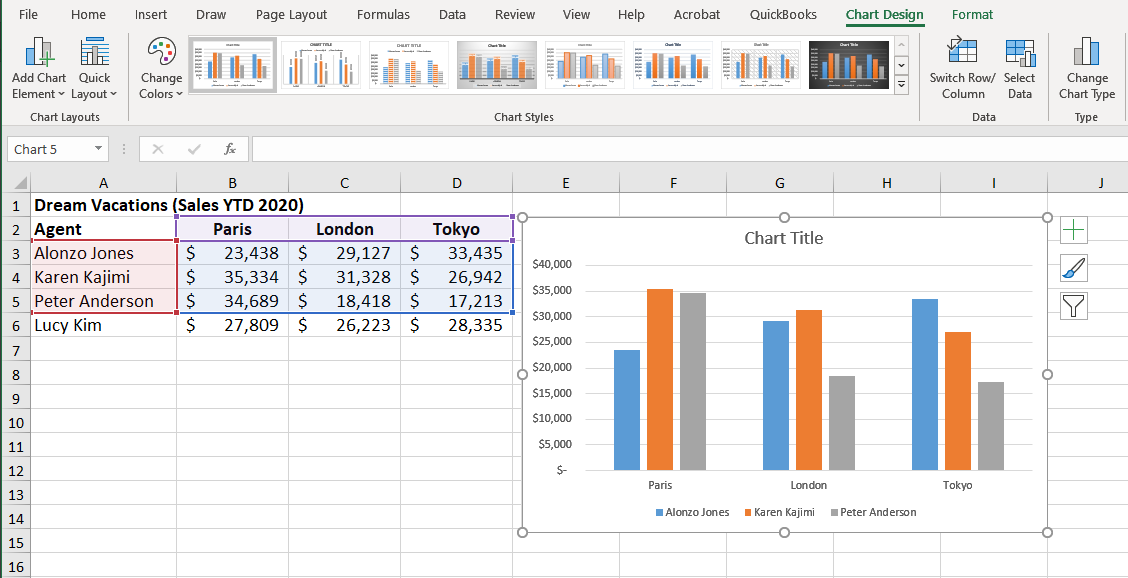
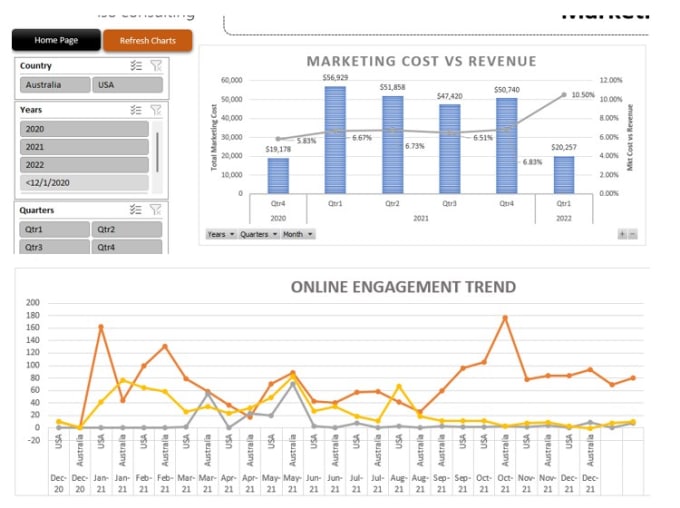
- Excel Charts and Graphs: Excel allows you to plot your time series data using line graphs, scatter plots, and other chart types, which are essential for visualizing trends, outliers, and patterns over time.
- Excel Functions: Functions such as
AVERAGE,TREND,FORECAST,LINEST, andGROWTHare helpful for statistical analysis of time series data. These functions enable users to compute moving averages, linear regression models, and make forecasts based on historical data. - PivotTables: PivotTables help summarize and analyze large datasets, making it easier to identify trends, seasonal effects, and other relevant patterns in time series data.
- Data Analysis ToolPak: This Excel add-in provides access to various statistical tools, including regression analysis, descriptive statistics, and moving averages, which are essential for time series analysis.
Advanced Excel Solutions for Time Series Data
Time Series Analysis in Excel PDF
If you’re working on assignments related to time series analysis, you may often look for detailed guides or templates. A Time Series Analysis in Excel PDF can serve as a comprehensive resource, walking you through the step-by-step process of performing complex time series analysis using Excel. These PDFs typically include:
- Instructions for setting up your data for analysis.
- Examples of different time series techniques.
- Visual aids, such as charts and graphs, to help you better understand trends and patterns.
- Tips on avoiding common pitfalls in time series analysis.
By downloading a Time Series Data Excel Download, you can quickly access these templates and guides, saving time and effort on your assignment. These templates are often pre-structured with sample data, allowing you to simply input your own data and start the analysis process.
Using Excel Templates for Time Series Analysis
One of the most efficient ways to analyze time series data in Excel is by using pre-designed Time Series Analysis Excel Templates. These templates are designed to streamline the process of data entry, analysis, and visualization. The templates often come with built-in formulas for forecasting, trend analysis, and seasonal adjustments.
- Simple Moving Average: A template can automate the process of calculating moving averages to smooth out fluctuations and identify trends in your data.
- Exponential Smoothing: Some templates incorporate exponential smoothing methods to give more weight to recent observations, providing more accurate forecasts for short-term predictions.
- Regression Analysis: Templates can also include regression models that analyze the relationship between time-dependent variables and help you predict future values based on historical data.
Time Series Forecasting Excel Formula
Forecasting is one of the most powerful aspects of time series analysis. Excel offers several built-in functions for time series forecasting, making it a great tool for predicting future values based on historical data.
- FORECAST Function: The
FORECASTfunction in Excel is one of the most commonly used forecasting tools. It estimates future values based on historical data and a linear trend. The formula looks like this:scss=FORECAST(x, known_y’s, known_x’s)
This function is ideal for simple forecasting scenarios, such as predicting sales or stock prices based on historical trends.
- FORECAST.ETS Function: For more complex forecasting that takes seasonality into account, Excel provides the
FORECAST.ETSfunction. This function uses exponential smoothing to create forecasts and is available in Excel 2016 and later versions. The syntax for this function is:css=FORECAST.ETS(target_date, values, timeline, [seasonality], [data_completion], [aggregation])
Interrupted Time Series Analysis in Excel
In cases where an external event disrupts the normal pattern of a time series, Interrupted Time Series Analysis Excel techniques come into play. This type of analysis helps evaluate the impact of interventions (such as policy changes or product launches) on the time series data.
- Graphical Representation: Plotting the data before and after the interruption is an essential step. A clear visual representation can highlight the effects of the intervention.
- Regression Models: Regression models can be extended to account for interrupted data by introducing a dummy variable that represents the point of intervention. This allows you to model the data before and after the disruption separately.
Handling Missing Data in Time Series Analysis
Missing data is a common issue in time series analysis, and it can significantly affect the accuracy of your analysis and forecasts. Excel provides several methods for dealing with missing values, including:
- Linear Interpolation: Using Excel’s
INTERPfunction or manually filling in missing data using linear interpolation is a simple method for estimating missing values. - Exponential Smoothing: This method can also be used to fill in missing values by giving more weight to recent observations.
Data Analysis Toolpak Excel Add-in
The Data Analysis Toolpak Excel Add-in is a must-have tool for anyone working on time series analysis. This add-in includes a variety of statistical tools, such as:
- Descriptive Statistics: Generate detailed summaries of your data, including mean, standard deviation, and skewness.
- Moving Averages: Calculate moving averages to identify trends and smooth out data fluctuations.
- Regression Analysis: Use regression analysis to model relationships in your time series data and make predictions.
To enable the Data Analysis Toolpak in Excel, go to the File tab, click Options, select Add-ins, and then choose Analysis ToolPak from the list of available add-ins.
Data Analysis Excel Download and Issues
When using Excel for time series analysis, it’s important to ensure that the Data Analysis Excel Download is properly installed. Sometimes, users encounter the issue where Data Analysis Excel is not showing or the add-in doesn’t function as expected. This can be caused by several factors, such as a corrupted installation or missing add-in. To resolve these issues:
- Reinstall Excel: Ensure that the installation of Excel is up to date.
- Check Add-in Settings: Go to File > Options > Add-ins and verify that the Analysis ToolPak is enabled.
- Repair Excel: Use Excel’s built-in repair tool to fix any issues with the installation.
Why Getspsshelp.com is the Best Website for Excel Time Series Analysis Assistance
If you’re working on an assignment that involves time series data and you need expert guidance, getspsshelp.com is the best website for support. Our team of professionals is highly experienced in advanced Excel solutions for time series analysis, including forecasting, regression, and interrupted time series analysis. Whether you’re stuck on a formula or need help visualizing your data, we offer tailored solutions to meet your needs.
Why Choose Getspsshelp.com?
- Expert Support: Our team consists of professionals with deep knowledge of time series analysis and Excel functions.
- Tailored Assistance: We provide customized solutions to your unique assignment challenges, ensuring you meet your academic requirements.
- Comprehensive Resources: From Time Series Analysis Excel Templates to Data Analysis Toolpak Excel tutorials, we offer extensive resources to help you succeed.
- Fast Turnaround: We understand the importance of deadlines and provide timely assistance to ensure you submit high-quality assignments on time.
Visit getspsshelp.com today and unlock the power of advanced Excel solutions for handling time series data in your assignments. Our experts are ready to guide you every step of the way!
Conclusion
Excel is an incredibly powerful tool for handling time series data, and with the right techniques and functions, you can perform advanced analysis and make accurate forecasts. By using Excel templates, formulas, and tools like the Data Analysis ToolPak, you can efficiently manage time series data and excel in your assignments. If you ever encounter issues or need expert assistance, getspsshelp.com is the perfect resource to help you achieve success.
Needs help with similar assignment?
We are available 24x7 to deliver the best services and assignment ready within 3-4 hours? Order a custom-written, plagiarism-free paper


