Advantages of Multivariate ANOVA Using SPSS|2025
/in SPSS Articles /by BesttutorDiscover the advantages of Multivariate ANOVA using SPSS. Learn how this statistical method helps analyze multiple dependent variables and provides deeper insights into complex data relationships.
Multivariate Analysis of Variance (MANOVA) is an extension of the popular Analysis of Variance (ANOVA) used to analyze the effect of independent variables on multiple dependent variables simultaneously. SPSS (Statistical Package for the Social Sciences) is one of the most widely used software packages for conducting statistical analysis, and it provides various tools for performing MANOVA. In this paper, we will explore the advantages of conducting Multivariate ANOVA using SPSS, the differences between ANOVA and MANOVA, and discuss some related concepts like ANCOVA, MANCOVA, and performing Multivariate ANOVA in Python.
Table of Contents
ToggleWhat is Multivariate ANOVA (MANOVA)?
Multivariate ANOVA, abbreviated as MANOVA, is a statistical test used to determine the differences between the means of multiple dependent variables, taking into account the interaction effects between them. While ANOVA analyzes the variance within a single dependent variable across different groups, MANOVA extends this concept to multiple dependent variables. The aim of MANOVA is to test whether changes in the independent variable(s) result in significant changes in a combination of dependent variables.
In practice, MANOVA is useful when the researcher is interested in analyzing the combined effect of several dependent variables simultaneously. For instance, in psychology, a researcher might want to investigate how different teaching methods (independent variable) affect students’ performance across several subjects (dependent variables).
Advantages of Using SPSS for MANOVA
- User-Friendly Interface: One of the significant advantages of using SPSS for Multivariate ANOVA is its user-friendly interface. SPSS is designed for users with minimal statistical knowledge, making it accessible for researchers and analysts from various fields. The software’s point-and-click interface simplifies the process of conducting complex statistical analyses, including MANOVA. Users do not need to write extensive code, which is often required in other statistical software packages or programming languages.
- Comprehensive Statistical Output: SPSS provides a comprehensive output after performing MANOVA. This includes various tables that summarize the test statistics, such as the Wilks’ Lambda, Pillai’s Trace, Hotelling’s Trace, and Roy’s Largest Root. These statistics are essential for interpreting the results of MANOVA. Additionally, SPSS generates means for each group, as well as univariate ANOVA results for each dependent variable. These outputs are clear, easy to understand, and directly interpretable, even for users with limited statistical expertise.
- Multivariate Tests: SPSS supports multiple multivariate tests such as Pillai’s Trace, Wilks’ Lambda, Hotelling’s Trace, and Roy’s Largest Root. These are commonly used in MANOVA to evaluate the significance of the differences between group means across multiple dependent variables. The availability of these tests in SPSS allows researchers to select the most appropriate test based on the assumptions of their data and the nature of the research.
- Handling Missing Data: SPSS has various methods to handle missing data, which is a common challenge in multivariate analyses. Options such as casewise deletion or the use of statistical techniques like maximum likelihood estimation make it easier to work with datasets that have missing values without compromising the validity of the analysis.
- Visualizations: SPSS also includes powerful tools for visualizing the results of MANOVA. The software can produce various types of plots, including profile plots, interaction plots, and scatterplots. These visual aids help researchers better understand the relationships between the independent variables and the dependent variables, and they are helpful in communicating findings to non-statistical audiences.
- Post-Hoc Tests: After running MANOVA in SPSS, researchers can perform post-hoc tests to identify specific group differences. For example, if MANOVA shows a significant effect, researchers may conduct post-hoc tests such as pairwise comparisons to determine which specific groups differ from each other on the dependent variables. SPSS provides an easy way to perform these tests and interpret the results.
ANOVA vs. MANOVA: Key Differences
While both ANOVA and MANOVA are used to analyze variance, they differ in several key ways. ANOVA is used when there is only one dependent variable, while MANOVA is used when there are two or more dependent variables. Below is a comparison of ANOVA and MANOVA:
ANOVA:
- One Dependent Variable: ANOVA compares the means of different groups on a single dependent variable.
- Simpler: Because it involves only one dependent variable, ANOVA is simpler to interpret and requires fewer assumptions.
- Assumptions: ANOVA assumes that the data is normally distributed, the variances are homogeneous, and the observations are independent.
- Example: An experiment testing the effect of different teaching methods on students’ scores in a single subject (e.g., mathematics).
MANOVA:
- Multiple Dependent Variables: MANOVA tests for differences across multiple dependent variables simultaneously.
- More Complex: MANOVA is more complex than ANOVA because it considers the interactions between dependent variables, and the analysis must account for correlations between them.
- Assumptions: Like ANOVA, MANOVA assumes normality, homogeneity of variance, and independence of observations. However, it also assumes multivariate normality and that the dependent variables are correlated.
- Example: A study investigating the effect of teaching methods on students’ performance in mathematics, reading, and science (multiple dependent variables).
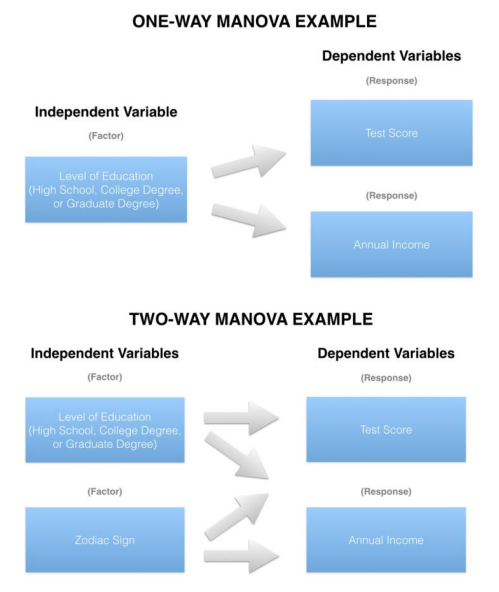
MANOVA vs. Two-Way ANOVA
Two-way ANOVA is another form of analysis used when there are two independent variables. However, it is different from MANOVA in that it only involves a single dependent variable. Below is a comparison:
Two-Way ANOVA:
- Two Independent Variables: Two-way ANOVA looks at the effect of two independent variables on one dependent variable.
- Interactions: It also tests the interaction between the two independent variables and their individual effects on the dependent variable.
- Example: Investigating the effect of teaching method and student gender on scores in mathematics.
MANOVA:
- Multiple Dependent Variables: MANOVA deals with multiple dependent variables, and its primary strength lies in examining how independent variables influence more than one outcome simultaneously.
- Example: Investigating the effect of teaching methods on scores in multiple subjects, such as mathematics, reading, and science.

Difference Between ANOVA and MANOVA (PDF)
Understanding the distinction between ANOVA and MANOVA is vital for choosing the appropriate statistical test. Both ANOVA and MANOVA analyze variance, but while ANOVA focuses on a single dependent variable, MANOVA evaluates the variance in multiple dependent variables. Researchers often consult resources, including PDFs, textbooks, or academic papers, to gain deeper insights into these concepts, ensuring they select the most appropriate test based on the research design.
ANOVA vs. MANOVA vs. ANCOVA
While ANOVA and MANOVA are widely used for analyzing differences in means, ANCOVA (Analysis of Covariance) is another related technique used when researchers need to control for potential confounding variables.
ANCOVA:
- Covariates: ANCOVA is an extension of ANOVA that includes one or more covariates, or continuous control variables. By controlling for these covariates, ANCOVA adjusts the dependent variable, ensuring that the results reflect the effect of the independent variable more accurately.
- When to Use: ANCOVA is used when researchers want to control for additional variables that might affect the dependent variable, making it a more precise technique compared to ANOVA.
- Example: Examining the effect of teaching methods on students’ scores while controlling for students’ prior knowledge.
MANOVA vs. MANCOVA
MANCOVA (Multivariate Analysis of Covariance) is an extension of MANOVA that includes covariates. This means that MANCOVA analyzes the effects of independent variables on multiple dependent variables, while also adjusting for the influence of one or more continuous covariates.
- MANCOVA allows researchers to account for variables that could confound the relationship between independent and dependent variables, making the analysis more accurate and meaningful.
- When to Use: MANCOVA is particularly useful when researchers need to control for the effects of covariates while examining the multivariate outcomes.
Multivariate ANOVA in Python
While SPSS is widely used for MANOVA, Python also offers various libraries, such as statsmodels and scipy, to perform multivariate statistical analysis. The statsmodels library, for instance, provides tools for MANOVA in Python, allowing researchers to perform the test through coding. However, SPSS remains the more popular choice due to its ease of use and visual outputs.
Conclusion
Multivariate ANOVA using SPSS offers several advantages, including a user-friendly interface, comprehensive statistical output, and effective handling of missing data. While ANOVA and MANOVA serve different purposes, understanding when to use each test is essential for selecting the correct statistical approach. In comparison to other methods like ANCOVA and MANCOVA, MANOVA remains a powerful tool for understanding the impact of independent variables on multiple dependent variables simultaneously. Researchers interested in implementing MANOVA can choose from various software tools like SPSS or Python, depending on their preferences and level of statistical expertise.
Needs help with similar assignment?
We are available 24x7 to deliver the best services and assignment ready within 3-4 hours? Order a custom-written, plagiarism-free paper
