Analysis of Covariance ANCOVA in SPSS: A Comprehensive 5-Step Guide|2025
Learn the Analysis of Covariance ANCOVA in SPSS: A comprehensive 5-step guide. Discover how to perform ANCOVA effectively for accurate statistical analysis and research insights.
Analysis of Covariance (ANCOVA) is a statistical technique that combines analysis of variance (ANOVA) and regression. It assesses whether population means of a dependent variable (DV) differ across levels of a categorical independent variable (IV) while controlling for the effects of one or more continuous covariates. This method is particularly useful when researchers aim to understand the impact of an IV on a DV, accounting for variability due to covariates.
Understanding ANCOVA and Its Assumptions
Before conducting ANCOVA in SPSS, it’s essential to grasp its purpose and underlying assumptions:
- Purpose: ANCOVA evaluates whether group means on the DV are adjusted for differences in covariates. This adjustment provides a clearer picture of the IV’s effect on the DV.
- Assumptions: For ANCOVA results to be valid, certain assumptions must be met:
- Independence of Observations: Each participant’s data should be independent of others.
- Normality: The residuals (differences between observed and predicted values) should be normally distributed.
- Homogeneity of Variance (Homogeneity of Covariance): The variance within each group should be equal.
- Linearity: The relationship between the covariate and the DV should be linear.
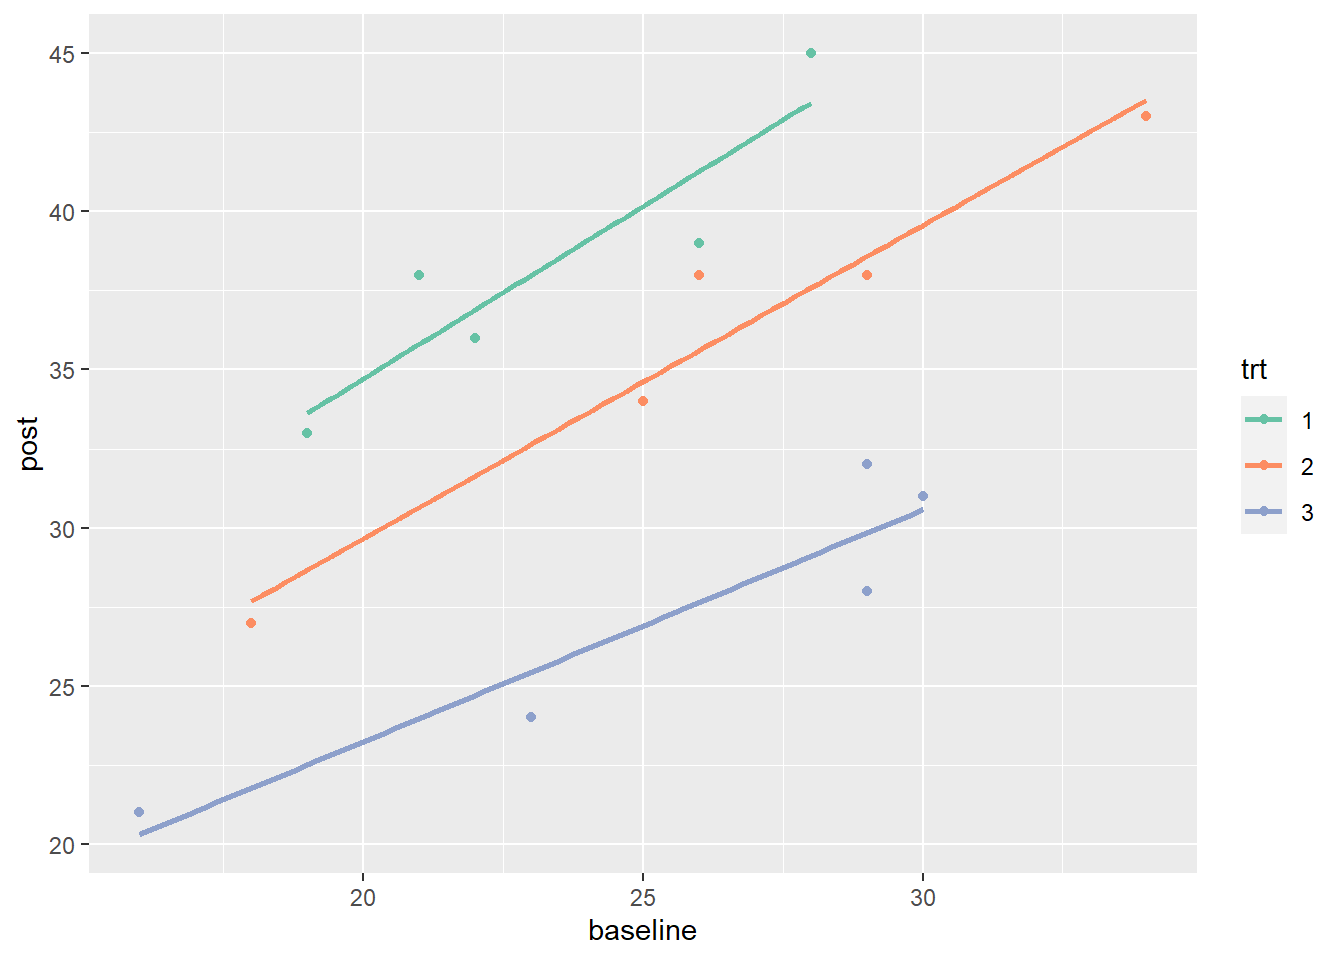
- Homogeneity of Regression Slopes: The relationship between the covariate and the DV should be consistent across all groups.
Preparing Data in SPSS
Proper data preparation is crucial:
- Data Entry: Ensure your data is correctly entered in SPSS, with the DV, IV, and covariate clearly defined.
- Variable View: Assign appropriate variable types and labels.
- Data View: Verify that each row represents a unique observation and that data is complete.
Conducting ANCOVA in SPSS
Follow these steps to perform ANCOVA:
- Access the Procedure:
- Navigate to
Analyze>General Linear Model>Univariate.
- Navigate to
- Assign Variables:
- Place the DV in the “Dependent Variable” box.
- Place the IV in the “Fixed Factor(s)” box.
- Place the covariate in the “Covariate(s)” box.
- Model Specification:
- Click on “Model” and select “Custom.”
- Add the main effects and the interaction between the IV and covariate.
- Options:
- Click on “Options” to request descriptive statistics, estimates of effect size, and homogeneity tests.
- Run the Analysis:
- Click “OK” to execute the analysis.
Interpreting ANCOVA Results
Upon obtaining the output, focus on:
- Descriptive Statistics: Review means and standard deviations for each group.
- Tests of Between-Subjects Effects:
- Examine the significance of the main effect of the IV.
- Check the significance of the covariate.
- Assess the interaction effect between the IV and covariate.
- Assumption Checks:
- Review tests for homogeneity of variances (e.g., Levene’s Test).
- Examine plots for linearity and homogeneity of regression slopes.

Reporting ANCOVA Results in APA Style
When documenting your findings:
- Structure:
- Introduction: Briefly describe the purpose of the analysis.
- Method: Detail the participants, design, and variables.
- Results:
- Report F-values, degrees of freedom, p-values, and partial eta squared for significant effects.
- Include means and standard deviations for each group.
- Discuss assumption checks and their implications.
- Discussion: Interpret the findings in the context of your research question.
- Example:A one-way ANCOVA was conducted to determine the effect of diet type on weight loss, controlling for baseline weight. The results indicated a significant effect of diet type on weight loss, F(2, 97) = 5.43, p = .007, partial η² = .10. Post hoc comparisons revealed that participants on Diet A lost significantly more weight than those on Diet B (p = .003). The assumption of homogeneity of regression slopes was met, as indicated by the non-significant interaction between diet type and baseline weight (p = .45).
Additional Considerations
- Repeated Measures ANCOVA: When the same participants are measured multiple times, a repeated measures ANCOVA is appropriate. This design accounts for intra-subject variability and is analyzed using the
General Linear Model>Repeated Measuresprocedure in SPSS. - ANCOVA vs. ANOVA: While ANOVA compares group means without considering covariates, ANCOVA adjusts for covariates, providing a more precise estimate of the IV’s effect on the DV.
- Effect Size: Reporting effect size (e.g., partial eta squared) is essential for understanding the magnitude of significant effects.
- ANCOVA in R: ANCOVA can also be performed in R using the
aov()function with theError()term to specify the covariate.
Needs help with similar assignment?
We are available 24x7 to deliver the best services and assignment ready within 3-4 hours? Order a custom-written, plagiarism-free paper
