Analyzing Numerical Data Using SPSS with Confidence|2025
Analyzing Numerical Data Using SPSS with Confidence: A Comprehensive Guide to mastering data entry, descriptive stats, and inferential analysis for accurate results.
In the world of data analysis, numerical data plays a central role in driving insights and decision-making. Whether you’re in academia, healthcare, marketing, or any other field, understanding how to analyze numerical data accurately is crucial. One of the most powerful tools available for analyzing such data is SPSS (Statistical Package for the Social Sciences). SPSS is widely used in research, business analytics, and social sciences for its user-friendly interface and comprehensive statistical capabilities.
This guide will walk you through the process of analyzing numerical data using SPSS, offering step-by-step instructions to ensure you can work with confidence. By the end of this paper, you will have a solid understanding of how to use SPSS for numerical data analysis, including data preparation, descriptive statistics, hypothesis testing, regression analysis, and more.
Why Use SPSS for Numerical Data Analysis?
SPSS is a robust statistical software designed to help users perform a wide range of statistical analyses. Its intuitive interface makes it accessible to both beginners and experts in statistical analysis. Here are some reasons why SPSS is ideal for numerical data analysis:
- Ease of Use: SPSS’s graphical interface is easy to navigate, making it accessible for users with limited statistical knowledge.
- Comprehensive Statistical Methods: From basic descriptive statistics to advanced regression and multivariate analyses, SPSS offers a wide range of statistical techniques.
- Data Management: SPSS allows users to import, clean, and manage datasets with ease, making it a versatile tool for handling numerical data.
- Visualization Tools: SPSS includes a variety of charts and graphs to help visualize numerical data and statistical findings.
Step 1: Preparing Your Data in SPSS
Before analyzing your numerical data, it’s essential to ensure that your dataset is clean and well-organized. SPSS offers tools for importing data from various sources such as Excel, CSV files, and databases.
-
Importing Data:
- From Excel: Click on
File>Open>Data, then choose your Excel file. Ensure that your data is organized with variables in columns and cases (rows). - From CSV: Use
File>Open>Dataand select your CSV file.
- From Excel: Click on
-
Data Cleaning:
- Handling Missing Data: SPSS provides options to identify and handle missing data. You can choose to exclude missing data from your analysis or impute missing values using statistical techniques.
- Identifying Outliers: Outliers can distort analysis results. SPSS has built-in functions to detect outliers, and you can choose to exclude or adjust them based on your analysis needs.
-
Variable Types:
- Ensure that each variable in your dataset is correctly defined. SPSS recognizes different types of variables such as:
- Nominal: Categorical variables (e.g., gender, country).
- Ordinal: Variables with a meaningful order but no fixed distance between values (e.g., Likert scale).
- Scale (Continuous): Numerical variables with meaningful distances (e.g., age, income, temperature).
- Ensure that each variable in your dataset is correctly defined. SPSS recognizes different types of variables such as:
Step 2: Descriptive Statistics
Descriptive statistics are used to summarize and describe the main features of a dataset. This includes measures of central tendency (mean, median, mode), measures of variability (range, standard deviation), and frequency distributions.
- Mean: The average of all data points. It’s useful for understanding the typical value in your dataset.
- Median: The middle value of the dataset when arranged in ascending or descending order. It is less sensitive to outliers than the mean.
- Mode: The most frequently occurring value in the dataset.
- Standard Deviation: A measure of the spread or dispersion of data points around the mean.
- Frequency Distribution: This shows the count or percentage of cases that fall into different value ranges for a variable.
Using SPSS to Calculate Descriptive Statistics:
- Go to
Analyze>Descriptive Statistics>Descriptives. - Select the variables you want to analyze.
- Click
OKto generate output including the mean, median, standard deviation, and other statistics.
Step 3: Hypothesis Testing
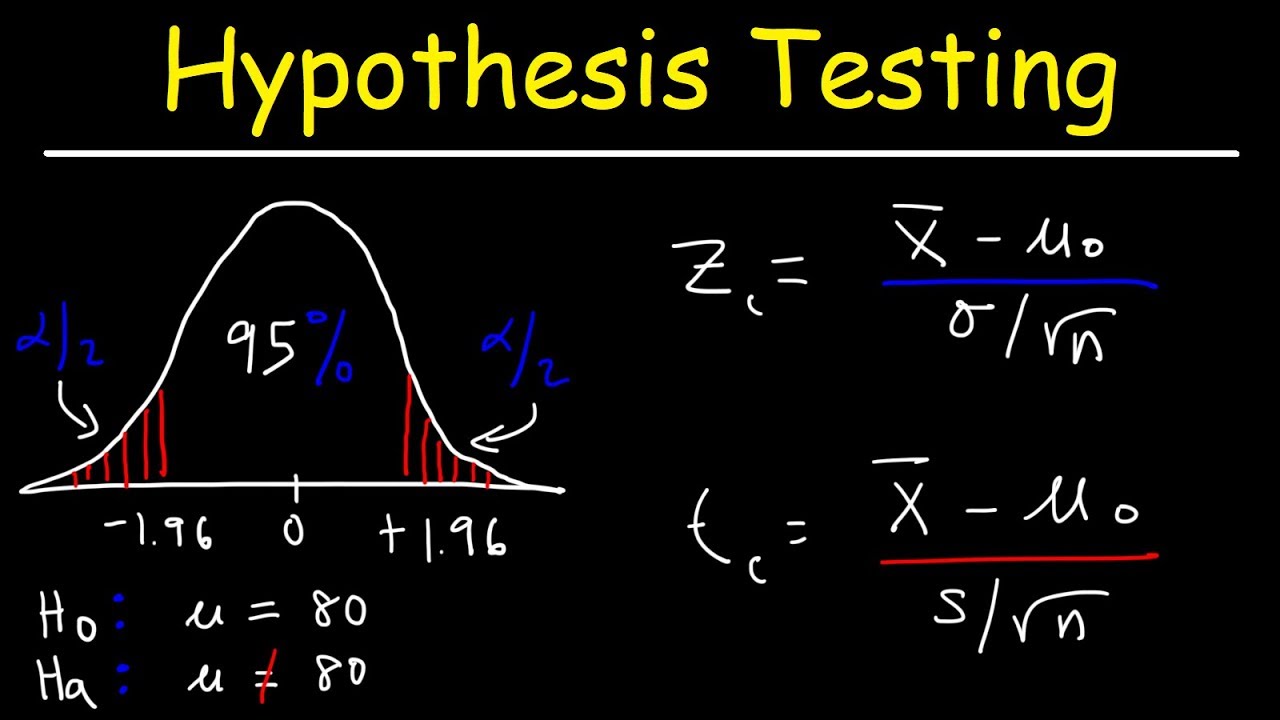
Hypothesis testing is a fundamental aspect of statistical analysis. It allows you to make inferences about a population based on sample data. Commonly used hypothesis tests in numerical data analysis include the t-test, chi-square test, and analysis of variance (ANOVA).
-
One-Sample T-Test: Used to compare the mean of a sample against a known value.
- Go to
Analyze>Compare Means>One-Sample T Test. - Select the variable and enter the test value.
- Go to
-
Independent Samples T-Test: Used to compare the means of two independent groups (e.g., comparing test scores between males and females).
- Go to
Analyze>Compare Means>Independent-Samples T Test. - Select the grouping variable and the test variable.
- Go to
-
Paired Sample T-Test: Used when you have two measurements taken on the same subjects, such as before and after data.
- Go to
Analyze>Compare Means>Paired-Samples T Test. - Choose the paired variables for comparison.
- Go to
-
Analysis of Variance (ANOVA): Used when comparing the means of three or more groups.
- Go to
Analyze>Compare Means>One-Way ANOVA. - Select the dependent variable and the grouping factor.
- Go to
Step 4: Correlation Analysis
Correlation analysis is used to assess the relationship between two numerical variables. The most common measure of correlation is Pearson’s correlation coefficient, which ranges from -1 (strong negative correlation) to +1 (strong positive correlation).
Using SPSS for Correlation Analysis:
- Go to
Analyze>Correlate>Bivariate. - Select the variables you want to analyze and choose Pearson as the correlation method.
- SPSS will generate a correlation matrix showing the strength and direction of the relationship between variables.
Step 5: Regression Analysis
Regression analysis is a powerful tool for modeling the relationship between a dependent variable and one or more independent variables. In numerical data analysis, linear regression is commonly used.
-
Simple Linear Regression: This method analyzes the relationship between one independent variable and one dependent variable.
- Go to
Analyze>Regression>Linear. - Select the dependent variable and the independent variable(s).
- SPSS will produce a regression equation, coefficients, and other diagnostic statistics.
- Go to
-
Multiple Linear Regression: When there are multiple independent variables, you can use multiple linear regression to predict the dependent variable.
- Go to
Analyze>Regression>Linear. - Select the dependent variable and multiple independent variables.
- SPSS will generate a regression model and assess the significance of each predictor.
- Go to
Step 6: Visualizing Numerical Data
Visualization is a crucial step in data analysis as it helps to communicate findings effectively. SPSS offers a variety of graphs and charts to represent your numerical data visually.
-
Histograms: Used to display the distribution of a single variable.
- Go to
Graphs>Legacy Dialogs>Histogram. - Select the variable and adjust bin width as needed.
- Go to
-
Boxplots: Useful for visualizing the spread and identifying outliers in your data.
- Go to
Graphs>Legacy Dialogs>Boxplot. - Choose the variable and grouping factor.
- Go to
-
Scatterplots: Used to explore the relationship between two continuous variables.
- Go to
Graphs>Legacy Dialogs>Scatter/Dot. - Select the variables and choose the appropriate scatterplot type.
- Go to
Step 7: Reporting Your Findings
Once you’ve analyzed your numerical data using SPSS, it’s important to communicate your results clearly. Your report should include:
- Descriptive Statistics: Provide the mean, standard deviation, and any other relevant statistics for your variables.
- Hypothesis Test Results: Report the results of any hypothesis tests, including test statistics, p-values, and interpretations.
- Regression and Correlation Results: Present the regression coefficients, R-squared values, and significance levels.
- Visualizations: Include relevant charts and graphs to support your findings.

Conclusion
Analyzing numerical data with SPSS doesn’t have to be intimidating. With the right tools and knowledge, anyone can perform comprehensive data analysis with confidence. Whether you’re conducting descriptive statistics, hypothesis testing, or advanced regression analysis, SPSS provides a powerful and accessible platform for your analytical needs. By following the steps outlined in this guide, you’ll be well on your way to confidently analyzing numerical data, drawing insights, and making data-driven decisions.
Needs help with similar assignment?
We are available 24x7 to deliver the best services and assignment ready within 3-4 hours? Order a custom-written, plagiarism-free paper
