ANOVA vs T-Test: Understanding the Differences & Similarities|2025
Understand the key differences between ANOVA vs T-Test, their applications, and when to use each statistical method for accurate data analysis and interpretation.
Statistical analysis is crucial in various fields to draw meaningful conclusions from data. Two common statistical tests used to analyze differences between groups are the T-test and Analysis of Variance (ANOVA). These tests, though related, have distinct purposes, assumptions, and applications. In this paper, we will compare and contrast the T-test and ANOVA, delving into their differences, similarities, and the circumstances under which each test is used. We will also explore extensions of these tests, such as One-way and Two-way ANOVA, and compare ANOVA with the Chi-square test.
Overview of the T-test
The T-test, developed by William Sealy Gosset in the early 20th century, is a statistical test used to determine whether there is a significant difference between the means of two groups. It is particularly useful when the sample size is small and the population variance is unknown. There are three main types of T-tests:
- Independent T-test: Compares the means of two independent groups (e.g., treatment vs. control group).
- Paired T-test: Compares the means of two related groups (e.g., before and after treatment).
- One-sample T-test: Compares the mean of a sample against a known value or population mean.
The basic assumption of the T-test is that the data is normally distributed, and the variance of the two groups being compared should be equal.
Overview of ANOVA
Analysis of Variance (ANOVA) is a statistical method used to compare means across three or more groups. ANOVA is particularly useful when researchers want to test multiple groups simultaneously, rather than performing multiple T-tests, which increases the risk of Type I errors. The primary aim of ANOVA is to determine if at least one group mean is different from the others.
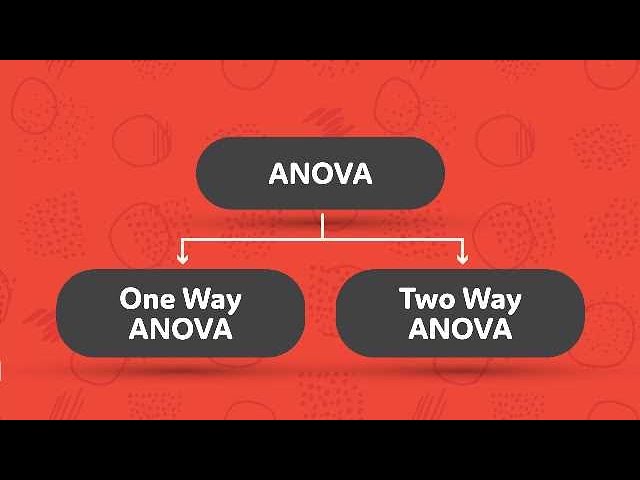
There are several types of ANOVA, including:
- One-way ANOVA: Used when there is one independent variable with more than two groups. It tests whether there is a significant difference in the means of the groups.
- Two-way ANOVA: Used when there are two independent variables. It examines not only the main effects of each independent variable but also the interaction effect between them.
- Multivariate ANOVA (MANOVA): An extension of ANOVA that handles multiple dependent variables simultaneously.
Like the T-test, ANOVA assumes that the data follows a normal distribution and that the variances of the groups are equal (homogeneity of variance). Additionally, ANOVA assumes that the observations within each group are independent.
Key Differences Between T-test and ANOVA
Number of Groups Tested
One of the most fundamental differences between the T-test and ANOVA lies in the number of groups each test can handle. A T-test is typically used when comparing the means of two groups, whereas ANOVA is designed for situations where there are three or more groups. In situations where you have more than two groups, ANOVA is preferred because performing multiple T-tests would increase the likelihood of Type I errors (incorrectly rejecting the null hypothesis).
Example:
If a researcher wanted to compare the average scores of three different teaching methods, ANOVA would be the most appropriate test. A T-test, on the other hand, could only be used to compare two methods at a time.

Purpose and Hypothesis
Both the T-test and ANOVA are used to test hypotheses about group means, but the null and alternative hypotheses differ slightly in wording.
- T-test: The null hypothesis (H₀) in a T-test states that the means of the two groups are equal. The alternative hypothesis (H₁) states that the means are not equal.
- ANOVA: The null hypothesis (H₀) in ANOVA states that all group means are equal. The alternative hypothesis (H₁) in ANOVA states that at least one group mean is different from the others.
Thus, ANOVA is designed to answer the question of whether there is any significant difference between multiple groups, while the T-test focuses on comparing the means of just two groups.
Variance Analysis
Another key distinction between T-tests and ANOVA is the method of variance analysis. The T-test compares the difference between two means in terms of standard error, while ANOVA compares the variance within and between groups.
In ANOVA, the total variation in the data is partitioned into two components:
- Between-group variation: Variance attributed to differences between the group means.
- Within-group variation: Variance within the groups themselves (i.e., individual differences).
By comparing these two sources of variance, ANOVA can determine whether the differences between groups are statistically significant. This is quantified using the F-statistic, which is the ratio of between-group variance to within-group variance.
Output Interpretation
Both the T-test and ANOVA produce p-values to assess the significance of the findings. If the p-value is below the significance threshold (commonly 0.05), the null hypothesis is rejected, suggesting that there is a significant difference between the groups. However, ANOVA, due to the number of groups involved, typically produces an F-statistic, whereas the T-test produces a t-statistic.
One-way ANOVA vs T-test
A One-way ANOVA is used when there is one independent variable with more than two levels (groups). For example, if a researcher is comparing the effects of three different diets on weight loss, a One-way ANOVA would be the appropriate test to use.
In contrast, a T-test can only compare two groups at a time. If the same researcher wanted to compare two of the diets (say, Diet A vs. Diet B), a T-test would be used. However, using multiple T-tests to compare all possible pairs (Diet A vs. Diet B, Diet B vs. Diet C, and Diet A vs. Diet C) increases the chance of Type I error. ANOVA solves this problem by testing all groups simultaneously.
Example of One-way ANOVA vs T-test
- One-way ANOVA: A researcher compares three different teaching methods on student performance.
- T-test: A researcher compares the performance between two teaching methods (e.g., Method A vs. Method B).
The One-way ANOVA allows for a comparison of all three teaching methods at once, while the T-test could only compare two of them.
Two-way ANOVA vs T-test
A Two-way ANOVA is used when there are two independent variables, and it examines both the main effects of each variable as well as any interaction effects between the two variables. For example, a researcher might study the effect of two factors (e.g., teaching method and student gender) on student performance.
A T-test, on the other hand, is limited to comparing two groups at a time and cannot handle two independent variables simultaneously. Thus, a T-test would not be suitable for analyzing the interaction between two independent variables as Two-way ANOVA can.
Example of Two-way ANOVA vs T-test
- Two-way ANOVA: A study comparing the effects of teaching method (Method A vs. Method B) and student gender (Male vs. Female) on student performance.
- T-test: A study comparing the performance between male and female students using a single teaching method.
ANOVA vs Chi-Square
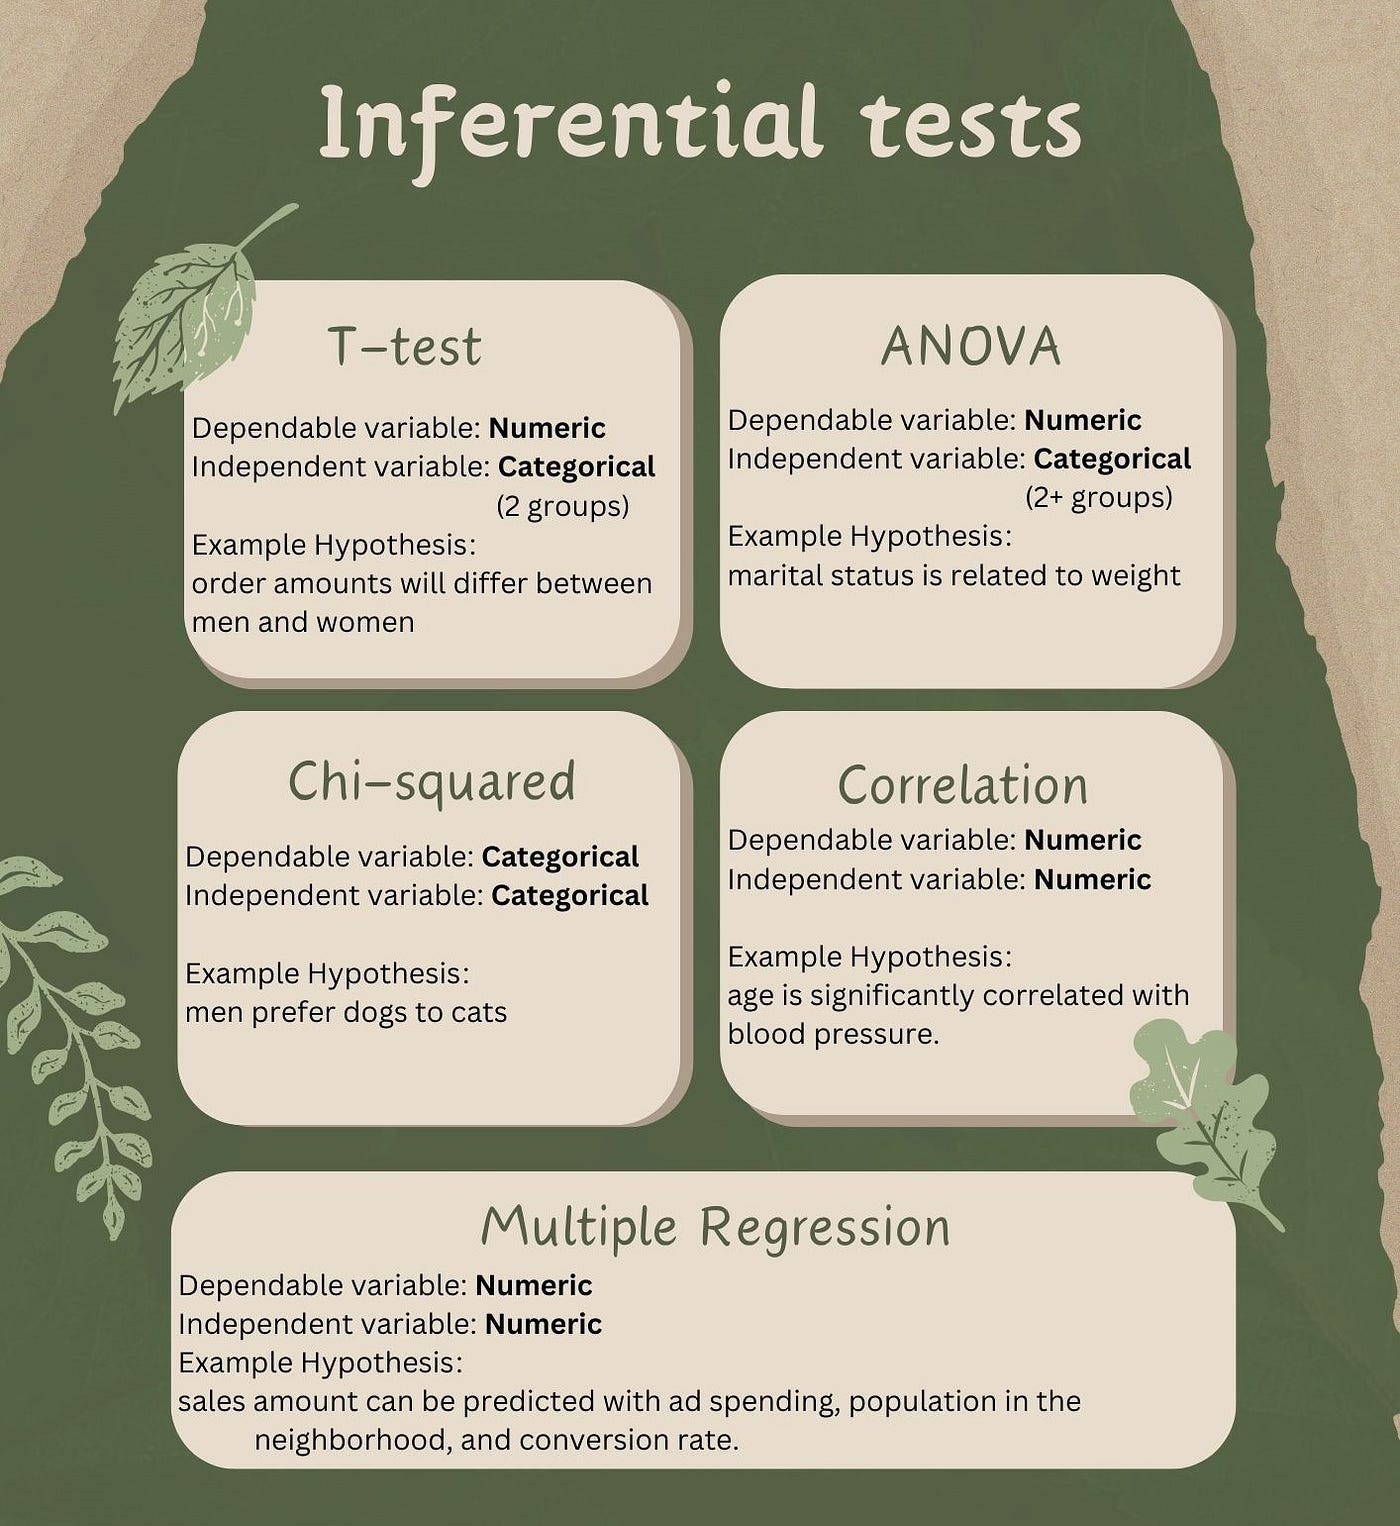
While both ANOVA and the Chi-square test are used to analyze data, they serve different purposes and are applied in different situations. ANOVA is used to compare means across groups, while the Chi-square test is used to assess the association between categorical variables.
For example, if you wanted to see whether there is a relationship between gender (Male/Female) and voting preference (Party A/Party B), you would use the Chi-square test. However, if you were comparing the average voting preference score between three different age groups, ANOVA would be more appropriate.
Difference between ANOVA and Chi-Square
- ANOVA: Compares the means of continuous data across groups.
- Chi-square: Tests the association between categorical variables.

Conclusion
In conclusion, both the T-test and ANOVA are essential tools in statistical analysis, each suited to different research questions. The T-test is ideal for comparing the means of two groups, while ANOVA is used when dealing with three or more groups. When working with multiple independent variables, Two-way ANOVA offers greater insight than a T-test. While the Chi-square test serves a different purpose by analyzing categorical data, its role is equally important in statistical analysis.
Needs help with similar assignment?
We are available 24x7 to deliver the best services and assignment ready within 3-4 hours? Order a custom-written, plagiarism-free paper
