Introduction to Statistical Software SPSS|2025
Get started with Introduction to Statistical Software SPSS. Learn key features, data analysis techniques, and how SPSS simplifies statistical research.
Biostatistics is an essential discipline within the field of biological sciences and health research. It involves the application of statistical principles and methods to address questions in biology, public health, and medicine. By combining mathematical techniques with biological concepts, biostatistics provides critical insights for research, policy-making, and clinical decision-making. This paper introduces the fundamentals of biostatistics and focuses on the use of statistical software, specifically SPSS (Statistical Package for the Social Sciences), as a powerful tool for statistical analysis.
SPSS is one of the most widely used software applications for data management and statistical analysis in biostatistics. It is user-friendly, versatile, and well-suited for analyzing complex datasets. This paper serves as a comprehensive guide for understanding biostatistics and navigating SPSS, offering insights for students, researchers, and professionals in the biological and health sciences.
Understanding Biostatistics
Definition and Importance of Biostatistics
Biostatistics is the application of statistical methods to biological, medical, and public health data. Its primary purpose is to provide tools for designing studies, analyzing data, and interpreting results in order to answer specific research questions. By enabling researchers to make informed decisions based on data, biostatistics plays a crucial role in advancing scientific knowledge and improving public health outcomes.
Key applications of biostatistics include:
- Designing and analyzing clinical trials.
- Monitoring disease outbreaks and assessing public health interventions.
- Identifying risk factors for diseases through epidemiological studies.
- Evaluating the effectiveness of medical treatments.
- Supporting evidence-based decision-making in healthcare policy.
Core Concepts in Biostatistics
Before delving into statistical software like SPSS, it is important to understand some basic concepts in biostatistics:
- Descriptive Statistics: These summarize and describe the main features of a dataset. Common descriptive statistics include measures of central tendency (mean, median, mode) and measures of variability (range, variance, standard deviation).
- Inferential Statistics: These allow researchers to draw conclusions about a population based on data collected from a sample. Inferential methods include hypothesis testing, confidence intervals, and regression analysis.
- Probability: This is the foundation of statistical inference, quantifying the likelihood of events occurring.
- Study Design: Effective study design ensures valid and reliable results. Common designs include cross-sectional studies, cohort studies, case-control studies, and randomized controlled trials.
- Data Types: Data can be classified as categorical (nominal, ordinal) or numerical (interval, ratio). Understanding data types is critical for selecting appropriate statistical methods.
Introduction to Statistical Software SPSS
SPSS is a powerful and versatile statistical software package widely used in biostatistics, social sciences, and other disciplines. It simplifies data management and statistical analysis, making it accessible to users with varying levels of statistical expertise. This section provides an overview of SPSS, its features, and its applications in biostatistics.
Features of SPSS
- User-Friendly Interface: SPSS offers a graphical user interface (GUI) that allows users to perform statistical analyses without requiring programming knowledge. The software uses menus and dialog boxes to guide users through data management and analysis.
- Data Management: SPSS supports importing data from various formats, such as Excel, CSV, and text files. It also provides tools for cleaning, transforming, and organizing data.
- Statistical Analysis: SPSS includes a wide range of statistical techniques, from basic descriptive statistics to advanced multivariate analyses. Examples include t-tests, ANOVA, regression, and factor analysis.
- Visualization: The software provides tools for creating graphs, charts, and plots to visualize data and analysis results effectively.
- Customizability: Advanced users can write scripts using the SPSS syntax or integrate the software with programming languages like Python and R for more complex analyses.
Applications of SPSS in Biostatistics
SPSS is particularly useful in biostatistics for tasks such as:
- Conducting descriptive and inferential analyses of health and medical data.
- Analyzing survey data to assess public health trends.
- Performing epidemiological studies to identify disease risk factors.
- Evaluating the effectiveness of interventions using experimental and quasi-experimental designs.
- Generating reports and visualizations for data presentation.
Getting Started with SPSS
Installing and Setting Up SPSS
To begin using SPSS, users must install the software on their computer. SPSS is compatible with both Windows and macOS operating systems. The installation process typically involves:
- Downloading the SPSS installer from the official IBM website or a licensed distributor.
- Following the installation wizard to set up the software.
- Activating the software using a license key or a trial version.
Once installed, users can launch SPSS and explore its features through the main interface, which includes the Data View and Variable View tabs.
Navigating the SPSS Interface
- Data View: This tab displays the dataset in a spreadsheet format, with rows representing cases (e.g., participants) and columns representing variables (e.g., age, weight, blood pressure).
- Variable View: This tab provides information about the variables in the dataset, such as variable names, types, labels, and measurement levels.
- Menus and Toolbars: SPSS features menus and toolbars for accessing data management tools, statistical analyses, and visualization options.
Importing and Managing Data in SPSS
To analyze data in SPSS, users must first import it into the software. Common file formats supported by SPSS include:
- Excel (.xlsx, .xls).
- CSV (.csv).
- Text (.txt).
- SPSS (.sav).
After importing data, users can:
- Rename variables and assign labels.
- Define measurement levels (nominal, ordinal, scale).
- Handle missing data by replacing or excluding values.
Performing Basic Analyses in SPSS
Descriptive Statistics
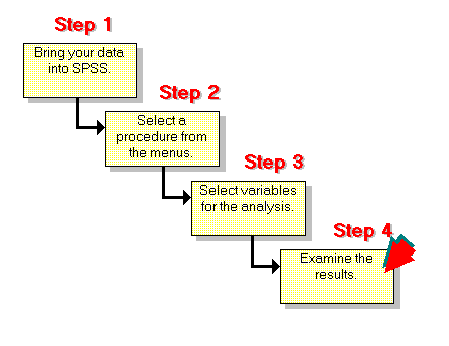
To generate descriptive statistics, follow these steps:
- Navigate to “Analyze > Descriptive Statistics > Frequencies.”
- Select the variables of interest.
- Choose statistics and chart options (e.g., mean, standard deviation, histogram).
- Click “OK” to view results in the output window.
Inferential Statistics
SPSS supports a variety of inferential statistical tests, including:
- T-tests: Compare means between two groups.
- ANOVA: Analyze differences among multiple groups.
- Chi-Square Test: Assess relationships between categorical variables.
- Regression Analysis: Examine relationships between independent and dependent variables.
For example, to perform a t-test:
- Navigate to “Analyze > Compare Means > Independent-Samples T Test.”
- Select the test variable and grouping variable.
- Define group codes (e.g., 1 = male, 2 = female).
- Click “OK” to view results in the output window.
Data Visualization
SPSS offers tools for creating visualizations such as:
- Bar charts.
- Line graphs.
- Scatterplots.
- Boxplots.
To create a chart, go to “Graphs” in the menu, select the desired chart type, and customize options.
SPSS Syntax
While the SPSS GUI is user-friendly, the software also allows users to write and execute commands using SPSS syntax. This feature is particularly useful for:
- Automating repetitive tasks.
- Ensuring reproducibility of analyses.
- Customizing analyses beyond the capabilities of the GUI.
For example, the following syntax calculates descriptive statistics for a variable named “age”:
DESCRIPTIVES VARIABLES=age
  /STATISTICS=MEAN STDDEV MIN MAX.
To execute syntax, open a new syntax editor window, enter the commands, and click the “Run” button.
Advantages of Using SPSS in Biostatistics
- Ease of Use: SPSS is designed for users with limited statistical knowledge, making it accessible to a wide audience.
- Comprehensive Features: The software supports a wide range of statistical techniques and data visualization tools.
- Efficiency: SPSS streamlines data analysis, allowing users to focus on interpreting results rather than coding.
- Integration: SPSS integrates with other software and programming languages for advanced analyses.
- Reproducibility: SPSS syntax ensures that analyses can be easily replicated and documented.
Limitations of SPSS
Despite its strengths, SPSS has some limitations:
- Cost: SPSS is a commercial software, and its licensing fees can be expensive for individual users.
- Limited Flexibility: While user-friendly, the GUI may lack the flexibility required for highly specialized analyses.
- Performance with Large Datasets: SPSS can be slow when handling very large datasets.
- Dependence on Syntax for Advanced Features: Some advanced features require knowledge of SPSS syntax, which may be challenging for beginners.
Conclusion
Biostatistics is a vital discipline for understanding and addressing complex health and biological problems. SPSS, as a leading statistical software, plays a significant role in enabling researchers to analyze data efficiently and accurately. By providing user-friendly tools for data management, statistical analysis, and visualization, SPSS empowers users to derive meaningful insights from their data.
For students, researchers, and professionals in biostatistics, mastering SPSS is an invaluable skill. With its wide range of features and applications, SPSS facilitates the translation of raw data into actionable knowledge, ultimately contributing to advancements in science and public health.
For further learning, users are encouraged to explore resources such as SPSS tutorials, online courses, and comprehensive guides, including “Biostatistics: Introduction to Statistical Software SPSS PPT” and “Biostatistics: Introduction to Statistical Software SPSS Notes.” These materials provide step-by-step instructions and examples to help users maximize the potential of SPSS in their biostatistical analyses.
Needs help with similar assignment?
We are available 24x7 to deliver the best services and assignment ready within 3-4 hours? Order a custom-written, plagiarism-free paper


