Time Management Strategies for Data Analysis Projects|2025
Discover effective time management strategies for data analysis projects. Learn how to organize tasks, prioritize work, and meet deadlines for successful and efficient data-driven research.
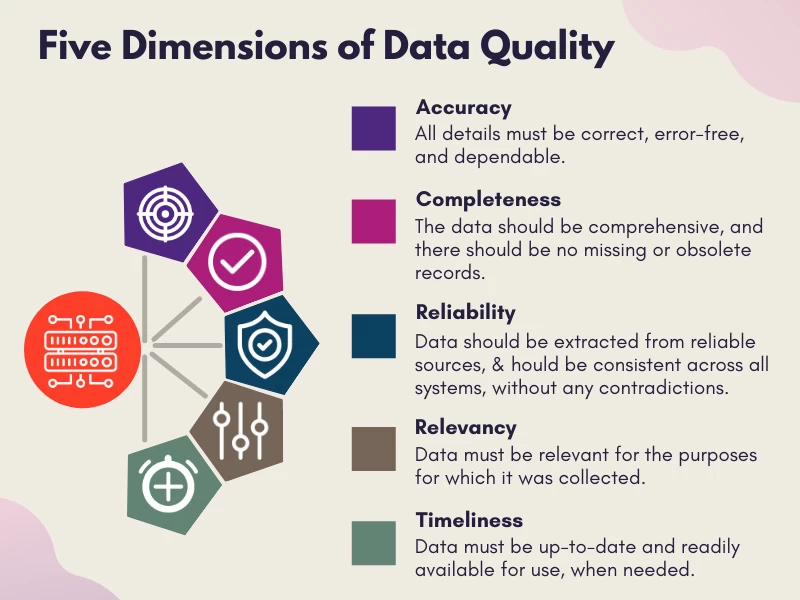
Effective time management is essential for the successful completion of any project, particularly for data analysis projects where precision, deadlines, and coordination play critical roles. These projects often involve handling large datasets, complex analytical techniques, and the integration of multidisciplinary inputs, making time management a cornerstone of their success. This paper explores practical strategies for managing time effectively in data analysis projects, emphasizing the role of project management skills, Agile methodologies, and modern tools and techniques. It also addresses common time management issues and offers solutions to overcome them.
The Importance of Time Management in Data Analysis Projects
Time management for project managers is a vital skill that ensures tasks are completed within the set deadlines while maintaining quality and efficiency. Data analysis projects typically involve multiple phases such as data collection, cleaning, exploration, modeling, and reporting. Each phase must be carefully planned and executed to avoid delays that can compromise the project’s objectives. For project managers, time management involves allocating resources effectively, scheduling tasks realistically, and mitigating risks that may impact timelines.
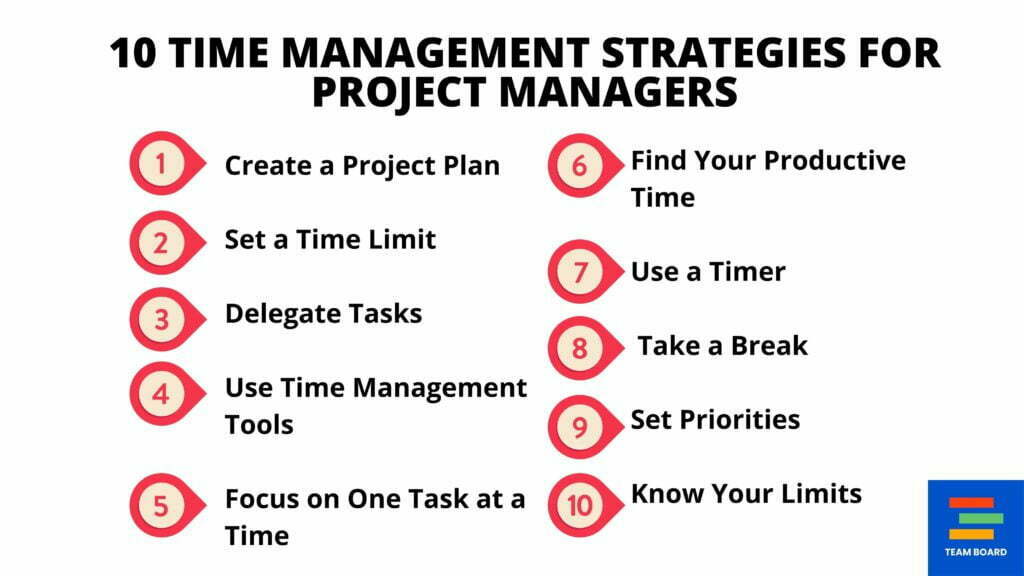
Key Time Management Strategies
Define Clear Objectives and Scope
One of the first steps in managing time effectively is to define clear objectives and establish the project’s scope. When everyone involved understands what needs to be achieved, they can prioritize tasks more efficiently. For example, in a data analysis project, clear objectives may include identifying specific insights, creating predictive models, or generating reports for decision-making. Having a well-defined scope helps prevent scope creep, which is a common time management issue in project management.
Develop a Detailed Project Plan
A comprehensive project plan serves as a roadmap for the entire project. This plan should include:
- Milestones: Key achievements that mark the completion of project phases.
- Timelines: Realistic deadlines for each task.
- Dependencies: Understanding which tasks depend on others for completion.
- Resources: Allocation of team members and tools required for each phase.
Using project management tools and techniques, such as Gantt charts and Work Breakdown Structures (WBS), can significantly enhance the planning process.
Leverage Agile Methodologies
Time management in Agile projects focuses on flexibility and iterative progress. Agile frameworks, such as Scrum, emphasize short development cycles (sprints) and regular feedback, which can be particularly beneficial for data analysis projects. By breaking down the project into smaller, manageable parts, teams can quickly adapt to changes, such as the discovery of data quality issues or new business requirements.
For instance, during a sprint, the team may focus on cleaning and preparing data while simultaneously validating their approach with stakeholders. This iterative process minimizes rework and ensures that time is used efficiently.
Prioritize Tasks with the Eisenhower Matrix
The Eisenhower Matrix categorizes tasks based on urgency and importance:
- Urgent and Important: Do these tasks immediately.
- Important but Not Urgent: Schedule these tasks for later.
- Urgent but Not Important: Delegate these tasks.
- Neither Urgent nor Important: Eliminate these tasks.
Project managers can use this matrix to ensure that critical tasks, such as data validation and quality checks, are prioritized while non-essential activities are minimized.
Utilize Modern Project Management Tools
Project management tools and techniques can significantly improve time management by streamlining workflows and providing real-time updates. Tools like Trello, Asana, and Microsoft Project enable teams to:
- Assign tasks and track their progress.
- Set deadlines and receive notifications for upcoming tasks.
- Collaborate and communicate effectively.
For data analysis projects, tools like JIRA can be particularly useful for managing Agile workflows, while platforms like Tableau and Power BI can aid in visualizing progress and outcomes.
Adopt Time-Boxing Techniques
Time-boxing involves allocating a fixed amount of time to complete a task or activity. This technique helps prevent tasks from expanding beyond their intended scope and encourages focused effort. For example, dedicating a specific time block for data cleaning ensures that this phase doesn’t consume resources meant for other critical phases, such as modeling and interpretation.
Conduct Regular Meetings and Reviews
Regular check-ins and reviews keep everyone aligned and help identify potential issues early. For Agile projects, daily stand-up meetings are an effective way to track progress and address obstacles. Additionally, retrospective meetings at the end of each sprint allow teams to reflect on what worked well and what needs improvement.
.webp)
Addressing Time Management Issues in Project Management
Despite careful planning, time management issues can still arise in data analysis projects. Some common challenges include:
Underestimating Task Durations
Many project managers struggle with accurately estimating the time required for tasks. This issue can lead to unrealistic deadlines and project delays. To address this, project managers should:
- Use historical data from similar projects to inform estimates.
- Incorporate buffer time for unexpected delays.
- Seek input from team members who will be performing the tasks.
Lack of Clear Communication
Poor communication can lead to misunderstandings and wasted time. Project managers should establish clear communication channels and ensure that all stakeholders are informed of project updates and expectations.
Ineffective Delegation
Failure to delegate tasks effectively can overload key team members and slow down progress. By identifying team members’ strengths and assigning tasks accordingly, project managers can ensure that work is distributed efficiently.
Changing Project Requirements
Scope creep, or the continuous addition of new requirements, is a common issue in data analysis projects. To mitigate this, project managers should:
- Establish a clear change management process.
- Regularly review and prioritize project requirements.
- Communicate the impact of changes on timelines and resources.

Building Time Management Skills for Project Managers
Indeed, project management skills and time management are intertwined. Project managers must continually develop their skills to effectively balance the competing demands of time, quality, and resources. Key skills include:
Prioritization
Effective prioritization ensures that critical tasks are completed first, reducing the risk of delays.
Risk Management
Anticipating and addressing potential risks, such as data quality issues or tool limitations, helps keep projects on track.
Decision-Making
Timely decision-making is essential for resolving issues and adapting to changes without compromising project timelines.
Adaptability
In dynamic environments, the ability to adapt plans and strategies quickly is a valuable skill for project managers.

The Role of Technology in Time Management
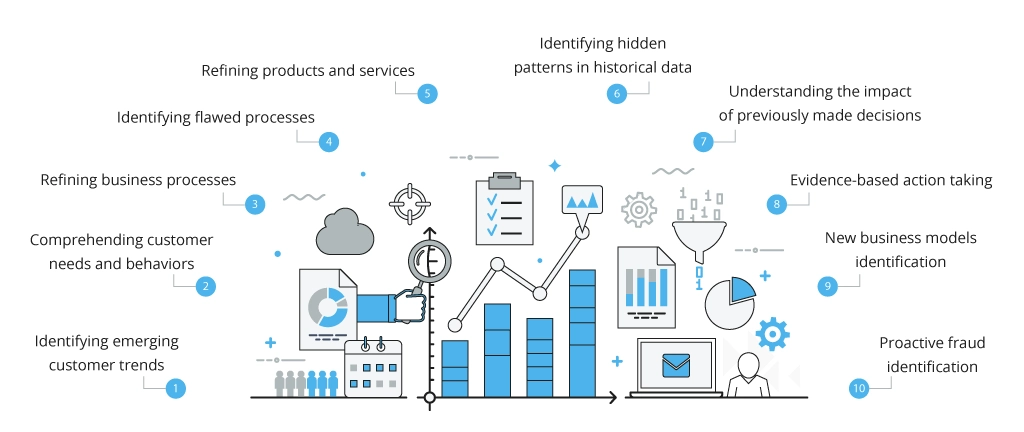
Advancements in technology have transformed how time is managed in data analysis projects. Automation tools, for example, can handle repetitive tasks like data cleaning and report generation, freeing up time for more strategic activities. Machine learning algorithms can expedite data analysis by identifying patterns and insights more quickly than manual methods.
Collaboration platforms like Slack and Microsoft Teams enhance communication and reduce the time spent on emails and meetings. Additionally, cloud-based tools enable remote teams to work seamlessly, ensuring that time zones and physical distances do not hinder progress.
Conclusion
Effective time management is critical for the success of data analysis projects. By defining clear objectives, leveraging Agile methodologies, and utilizing modern project management tools, project managers can optimize workflows and ensure timely delivery of results. Addressing common time management issues and continually developing project management skills further enhances the likelihood of success.
As data analysis projects become increasingly complex, adopting these time management strategies will not only improve efficiency but also ensure that projects deliver maximum value to stakeholders. With the right approach and tools, project managers can navigate the challenges of time management and lead their teams to success.
Needs help with similar assignment?
We are available 24x7 to deliver the best services and assignment ready within 3-4 hours? Order a custom-written, plagiarism-free paper