Biostatistics Analysis Help: A Comprehensive Guide|2025
/in General Articles /by BesttutorGet expert Biostatistics Analysis Help: A Comprehensive Guide. Learn key concepts, statistical methods, and best practices to analyze biological data effectively.
Introduction to Biostatistics and Its Importance in Research
Biostatistics is a branch of statistics that deals with the application of statistical methods to biological, medical, and health-related research. It plays a critical role in the design, analysis, and interpretation of data from experiments and studies in health and medicine. Biostatistics helps researchers draw meaningful conclusions from complex biological and clinical data, ensuring that findings are valid, reliable, and applicable to real-world contexts.
Researchers rely on biostatistics for various purposes, including evaluating treatment effectiveness, understanding disease prevalence, studying risk factors, and testing hypotheses. As the volume of data in health research grows, so does the need for accurate and efficient biostatistical analysis. Therefore, this paper provides a comprehensive overview of biostatistical analysis methods, highlighting the need for biostatistics analysis help and offering practical guidance for those working in the field.
Types of Biostatistics Analysis Help
Biostatistical analysis involves both descriptive and inferential statistics, each of which has distinct applications in health-related research. Researchers may seek biostatistics analysis help for different reasons, ranging from choosing the right analytical method to interpreting complex results. Below, we explore the two key areas of biostatistics analysis help.
Descriptive Statistics Analysis Help
Descriptive statistics is the process of summarizing and organizing data in a meaningful way to understand patterns and relationships. Descriptive statistics analysis help is commonly sought by researchers to summarize data and gain initial insights into the dataset. This involves calculating measures such as:
- Measures of Central Tendency: Mean, median, and mode.
- Measures of Variability: Range, variance, and standard deviation.
- Frequency Distributions: Tables, histograms, and bar charts.
For example, in a clinical trial studying the effects of a new drug on blood pressure, researchers may collect data on patients’ blood pressure levels before and after treatment. Descriptive statistics analysis help would allow them to summarize the changes in blood pressure by calculating the mean, median, and standard deviation of pre- and post-treatment measurements.
Example: To calculate the mean and standard deviation of blood pressure in a sample group of 100 patients, one would first sum all the blood pressure measurements and divide by the total number of patients to calculate the mean. The standard deviation can be calculated using the formula that measures how much individual data points deviate from the mean.
Inferential Statistics Analysis Help
Inferential statistics allows researchers to make inferences or generalizations about a population based on a sample. This type of analysis is crucial for hypothesis testing and estimating parameters, such as population means and proportions. Biostatistics analysis help in research often focuses on the application of inferential statistical methods, which include:
- Hypothesis Testing: Testing null and alternative hypotheses using techniques like t-tests, chi-square tests, and ANOVA.
- Confidence Intervals: Estimating population parameters with a given level of confidence.
- Regression Analysis: Examining relationships between dependent and independent variables.
For example, if researchers wish to determine whether a new drug is more effective than a placebo, they may conduct a t-test to compare the means of the two groups. Biostatistics analysis help would guide the researcher in selecting the appropriate statistical test and interpreting the results.
Example: A clinical trial comparing the efficacy of two drugs in reducing blood pressure may use a two-sample t-test. The null hypothesis (H₀) might state that there is no difference between the two drugs, while the alternative hypothesis (H₁) suggests that there is a significant difference. By analyzing the sample data, researchers can determine whether to reject the null hypothesis.

The Role of Biostatistics in Health and Medical Research
Biostatistics plays a fundamental role in advancing scientific knowledge in the fields of medicine, public health, and biology. Some of the key roles biostatistics performs in health research include:
- Designing Studies: Biostatistics analysis help is often sought during the study design phase to ensure that the research methods are statistically sound. This involves selecting an appropriate sample size, randomization methods, and statistical tests.
- Data Analysis: Biostatisticians are trained to analyze large datasets, often using sophisticated software programs like SPSS, SAS, or R. These tools enable researchers to perform various statistical tests and model complex relationships between variables.
- Predicting Outcomes: In clinical research, biostatistics is used to predict patient outcomes and assess the risk of disease or adverse events based on certain predictors.
- Evaluating Treatment Effects: One of the primary applications of biostatistics is evaluating the efficacy of new treatments or interventions. Researchers use statistical methods to compare the effects of treatments in randomized controlled trials.
- Public Health Research: Biostatistics is essential for monitoring and understanding trends in public health, such as disease prevalence, mortality rates, and the effects of public health policies.
How to Write a Descriptive Statistics Analysis Example
Writing a descriptive statistics analysis example involves clearly presenting and interpreting summary statistics for a dataset. Here are the key steps for writing such an analysis:
- Introduce the Dataset: Briefly describe the dataset, including its source, the variables included, and the sample size. For example, you may explain that you are analyzing blood pressure data from a clinical trial with 100 participants.
- Calculate Summary Statistics: Compute the mean, median, mode, standard deviation, and other relevant statistics. For example, the mean blood pressure level could be calculated as the average of all readings.
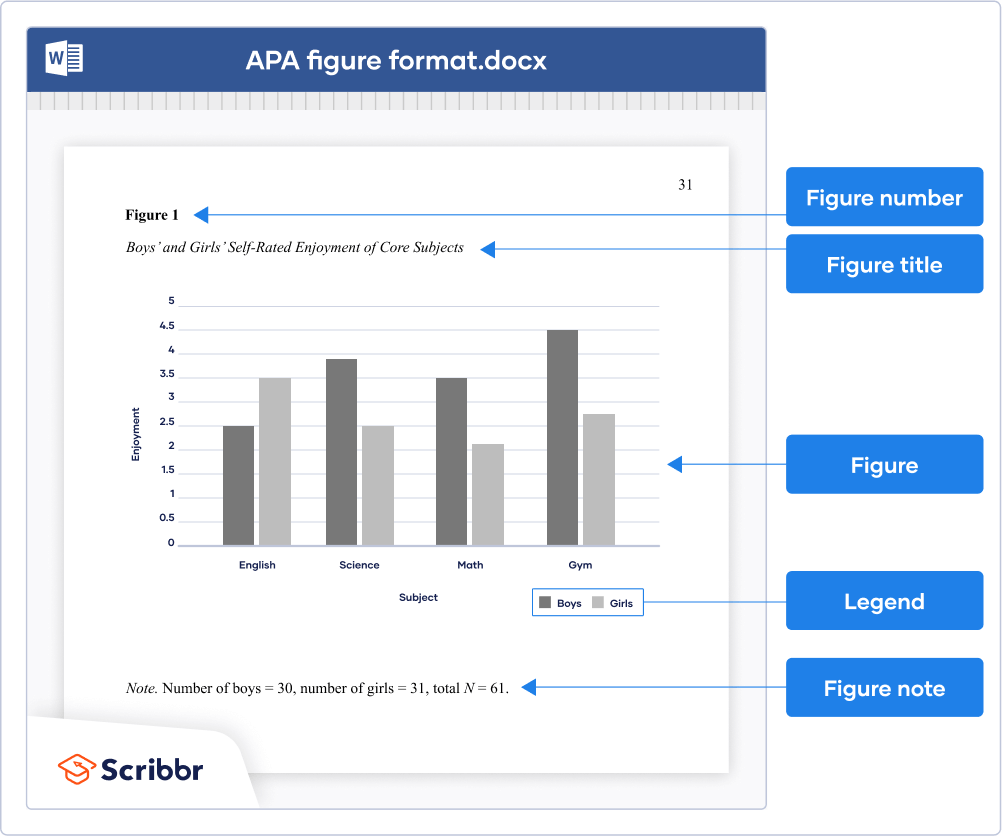
- Visualize the Data: Include visual aids like histograms, boxplots, or bar charts to present the data distribution. This helps readers understand patterns and trends visually.
- Interpret the Results: Provide an interpretation of the statistical measures. For instance, if the standard deviation is large, this indicates high variability in the data.
- Draw Conclusions: Summarize the key takeaways from the descriptive analysis. For example, you might conclude that the sample population has a wide range of blood pressure levels, and additional analysis is needed to examine relationships between blood pressure and other factors.
Statistical Analysis for Data Analysis
Statistical analysis for data analysis is crucial for researchers in fields such as medicine, biology, and public health. Effective statistical analysis allows researchers to extract meaningful information from raw data and make evidence-based decisions. There are various types of statistical analysis that researchers commonly use in biostatistics:
- Exploratory Data Analysis (EDA): This approach involves summarizing the main characteristics of a dataset, often using graphical methods. EDA helps researchers identify patterns, outliers, and relationships within the data.
- Regression Analysis: This technique is used to model relationships between a dependent variable and one or more independent variables. Regression analysis is frequently employed to predict outcomes or examine the effect of certain variables on health outcomes.
- Analysis of Variance (ANOVA): ANOVA is used when comparing means across three or more groups. For instance, researchers may use ANOVA to compare the effects of different treatments on a particular health condition.
- Chi-Square Test: The chi-square test is used for categorical data to assess the association between two variables. It helps determine whether observed frequencies differ significantly from expected frequencies.
- Survival Analysis: This method is used to analyze the time until an event occurs, such as the time until a patient experiences a relapse after treatment. Kaplan-Meier curves and Cox regression models are common tools used in survival analysis.
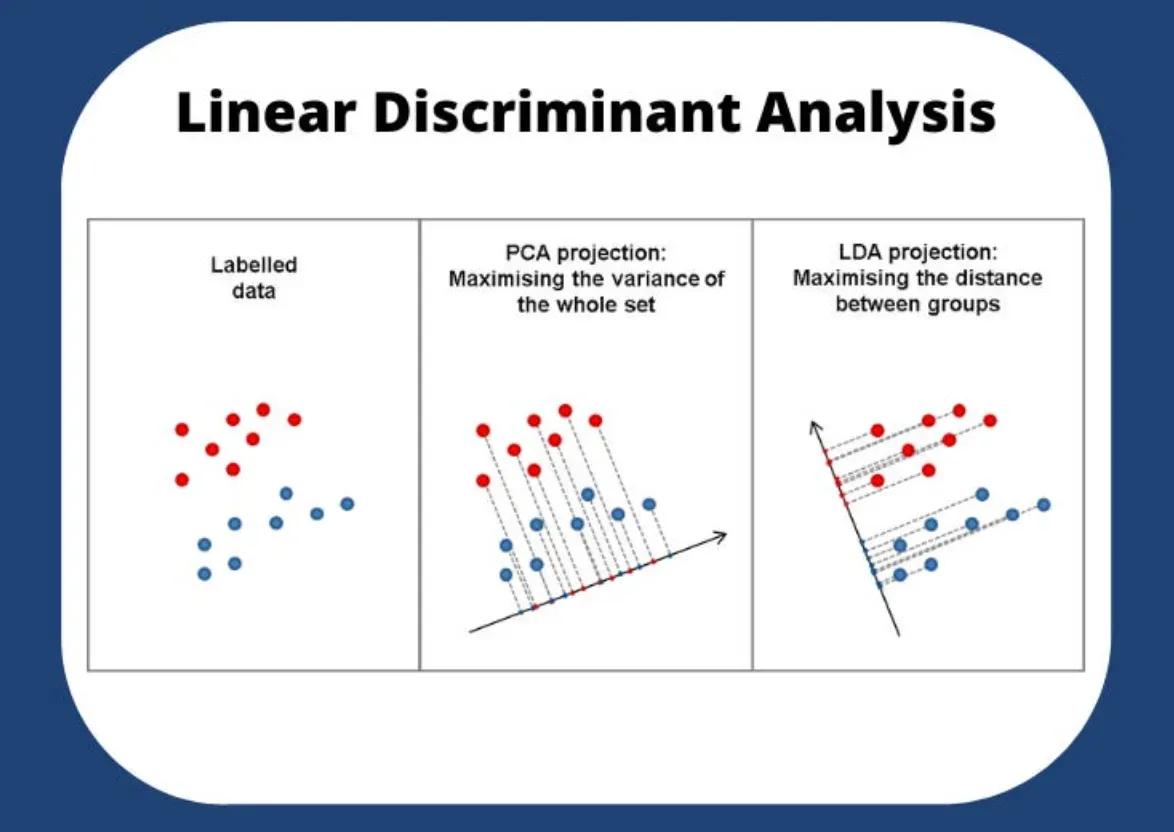
- Multivariate Analysis: When dealing with multiple variables simultaneously, multivariate analysis allows researchers to understand complex relationships between different factors. Techniques like principal component analysis (PCA) or factor analysis can reduce dimensionality and reveal underlying structures in the data.

Biostatistics Analysis Help in Research PDF
Biostatistics analysis help in research PDF resources are valuable for researchers who need a comprehensive guide on applying biostatistical methods in their studies. These PDFs often provide step-by-step instructions, practical examples, and detailed explanations of statistical tests. They are especially useful for individuals new to biostatistics or those seeking a reference for specific analysis techniques.
PDF resources on biostatistics analysis typically include:
- Detailed explanations of statistical concepts.
- Instructions for performing common statistical tests.
- Examples of biostatistical analysis in real-world research.
- Case studies that demonstrate how biostatistics is applied in health and medical research.
These resources can help researchers navigate the complexities of biostatistics, ensuring that they apply the correct methods and interpret results accurately.

Conclusion
Biostatistics analysis is an essential component of health and medical research, providing researchers with the tools necessary to analyze complex data, test hypotheses, and draw valid conclusions. Whether you are conducting a clinical trial, exploring disease trends, or studying the effectiveness of an intervention, biostatistics helps ensure the reliability and validity of your findings. Biostatistics analysis help in research is crucial for guiding researchers through the various stages of study design, data analysis, and interpretation, allowing them to make informed decisions and contribute to scientific knowledge.
Whether you are seeking biostatistics analysis help for descriptive statistics, inferential statistics, or advanced methods like regression analysis, there are numerous resources available, including PDF guides, textbooks, and online courses. As the field of biostatistics continues to evolve, researchers must stay up-to-date with the latest methods and tools to maximize the impact of their research and improve public health outcomes.
Needs help with similar assignment?
We are available 24x7 to deliver the best services and assignment ready within 3-4 hours? Order a custom-written, plagiarism-free paper