The Role of Quantitative Analysis in Finance|2025
The Role of Quantitative Analysis in Finance: Discover how quantitative methods drive decision-making, risk assessment, and investment strategies in the financial industry.
Quantitative analysis, often referred to as “quant” in the financial industry, is a field of study that uses mathematical and statistical techniques to analyze financial and business data. Its role in finance has grown tremendously over the years as data-driven decision-making becomes increasingly central to business operations. By understanding and applying quantitative methods, organizations can predict market trends, assess risk, and optimize investment portfolios. This paper explores the role of quantitative analysis in finance, its examples, intersections with other fields like chemistry and business, and related career opportunities.
:max_bytes(150000):strip_icc()/quantitativeanalysis.asp_FINAL-a648a28b51bf4c0db606d8d88e356ffb.png)
What is Quantitative Analysis in Finance?
Quantitative analysis in finance involves the application of mathematical models and statistical tools to assess and manage financial risks and opportunities. It provides a framework for decision-making by using data to derive insights about markets, securities, and economic conditions. By leveraging large datasets, financial analysts can uncover patterns, test hypotheses, and project future trends.
A key aspect of quantitative analysis in finance is its ability to provide objective, data-backed solutions to complex problems. For instance, investment managers often rely on quantitative models to determine the optimal allocation of assets in a portfolio. Similarly, credit risk analysts use statistical techniques to evaluate the likelihood of loan defaults.
Quantitative analysis has become indispensable for modern finance due to the vast amounts of data generated daily. From high-frequency trading to algorithmic investment strategies, the role of quantitative methods in finance continues to expand.
Examples of Quantitative Analysis
Quantitative analysis finds application in various financial scenarios. Below are some prominent examples:
- Portfolio Optimization: Quantitative methods are used to determine the best combination of assets that maximizes returns while minimizing risks. The mean-variance optimization model, introduced by Harry Markowitz, is a classic example.
- Risk Management: Techniques such as Value at Risk (VaR) measure the potential loss in the value of an asset or portfolio over a specific time frame. Quantitative analysts use historical data to estimate these risks and design strategies to mitigate them.
- Derivatives Pricing: Financial derivatives like options and futures require precise pricing models. The Black-Scholes model, a quantitative method, calculates the fair value of options by incorporating variables such as volatility, interest rates, and time to maturity.
- High-Frequency Trading (HFT): HFT employs algorithms that execute trades within milliseconds, leveraging small price discrepancies. Quantitative analysis helps develop these algorithms by analyzing real-time market data.
- Credit Scoring Models: Banks and financial institutions use quantitative methods to predict the likelihood of borrowers defaulting on loans. Regression models and machine learning techniques are often employed in this context.
- Economic Forecasting: Quantitative analysts use econometric models to predict economic indicators such as GDP growth, inflation rates, and unemployment.

Quantitative Analysis in Business
Beyond finance, quantitative analysis plays a significant role in broader business contexts. Companies use quantitative methods to make strategic decisions, optimize operations, and improve customer satisfaction. For example:
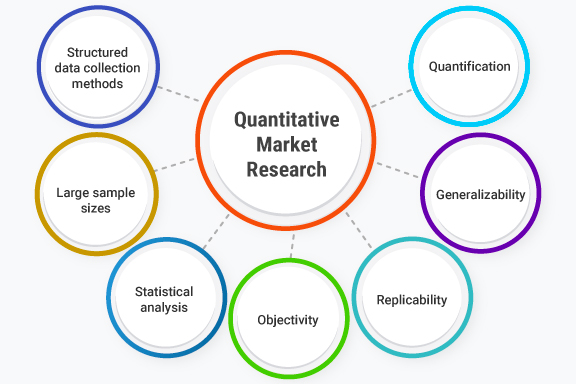
- Market Research: Businesses use statistical techniques to analyze consumer data and identify trends, preferences, and purchasing behaviors.
- Pricing Strategies: Quantitative models help businesses determine optimal pricing strategies by analyzing demand elasticity and competitor pricing.
- Supply Chain Optimization: By analyzing historical data and using predictive models, companies can streamline logistics and inventory management.
- Performance Metrics: Quantitative tools such as key performance indicators (KPIs) and balanced scorecards provide insights into a company’s operational efficiency and profitability.
Quantitative Analysis in Chemistry
Interestingly, quantitative analysis is also a critical concept in fields like chemistry. While its applications in chemistry may not seem directly related to finance, the underlying principles of using numerical data to derive meaningful conclusions remain consistent.
In chemistry, quantitative analysis involves measuring the quantity or concentration of specific substances within a mixture. Techniques such as titration, spectrophotometry, and chromatography rely on mathematical calculations to determine precise results. This meticulous approach to quantification mirrors the precision required in financial analysis, where small miscalculations can lead to significant consequences.
Quantitative Methods in Finance PDF
Professionals and students often rely on resources like the “Quantitative Methods in Finance PDF” to gain a deeper understanding of the subject. These documents typically cover topics such as probability theory, statistical inference, time-series analysis, and Monte Carlo simulations. They also provide practical examples and case studies that bridge theoretical knowledge with real-world applications.
For instance, a “Quantitative Methods in Finance PDF” might delve into:
- How to model stock price movements using stochastic processes.
- Techniques for stress testing financial models.
- Methods to forecast asset prices using regression analysis and machine learning.
Such resources are invaluable for aspiring quantitative analysts who wish to develop the technical skills required in the field.
Quantitative Analysis PDF
Similarly, “Quantitative Analysis PDF” resources often provide a broader view of the discipline, encompassing applications in finance, business, and other fields. These documents serve as comprehensive guides for understanding quantitative techniques, their implementation, and their implications.
Key sections in a “Quantitative Analysis PDF” might include:
- An overview of statistical concepts such as hypothesis testing and confidence intervals.
- Step-by-step guides to building predictive models.
- Applications of quantitative analysis in different industries, including healthcare, manufacturing, and e-commerce.
Quantitative Analyst Salary
A career as a quantitative analyst is highly rewarding, both intellectually and financially. According to recent industry reports, the salary for a quantitative analyst varies based on experience, location, and the specific sector within finance.
- Entry-Level Analysts: Professionals new to the field can expect annual salaries ranging from $70,000 to $120,000.
- Mid-Level Analysts: With a few years of experience, salaries typically rise to $150,000 to $250,000.
- Senior Quantitative Analysts: Senior-level quants or those working in high-demand areas like hedge funds or proprietary trading firms can earn upwards of $500,000, including bonuses.
Factors influencing a quantitative analyst’s salary include:
- Industry: Hedge funds, investment banks, and proprietary trading firms often pay higher salaries compared to commercial banks or consulting firms.
- Education: Advanced degrees, such as a Ph.D. in mathematics, physics, or finance, can significantly boost earning potential.
- Skills: Proficiency in programming languages (e.g., Python, R, MATLAB), knowledge of financial modeling, and expertise in machine learning are highly sought after.
The Future of Quantitative Analysis in Finance
As technology continues to evolve, so too does the field of quantitative analysis in finance. The increasing availability of big data, coupled with advancements in artificial intelligence and machine learning, has opened new avenues for innovation.
- Machine Learning Models: AI-powered models are revolutionizing the way financial data is analyzed. These models can process unstructured data, such as news articles or social media posts, to predict market movements.
- Blockchain and Cryptocurrencies: Quantitative analysis is playing a pivotal role in understanding and navigating the complexities of digital assets and blockchain technology.
- Environmental, Social, and Governance (ESG) Investing: As ESG factors gain prominence, quantitative methods are being developed to measure and integrate these factors into investment decisions.
- Automation in Trading: The use of robotic process automation (RPA) and algorithmic trading is expected to grow, further emphasizing the importance of quantitative expertise.
Conclusion
The role of quantitative analysis in finance cannot be overstated. By leveraging mathematical models and statistical tools, financial professionals can make informed decisions, manage risks, and capitalize on opportunities. From portfolio optimization to high-frequency trading, quantitative methods have transformed the financial industry.
Beyond finance, the principles of quantitative analysis extend to fields like business and chemistry, demonstrating its versatility and importance. Aspiring quantitative analysts have a wealth of resources at their disposal, including “Quantitative Analysis PDF” and “Quantitative Methods in Finance PDF,” to build their knowledge and skills.
With lucrative career prospects and the promise of technological advancements, the future of quantitative analysis in finance remains bright. As the industry continues to embrace data-driven strategies, quantitative analysis will undoubtedly remain at the forefront of innovation and progress.
Needs help with similar assignment?
We are available 24x7 to deliver the best services and assignment ready within 3-4 hours? Order a custom-written, plagiarism-free paper