Choosing the Right Statistical Tool|2025
Learn tips for choosing the right statistical tool. Discover how to select the best method for accurate data analysis and meaningful research insights.
Statistical analysis plays a crucial role in many fields, ranging from scientific research to business decision-making, and SPSS (Statistical Package for the Social Sciences) has long been a go-to tool for performing such analyses. Choosing the correct statistical tool is key to ensuring accurate and meaningful results in any research. SPSS provides various functions to conduct statistical analysis efficiently and effectively. This paper will explore how to choose the right statistical tool with SPSS help, including tips on downloading tutorials, using SPSS with Excel, and understanding key statistical tests with examples.
Introduction
When conducting statistical analysis, choosing the appropriate tool is paramount to ensure that the research question is answered correctly and the results are valid. SPSS is one of the most widely used statistical tools for data analysis, providing a user-friendly interface that allows users to perform a wide range of statistical procedures. Whether you’re performing basic descriptive statistics or more advanced inferential tests, SPSS can guide you through the process. But with numerous statistical tests available, how can you determine which one to use?
The decision-making process depends on the type of data you have, your research questions, and the assumptions behind each statistical test. In this paper, we’ll explore how to choose the right statistical tool using SPSS, provide a guide to common statistical tests and their applications, and offer useful resources for SPSS users. We will also address the ways in which you can use SPSS with Excel and access tutorials for further guidance.
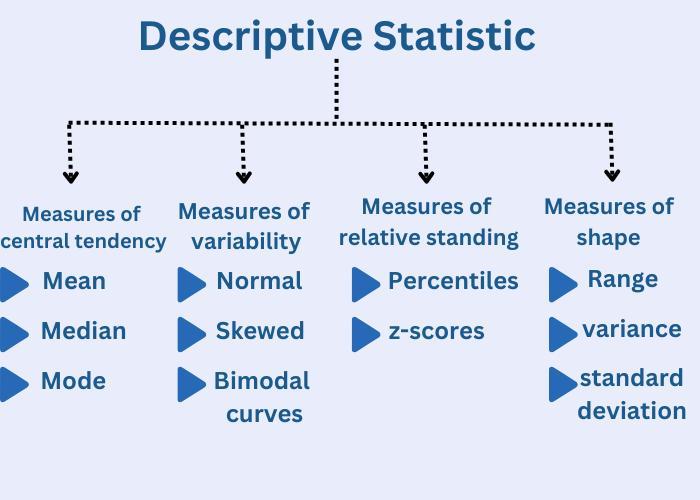
Understanding Statistical Tests and When to Use Them
Choosing the correct statistical test is the foundation of any data analysis. Different tests are designed for specific research scenarios, and using the wrong one can lead to invalid conclusions. Below is a brief overview of some common statistical tests and when to use them.
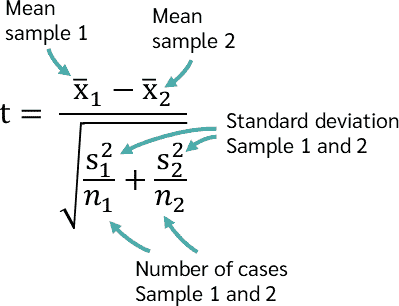
T-test for Independent Samples
When comparing the means of two independent groups, the independent t-test is often used. For example, it can compare the test scores of two different groups of students, one from a public school and one from a private school.
Assumptions:
- The two groups are independent of each other.
- The data is normally distributed.
- Homogeneity of variance: The variances in both groups are roughly equal.
In SPSS, you can perform this test by selecting Analyze > Compare Means > Independent-Samples T Test.
Paired T-test
When comparing the means of two related or paired groups, a paired t-test is used. This test is appropriate when you measure the same group before and after an intervention, such as comparing participants’ blood pressure levels before and after a drug treatment.
Assumptions:
- The differences between the paired measurements are normally distributed.
This test can be conducted in SPSS via Analyze > Compare Means > Paired-Samples T Test.
ANOVA (Analysis of Variance)
ANOVA is used when comparing the means of more than two groups. It is appropriate when you want to test if there are significant differences between three or more independent groups. For example, comparing the performance of three different teaching methods.
Assumptions:
- Independence of observations.
- Normality of the data within each group.
- Homogeneity of variances.
To conduct an ANOVA in SPSS, go to Analyze > Compare Means > One-Way ANOVA.

Chi-Square Test
The Chi-square test is a non-parametric test used to assess whether observed frequencies in categorical data differ from expected frequencies. For example, it can test whether there’s a significant difference between the expected and observed gender distribution in a survey.
Assumptions:
- Data must be categorical.
- Observations are independent.
- Expected frequency in each cell should be at least 5.
SPSS provides the chi-square test under Analyze > Descriptive Statistics > Crosstabs and selecting the Chi-Square option.
Correlation
If you want to assess the relationship between two continuous variables, a correlation test can be performed. The most common method is Pearson’s correlation, which measures the linear relationship between two variables. For example, it can be used to measure the relationship between hours studied and exam scores.
Assumptions:
- The data is normally distributed.
- The relationship between variables is linear.
In SPSS, select Analyze > Correlate > Bivariate.
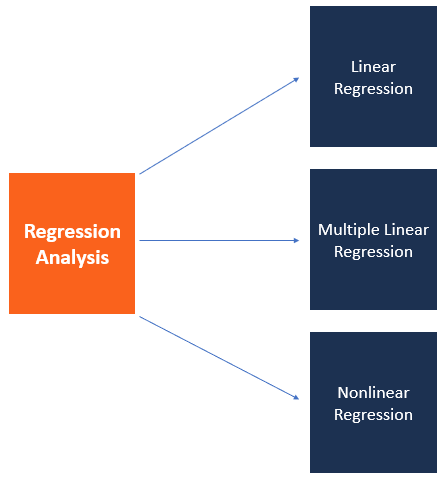
Regression Analysis
Regression analysis helps to understand the relationship between a dependent variable and one or more independent variables. The simplest form is simple linear regression, where you assess the relationship between one independent variable and a dependent variable. Multiple regression is used when there are multiple predictors.
Assumptions:
- The relationship between dependent and independent variables is linear.
- The residuals are normally distributed.
- Homoscedasticity: The variance of the errors is constant.
In SPSS, use Analyze > Regression > Linear.
Mann-Whitney U Test
When your data is non-normally distributed, you might choose the Mann-Whitney U test, which is a non-parametric alternative to the independent t-test. It compares the medians of two independent groups.
In SPSS, select Analyze > Nonparametric Tests > Legacy Dialogs > 2 Independent Samples.
SPSS Help: PDF Resources and Free Downloads
For beginners and even experienced users, SPSS tutorials and guides in PDF format can be a valuable resource to refer to when choosing the right statistical tool. These resources often include step-by-step instructions, examples, and additional tips for data analysis. Some useful guides to look for are:
- Choosing the Right Statistical Tool with SPSS Help PDF: These documents provide detailed guidance on when to use which statistical test, helping users understand the underlying assumptions, limitations, and steps involved in conducting each test with SPSS.
- SPSS Tutorial PDF with Examples: These tutorials walk you through real-life examples, showing how to set up data, run analyses, and interpret the results. They also provide useful tips for handling common challenges with SPSS.
Many SPSS tutorials are available for free download, either from the official IBM SPSS website or from third-party educational sites. These free downloads can be incredibly useful for both students and professionals looking to improve their statistical analysis skills.

Choosing the Right Statistical Tool with SPSS Help Excel
SPSS integrates well with Excel, allowing users to import data from spreadsheets for analysis. Excel data can be exported directly into SPSS, where it can be analyzed using various statistical tools. This integration is particularly useful when users need to prepare data or visualize results before performing more advanced analyses in SPSS.
To use Excel data with SPSS:
- Save your Excel file in
.xlsor.xlsxformat. - Open SPSS and go to
File > Open > Data. - Select your Excel file and make sure the data is properly structured.
- Once the data is imported, you can begin using SPSS functions like descriptive statistics, correlation, or regression analysis.
When to Use SPSS for Statistical Testing
SPSS is an excellent tool for handling both simple and complex data analyses, particularly when you are dealing with large datasets. However, deciding whether to use SPSS or another software depends on the nature of your data and the type of analysis required.
For two independent variables and one dependent variable, commonly used statistical tests in SPSS include ANOVA or Multiple Regression (depending on the research question). In both cases, SPSS can easily perform the calculations and generate results.
If you are comparing two groups, you should typically use an independent t-test or a Mann-Whitney U test, depending on the normality of the data.
Statistical Test for Two Independent Variables and One Dependent Variable
For testing the relationship between two independent variables and a single dependent variable, you might use multiple regression analysis if both independent variables are continuous. If one or both independent variables are categorical, multivariate analysis of variance (MANOVA) or two-way ANOVA could be appropriate.
In SPSS, multiple regression can be accessed under Analyze > Regression > Linear.

Conclusion
Choosing the right statistical tool is crucial in data analysis, and SPSS provides an extensive range of tests that cater to various types of data and research questions. Whether you’re dealing with independent or paired samples, categorical or continuous data, SPSS has the tools you need to perform accurate and reliable analyses.
By leveraging available resources such as SPSS tutorial PDFs, free downloads, and integration with Excel, users can efficiently navigate SPSS to perform statistical tests. Ultimately, the ability to select the appropriate test, coupled with a good understanding of the underlying assumptions, will enhance the quality of your research outcomes.
Needs help with similar assignment?
We are available 24x7 to deliver the best services and assignment ready within 3-4 hours? Order a custom-written, plagiarism-free paper

:max_bytes(150000):strip_icc()/Descriptive_statistics-5c8c9cf1d14d4900a0b2c55028c15452.png)