Non-Parametric Tests: Types and Examples|2025
Explore non-parametric tests, their types, and examples. Learn when to use these statistical methods for analyzing data without assumptions about the population’s distribution.
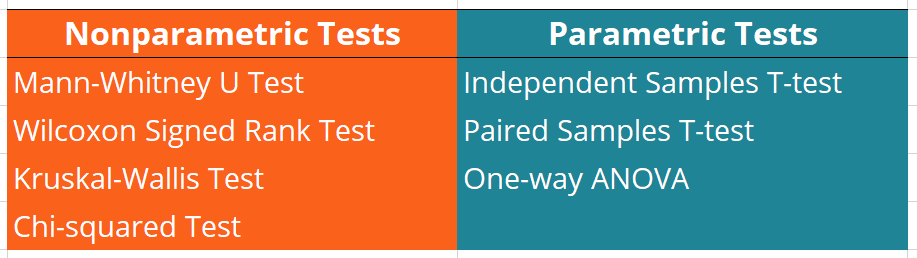
Non-parametric tests, also known as distribution-free tests, are statistical methods used to analyze data without making assumptions about the underlying population distribution. Unlike parametric tests, which require data to follow a specific distribution (typically normal distribution), non-parametric tests are versatile tools that allow researchers to handle data that may not meet such assumptions. Non-parametric tests are particularly valuable in real-world scenarios where the data might be skewed, ordinal, or measured on a non-continuous scale.
This paper explores non-parametric tests, their types, examples, advantages, disadvantages, and their importance in research, offering insight into how they are applied in various contexts.
What Are Non-Parametric Tests?
Non-parametric tests are statistical procedures used when data cannot be assumed to fit a normal distribution, or when the data is ordinal (i.e., ordered categories) or nominal (i.e., categorical). These tests are useful when dealing with small sample sizes, skewed data, or when the assumptions of parametric tests such as the t-test or ANOVA cannot be met. The key feature of non-parametric tests is their ability to assess hypotheses without relying on parameters like mean and standard deviation, which are fundamental to parametric tests.
Types of Non-Parametric Tests
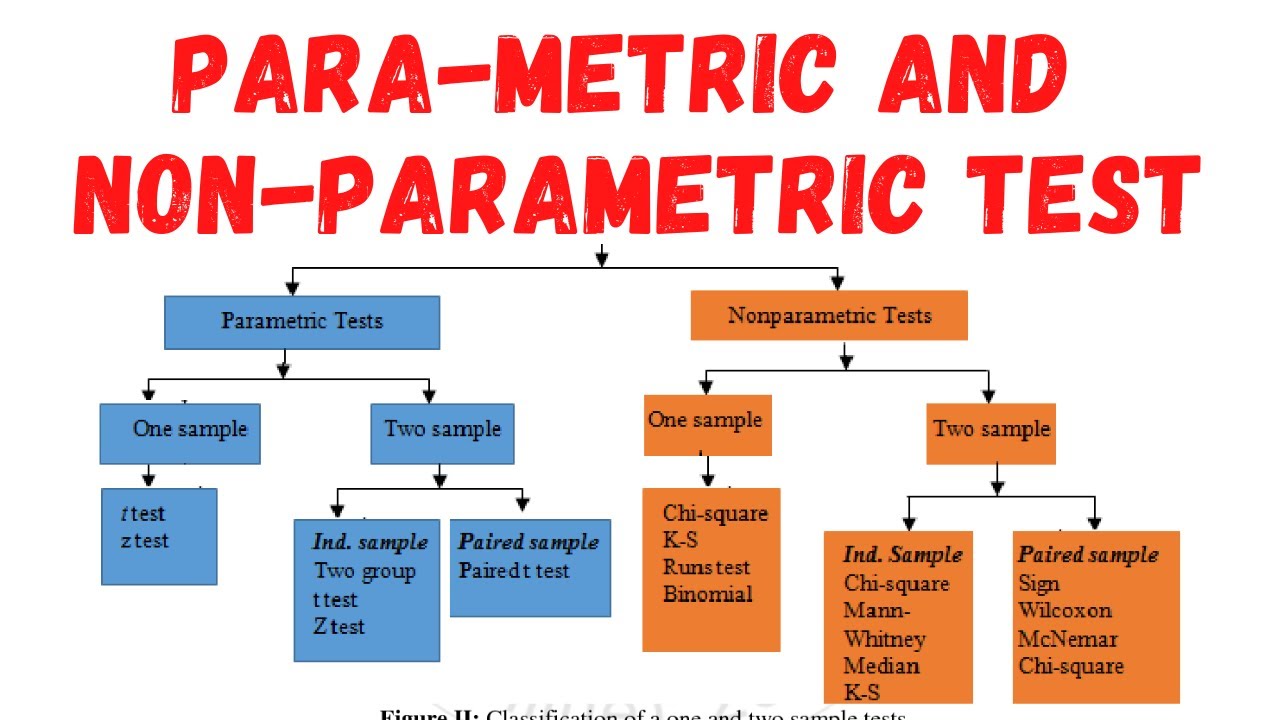
Non-parametric tests can be broadly categorized based on the type of analysis required: comparing two groups, comparing more than two groups, analyzing associations, or testing for goodness of fit. Below, we outline some of the most commonly used non-parametric tests and their applications.
Chi-Square Test
The Chi-Square test is used for categorical data to assess the association between two or more categorical variables. It compares the observed frequency of occurrences in each category with the expected frequency under the null hypothesis.
Example: Suppose a researcher is interested in studying the relationship between gender (male, female) and voting preference (A, B, C). The Chi-Square test can be used to determine if there is a significant relationship between these two categorical variables.
- Advantages: It is widely applicable for large sample sizes and can handle multiple categories.
- Disadvantages: It requires a sufficiently large sample size, and the data must be categorical.
Mann-Whitney U Test (Wilcoxon Rank-Sum Test)
This test is used to compare differences between two independent groups when the data is ordinal or continuous but not normally distributed. It is an alternative to the independent t-test.
Example: A researcher may want to compare the income levels between two groups, Group A and Group B, but the income data is not normally distributed. The Mann-Whitney U test would allow for comparison without assuming normality.
- Advantages: It is suitable for small sample sizes and does not assume normal distribution.
- Disadvantages: It only compares two independent groups and does not work well for highly skewed data.
Wilcoxon Signed-Rank Test
The Wilcoxon Signed-Rank Test is used to compare two related samples or matched pairs. It is the non-parametric alternative to the paired t-test.
Example: A researcher is measuring the change in blood pressure before and after a treatment in a group of patients. Since blood pressure might not follow a normal distribution, the Wilcoxon Signed-Rank Test can be applied to compare the two sets of measurements.
- Advantages: It works well for small samples and non-normally distributed data.
- Disadvantages: It can only be applied to two related samples or matched pairs.

Kruskal-Wallis H Test
The Kruskal-Wallis H test is the non-parametric alternative to one-way ANOVA and is used when there are more than two independent groups. It assesses whether there are statistically significant differences between groups.
Example: A researcher wants to compare the levels of customer satisfaction across three different product categories: electronics, clothing, and furniture. The Kruskal-Wallis test can be used to determine if customer satisfaction differs significantly across these three groups.
- Advantages: It is suitable for comparing more than two independent groups with non-normally distributed data.
- Disadvantages: It does not indicate which groups differ, only if there is a significant difference.
Friedman Test
The Friedman test is a non-parametric alternative to repeated measures ANOVA. It is used when there are three or more related groups, and the data is ordinal.
Example: A researcher measures the effect of three different diets on weight loss over three months in the same group of people. Since the data is ordinal (e.g., low, medium, high weight loss), the Friedman test can be used to assess if there are significant differences between the diet groups.
- Advantages: It is suitable for repeated measures or matched groups.
- Disadvantages: It requires a minimum of three groups and may not handle data well if sample sizes are small.
Spearman’s Rank Correlation Coefficient
This test is used to measure the strength and direction of the association between two ordinal variables. It is similar to Pearson’s correlation but does not require the assumption of normality.
Example: A researcher may wish to assess the relationship between education level (ordinal) and income (ordinal) in a group of individuals. Spearman’s correlation can quantify the strength and direction of the association.
- Advantages: It works with ordinal data and does not require normal distribution.
- Disadvantages: It does not measure linear relationships as well as Pearson’s correlation.
Kolmogorov-Smirnov Test
The Kolmogorov-Smirnov test is used to compare a sample with a reference probability distribution, or to compare two samples. It is often used to assess if a dataset follows a specific distribution.
Example: A researcher may use the Kolmogorov-Smirnov test to determine if a sample of test scores follows a normal distribution.
- Advantages: It is useful for small sample sizes and is applicable in a wide variety of contexts.
- Disadvantages: It is sensitive to ties in the data.
Non-Parametric Tests in Research
In research, non-parametric tests are commonly used when the data does not meet the assumptions of parametric tests. For example, when sample sizes are small, when data is not normally distributed, or when data is ordinal or categorical, non-parametric tests offer a flexible and powerful alternative.
Importance of Non-Parametric Tests in Research
- Flexibility with Data Types: Non-parametric tests can handle a variety of data types, including ordinal, nominal, and non-normally distributed continuous data.
- Robust to Violations of Assumptions: Unlike parametric tests, which assume normality, non-parametric tests are distribution-free and can be applied regardless of the data distribution.
- Smaller Sample Sizes: Non-parametric tests do not require large sample sizes to be effective, making them ideal for studies with limited data.
- Interpretability: Many non-parametric tests focus on ranks and medians, which are more robust measures than means, especially in the presence of outliers or skewed data.
- Wide Application: Non-parametric methods are widely used in medical, social, and behavioral research, especially when dealing with non-quantitative or difficult-to-model data.
Advantages and Disadvantages of Non-Parametric Tests
Advantages:
- No Assumptions of Normality: Non-parametric tests do not require the data to follow a normal distribution, which makes them ideal for analyzing skewed or non-normal data.
- Applicability to Ordinal Data: These tests can handle ordinal and nominal data, unlike many parametric tests, which require interval or ratio scales.
- Robustness: Non-parametric tests are less sensitive to outliers or extreme values, which might distort the results of parametric tests.
Disadvantages:
- Lower Power: Non-parametric tests generally have lower statistical power compared to parametric tests when the assumptions of parametric tests are met.
- Limited Information: Non-parametric tests often do not provide as detailed information as parametric tests. For example, they may not give estimates of population parameters like means or variances.
- Less Precision: Non-parametric tests focus on ranks or medians, which may result in a less precise analysis compared to parametric tests that use actual data values.
Conclusion
Non-parametric tests are indispensable tools in the field of statistics, especially when dealing with data that cannot be appropriately modeled using parametric methods. They offer flexibility, robustness, and ease of use in a variety of research contexts. By understanding the different types of non-parametric tests and their applications, researchers can make informed decisions about which test to use based on the nature of their data and the research questions they aim to address.
Needs help with similar assignment?
We are available 24x7 to deliver the best services and assignment ready within 3-4 hours? Order a custom-written, plagiarism-free paper