Two Proportion Z-Tests: Definition, Conditions, and Examples|2025
/in General Articles /by BesttutorLearn about Two Proportion Z-Tests: definition, conditions, and examples. Understand when to use this statistical test and how it helps compare proportions in different sample groups.
Statistical hypothesis testing plays a crucial role in data analysis, helping researchers make informed decisions based on sample data. One commonly used statistical method for comparing two proportions is the Two Proportion Z-Test. This test evaluates whether there is a significant difference between the proportions of two independent groups, allowing researchers to draw conclusions about the population from which the samples were taken. In this paper, we will discuss the Two Proportion Z-Test in detail, including its definition, conditions, examples, and comparison with related tests like the Two Proportion T-Test and Chi-Square Test. Furthermore, we will explore how to perform a Two Proportion Z-Test using different tools such as calculators, Excel, and the Z-Test formula.
Two Proportion Z-Test: Definition
A Two Proportion Z-Test is a statistical method used to compare the proportions of two independent groups to determine whether there is a significant difference between them. In simple terms, it is used when you want to test if two population proportions are equal or different. The test compares two sample proportions to evaluate whether the observed difference is likely due to chance or represents a true difference in the populations being studied.
The null hypothesis (H₀) for the Two Proportion Z-Test generally states that the two proportions are equal. The alternative hypothesis (H₁) asserts that the proportions are different. This test assumes that the sample data are independent, random, and follow a normal distribution, as we will discuss in more detail below.
Conditions for Performing a Two Proportion Z-Test
For the Two Proportion Z-Test to be valid, certain conditions must be met:
- Independence of Samples: The samples must be independent of each other. This means that the outcome of one sample should not affect the outcome of the other. For example, if you are testing the proportion of people who prefer a particular brand in two different cities, the preferences of people in one city should not influence those in the other city.
- Random Sampling: The samples taken from each group must be randomly selected. This ensures that the data is representative of the population and that the results can be generalized.
- Sample Size: Both sample sizes must be sufficiently large to ensure that the sampling distribution of the proportion is approximately normal. Specifically, the following conditions must hold:
- n1p1≥10n_1p_1 \geq 10n1p1≥10 and n1(1−p1)≥10n_1(1 – p_1) \geq 10n1(1−p1)≥10 for the first group
- n2p2≥10n_2p_2 \geq 10n2p2≥10 and n2(1−p2)≥10n_2(1 – p_2) \geq 10n2(1−p2)≥10 for the second group Where:
- n1n_1n1 and n2n_2n2 are the sample sizes of the two groups,
- p1p_1p1 and p2p_2p2 are the sample proportions of the two groups.
- Normality of Sampling Distribution: The sample proportions must be normally distributed. This is generally achieved when the sample size is large enough, according to the Central Limit Theorem.
If these conditions are met, the Two Proportion Z-Test can be used to compare the two population proportions.
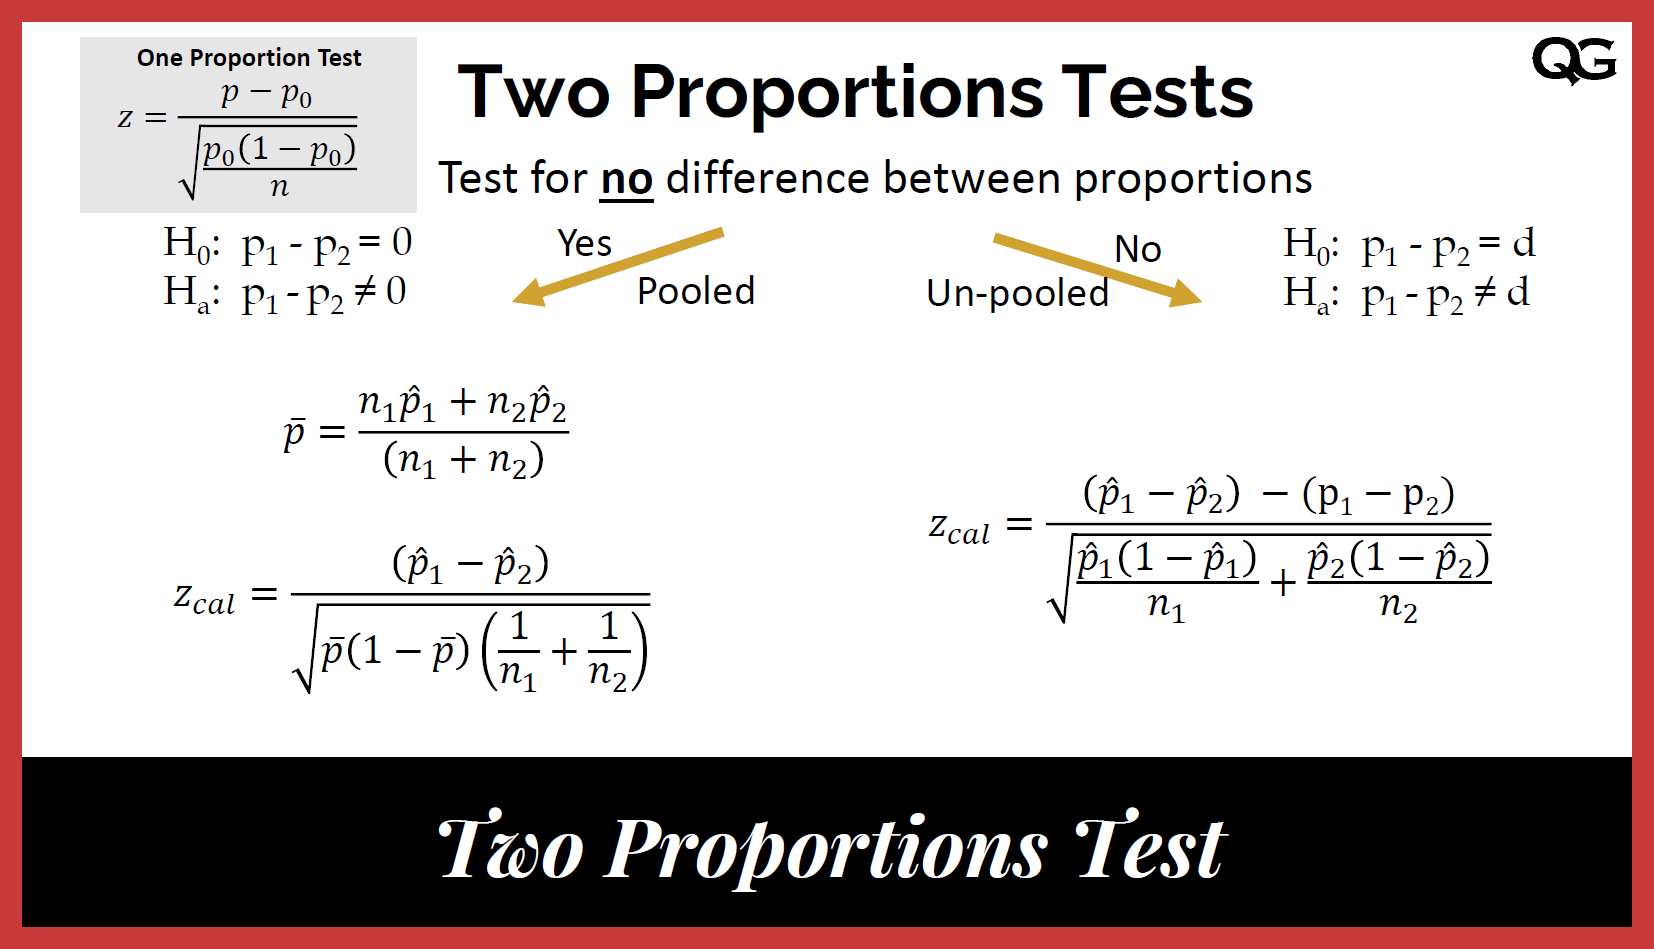
Formula for the Two Proportion Z-Test
The formula for the Two Proportion Z-Test is as follows:
Z=p1^−p2^p^(1−p^)(1n1+1n2)Z = \frac{ \hat{p_1} – \hat{p_2} }{ \sqrt{ \hat{p}(1 – \hat{p}) \left( \frac{1}{n_1} + \frac{1}{n_2} \right) } }Z=p^(1−p^)(n11+n21)p1^−p2^Where:
- p1^\hat{p_1}p1^ and p2^\hat{p_2}p2^ are the sample proportions from the two groups,
- n1n_1n1 and n2n_2n2 are the sample sizes of the two groups,
- p^\hat{p}p^ is the pooled proportion, calculated as:
p^=x1+x2n1+n2\hat{p} = \frac{x_1 + x_2}{n_1 + n_2}p^=n1+n2x1+x2Where x1x_1x1 and x2x_2x2 are the number of successes in each group, and n1n_1n1 and n2n_2n2 are the corresponding sample sizes.
The Z-value is then compared against a critical value from the standard normal distribution (Z-table) to determine the significance of the result. If the Z-value exceeds the critical value (e.g., 1.96 for a 95% confidence level), the null hypothesis is rejected, and it is concluded that there is a significant difference between the two proportions.

Example of a Two Proportion Z-Test
Let’s walk through an example to better understand how the Two Proportion Z-Test works.
Scenario: A researcher wants to compare the proportion of males and females who prefer a particular brand of soda. In a sample of 200 males, 120 prefer the brand. In a sample of 150 females, 90 prefer the brand. The researcher wants to test whether the proportions of males and females who prefer the soda are significantly different.
- Sample 1 (males):
- n1=200n_1 = 200n1=200
- x1=120x_1 = 120x1=120
- p1^=120200=0.60\hat{p_1} = \frac{120}{200} = 0.60p1^=200120=0.60
- Sample 2 (females):
- n2=150n_2 = 150n2=150
- x2=90x_2 = 90x2=90
- p2^=90150=0.60\hat{p_2} = \frac{90}{150} = 0.60p2^=15090=0.60
First, calculate the pooled proportion:
p^=120+90200+150=210350=0.60\hat{p} = \frac{120 + 90}{200 + 150} = \frac{210}{350} = 0.60p^=200+150120+90=350210=0.60Now, use the formula for the Z-score:
Z=0.60−0.600.60(1−0.60)(1200+1150)Z = \frac{0.60 – 0.60}{ \sqrt{0.60(1 – 0.60) \left( \frac{1}{200} + \frac{1}{150} \right)} }Z=0.60(1−0.60)(2001+1501)0.60−0.60Simplify the terms:
Z=00.60(0.40)(1200+1150)Z = \frac{0}{ \sqrt{0.60(0.40) \left( \frac{1}{200} + \frac{1}{150} \right)} }Z=0.60(0.40)(2001+1501)0 Z=00.24(1200+1150)Z = \frac{0}{ \sqrt{0.24 \left( \frac{1}{200} + \frac{1}{150} \right)} }Z=0.24(2001+1501)0 Z=00.24×(0.005+0.0067)Z = \frac{0}{ \sqrt{0.24 \times (0.005 + 0.0067)} }Z=0.24×(0.005+0.0067)0 Z=00.24×0.0117Z = \frac{0}{ \sqrt{0.24 \times 0.0117} }Z=0.24×0.01170 Z=00.0028Z = \frac{0}{ \sqrt{0.0028} }Z=0.00280 Z=0Z = 0Z=0Since the Z-value is 0, which is far less than the critical value of 1.96 (for a 95% confidence level), we fail to reject the null hypothesis. Therefore, there is no significant difference between the proportions of males and females who prefer the soda.
Performing a Two Proportion Z-Test in Excel
Excel offers an easy way to perform a Two Proportion Z-Test using built-in functions. Here’s how:
- Enter the data for both groups: the number of successes and sample sizes.
- Calculate the sample proportions p1^\hat{p_1}p1^ and p2^\hat{p_2}p2^.
- Compute the pooled proportion p^\hat{p}p^.
- Calculate the Z-score using the formula mentioned earlier.
- Compare the Z-score to the critical value from the Z-distribution (e.g., 1.96 for a 95% confidence level).
Alternatively, you can use Excel’s Data Analysis Toolpak to perform hypothesis tests, though it may not have a direct option for the two proportion Z-test. In such cases, you may need to manually calculate the Z-statistic or use other statistical software.
Two Proportion Z-Test vs. Two Proportion T-Test
The Two Proportion T-Test is another method for comparing proportions, but it is typically used when sample sizes are small, and the assumption of normality may not hold. In contrast, the Two Proportion Z-Test is more commonly used with larger sample sizes because of the Central Limit Theorem, which ensures the sampling distribution of proportions is approximately normal as the sample size increases.
Two Proportion Z-Test vs. Chi-Square Test
Both the Two Proportion Z-Test and Chi-Square Test can be used to compare proportions between two or more groups. However, they are used in slightly different contexts:
- The Two Proportion Z-Test is specifically designed to test the difference between the proportions of two independent groups.
- The Chi-Square Test for independence is used to examine the relationship between two categorical variables. While it can be used for comparing proportions, it is more general and does not focus solely on the difference between two groups.
Conclusion
The Two Proportion Z-Test is a powerful and widely-used statistical method for comparing the proportions of two independent groups. By evaluating the difference in proportions and considering sample sizes and conditions, the Z-Test allows researchers to test hypotheses about population proportions. While related methods such as the Two Proportion T-Test and Chi-Square Test are also useful, the Two Proportion Z-Test is particularly suited for large sample sizes and normal distributions. Tools like Excel and online Two Proportion Z-Test calculators make performing the test more accessible, allowing for efficient and accurate statistical analysis.
Needs help with similar assignment?
We are available 24x7 to deliver the best services and assignment ready within 3-4 hours? Order a custom-written, plagiarism-free paper