Which Software is Best for Statistical Analysis in a Dissertation?|2025
/in SPSS Articles /by BesttutorDiscover Which Software is Best for Statistical Analysis in a Dissertation? Compare top tools like SPSS, R, and SAS to find the best fit for your research needs.
Statistical analysis is an essential component of research across various disciplines, and the choice of software can significantly impact the efficiency, accuracy, and quality of data analysis, especially in the context of a dissertation. As a graduate student, selecting the best software for statistical analysis can be overwhelming due to the variety of options available. This paper will explore the best statistical analysis software for dissertation writing, examining both free and paid options, and addressing the specific needs of students and researchers working with quantitative and qualitative data.
Introduction to Statistical Analysis in a Dissertation
A dissertation is a comprehensive research project that requires a rigorous analysis of data. Whether the research is quantitative, qualitative, or mixed-method, statistical analysis is an essential tool in making sense of the collected data, drawing conclusions, and supporting arguments with empirical evidence. Choosing the right software for statistical analysis can streamline this process and help students manage large datasets, perform sophisticated analyses, and create clear visualizations.
There is a wide range of statistical analysis software available, each designed with different features and functionalities. Some are better suited for basic statistical analysis, while others are equipped for advanced modeling, machine learning, or data visualization. This paper will explore several software tools, addressing their strengths and weaknesses in the context of dissertation research.
Statistical Analysis Software for Quantitative Research
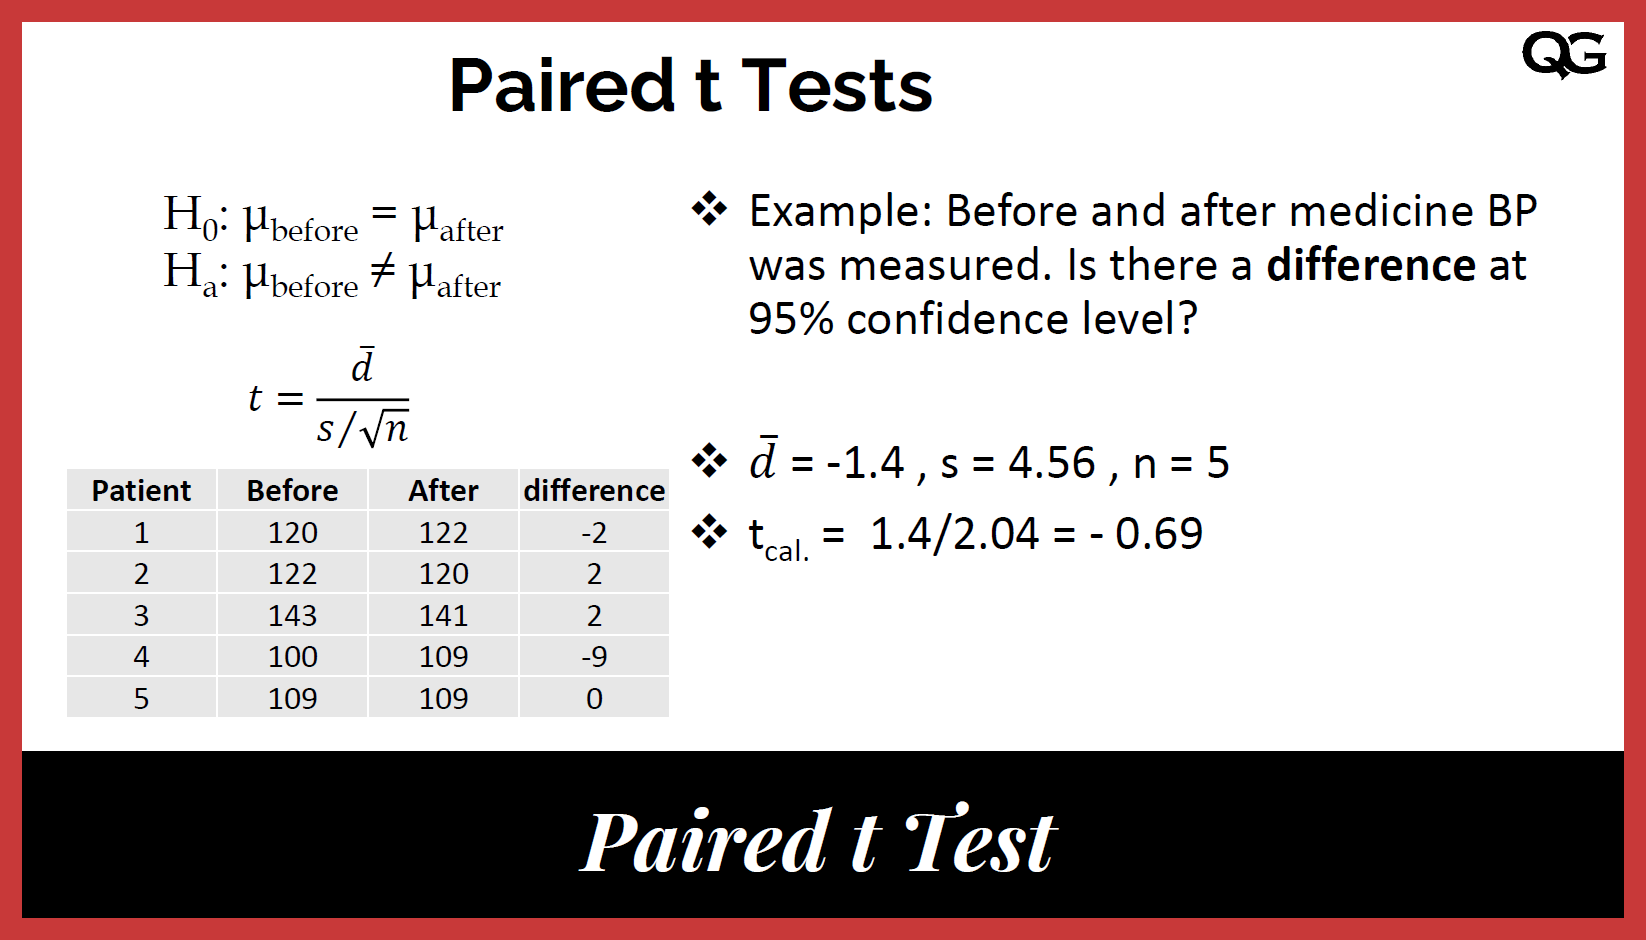
Quantitative research involves numerical data, and statistical analysis software for quantitative research must handle a variety of statistical tests, such as t-tests, regression analysis, and analysis of variance (ANOVA). These tools should also offer the ability to visualize data through charts, histograms, and scatter plots. Some of the most popular statistical analysis software for quantitative research include:
SPSS (Statistical Package for the Social Sciences)
SPSS is one of the most widely used statistical analysis software, especially in the social sciences, psychology, and education. It is designed to handle a broad spectrum of statistical analysis tasks, including descriptive statistics, inferential statistics, regression analysis, and multivariate analysis.
Key Features:
- User-friendly interface with drag-and-drop functionality.
- Comprehensive data management features.
- Strong support for a wide range of statistical tests.
- Integration with other tools such as Microsoft Excel.
Best for:
- Students who require an intuitive, easy-to-use interface for statistical analysis.
- Researchers working with large datasets and complex multivariate analyses.
While SPSS is widely used, it can be expensive for students. However, many universities provide access to SPSS licenses, either through their institutions or discounted student versions.
R
R is a free, open-source software environment for statistical computing and graphics. It is widely used by statisticians, data scientists, and researchers due to its flexibility and powerful capabilities. R is particularly strong in advanced statistical techniques, including machine learning, time-series analysis, and spatial statistics.
Key Features:
- Extensive library of packages for specialized statistical analysis.
- Strong data visualization capabilities through libraries like ggplot2.
- Highly customizable and flexible for complex analyses.
- Free and open-source.
Best for:
- Students with a strong programming background who need advanced statistical methods.
- Researchers working with complex datasets that require custom statistical models.
R’s learning curve is steeper compared to software like SPSS, but its ability to perform high-level analyses makes it an attractive option for experienced users.
Stata
Stata is another powerful statistical software package that is commonly used in academic research. It provides a comprehensive suite of statistical tools, including regression analysis, time-series analysis, and panel data analysis. Stata is well-known for its ease of use and ability to handle large datasets.
Key Features:
- User-friendly interface with both command-line and point-and-click options.
- Strong data management features and capabilities for handling complex datasets.
- Advanced statistical modeling, including multivariate and longitudinal data analysis.
- Good support for panel data, econometrics, and survival analysis.
Best for:
- Researchers working with large datasets and complex econometric models.
- Students who need a balance between user-friendliness and statistical depth.
Stata is a paid software, but it offers student discounts and access through university licenses.
SAS (Statistical Analysis System)
SAS is one of the most powerful and robust statistical software tools available. It is widely used in industries such as healthcare, finance, and marketing. SAS offers a broad range of statistical techniques, including multivariate analysis, survival analysis, and data mining.
Key Features:
- Extremely powerful and scalable for large datasets.
- Extensive support for advanced statistical methods and machine learning techniques.
- Strong data manipulation and reporting features.
- Comprehensive documentation and support resources.
Best for:
- Professional researchers and students working with large and complex datasets.
- Researchers in industries such as healthcare and finance, where advanced analytics are required.
SAS is typically expensive, but student versions are available at a lower cost, and some institutions provide access.

Free Statistical Analysis Software for Students
For students on a budget, free statistical analysis software can be an attractive alternative to expensive tools like SPSS and SAS. Some of the most popular free options include:
Jamovi
Jamovi is a free and open-source statistical software that provides a user-friendly interface similar to SPSS. It is designed to make statistical analysis accessible for everyone, including those with little to no programming experience. Jamovi is built on the R statistical language, but it offers a more intuitive graphical interface.
Key Features:
- Simple and easy-to-use interface.
- Basic statistical analysis capabilities, including t-tests, ANOVA, and regression.
- Built-in support for R, allowing for more advanced analyses.
Best for:
- Students who want a free, user-friendly alternative to SPSS for basic statistical analysis.
PSPP
PSPP is a free, open-source alternative to SPSS. It supports a wide range of statistical tests, including descriptive statistics, t-tests, chi-square tests, and regression analysis. While it is not as feature-rich as SPSS, it is a solid option for students working with smaller datasets.
Key Features:
- Free and open-source.
- User interface is similar to SPSS, making it easy for SPSS users to transition.
- Basic statistical analysis features.
- Handles large datasets efficiently.
Best for:
- Students who need a free software option that closely resembles SPSS.
Excel with Analysis ToolPak
Microsoft Excel is often underestimated as a statistical tool, but with the Analysis ToolPak add-in, it can be a powerful tool for conducting basic statistical analysis. It supports tests such as t-tests, ANOVA, correlation, regression analysis, and more.
Key Features:
- Accessible and widely used in academia and business.
- Analysis ToolPak add-in enables a variety of statistical tests.
- Good for simple data analysis and visualization.
Best for:
- Students who need a basic statistical analysis tool and already have access to Excel.

Data Analysis Software for Qualitative Research
While quantitative data analysis software is essential for statistical analysis, qualitative research requires different tools that help researchers analyze text, interviews, surveys, and other non-numerical data. Some popular qualitative data analysis software includes:
NVivo
NVivo is one of the most widely used software programs for qualitative data analysis. It helps researchers analyze, organize, and visualize data from interviews, surveys, focus groups, and other qualitative sources.
Key Features:
- Comprehensive tools for coding and categorizing qualitative data.
- Built-in features for visualizing themes, relationships, and patterns.
- Support for multimedia analysis (audio, video, images).
Best for:
- Students and researchers working with qualitative data such as interviews and case studies.
Atlas.ti
Atlas.ti is another robust software solution for qualitative research. It is designed to handle large datasets and supports a range of features for coding, analysis, and visualization of qualitative data.
Key Features:
- Powerful coding and network analysis tools.
- Support for multiple data types, including text, audio, and video.
- Strong collaboration features for team-based research projects.
Best for:
- Researchers working with complex qualitative data and those requiring advanced analysis features.
MAXQDA
MAXQDA is a user-friendly qualitative data analysis software that supports a wide variety of data formats. It offers features for coding, analyzing, and visualizing data in an intuitive interface.
Key Features:
- Easy-to-use coding system for qualitative data.
- Features for mixed-methods research, allowing both qualitative and quantitative data to be analyzed together.
- Visualizations for data relationships and patterns.
Best for:
- Students and researchers working on mixed-methods or qualitative research projects.

Conclusion
The choice of statistical analysis software for a dissertation depends on several factors, including the type of research (quantitative or qualitative), the complexity of the analysis, and the student’s budget. For quantitative research, software like SPSS, R, Stata, and SAS offers powerful tools for statistical analysis, with R and SPSS being the most popular among students. For qualitative research, NVivo, Atlas.ti, and MAXQDA provide robust solutions for coding and analyzing non-numerical data.
For students on a budget, free software like Jamovi, PSPP, and Excel can provide the necessary tools for basic statistical analysis. Ultimately, the best software for statistical analysis in a dissertation is one that meets the specific needs of the research while fitting within the student’s technical skills and budget constraints.
Needs help with similar assignment?
We are available 24x7 to deliver the best services and assignment ready within 3-4 hours? Order a custom-written, plagiarism-free paper


.png)