Which Software is Best for Statistical Analysis in a Dissertation?|2025

Discover Which Software is Best for Statistical Analysis in a Dissertation? Compare top tools like SPSS, R, and SAS to find the best fit for your research needs.

Statistical analysis is an essential component of research across various disciplines, and the choice of software can significantly impact the efficiency, accuracy, and quality of data analysis, especially in the context of a dissertation. As a graduate student, selecting the best software for statistical analysis can be overwhelming due to the variety of options available. This paper will explore the best statistical analysis software for dissertation writing, examining both free and paid options, and addressing the specific needs of students and researchers working with quantitative and qualitative data.

Which Software is Best for Statistical Analysis in a Dissertation?

Introduction to Statistical Analysis in a Dissertation

A dissertation is a comprehensive research project that requires a rigorous analysis of data. Whether the research is quantitative, qualitative, or mixed-method, statistical analysis is an essential tool in making sense of the collected data, drawing conclusions, and supporting arguments with empirical evidence. Choosing the right software for statistical analysis can streamline this process and help students manage large datasets, perform sophisticated analyses, and create clear visualizations.

There is a wide range of statistical analysis software available, each designed with different features and functionalities. Some are better suited for basic statistical analysis, while others are equipped for advanced modeling, machine learning, or data visualization. This paper will explore several software tools, addressing their strengths and weaknesses in the context of dissertation research.

Statistical Analysis Software for Quantitative Research

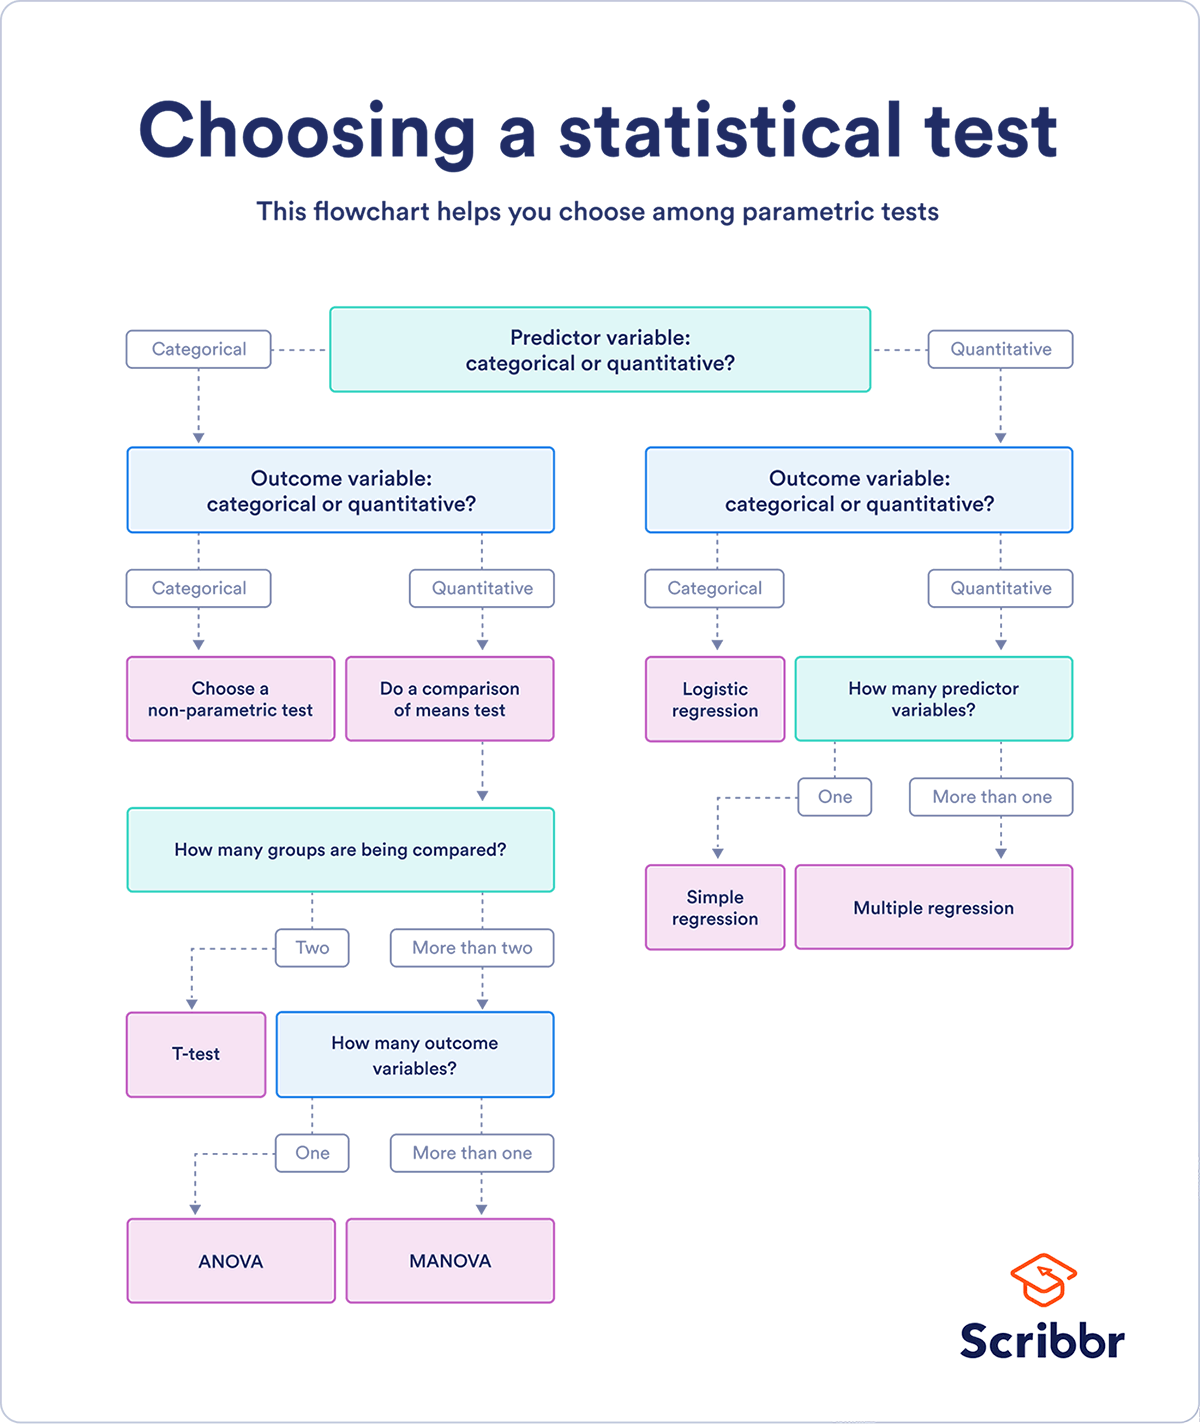
Quantitative research involves numerical data, and statistical analysis software for quantitative research must handle a variety of statistical tests, such as t-tests, regression analysis, and analysis of variance (ANOVA). These tools should also offer the ability to visualize data through charts, histograms, and scatter plots. Some of the most popular statistical analysis software for quantitative research include:

SPSS (Statistical Package for the Social Sciences)

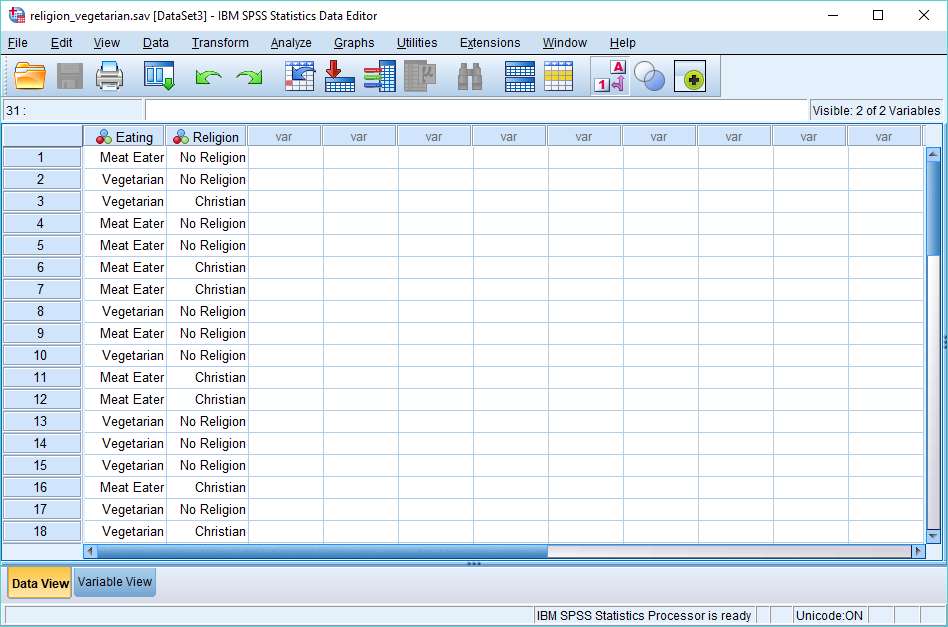
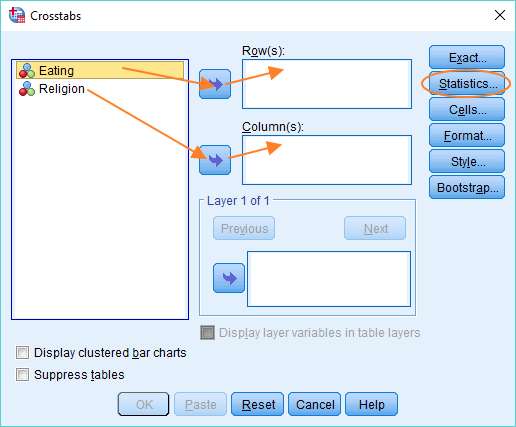
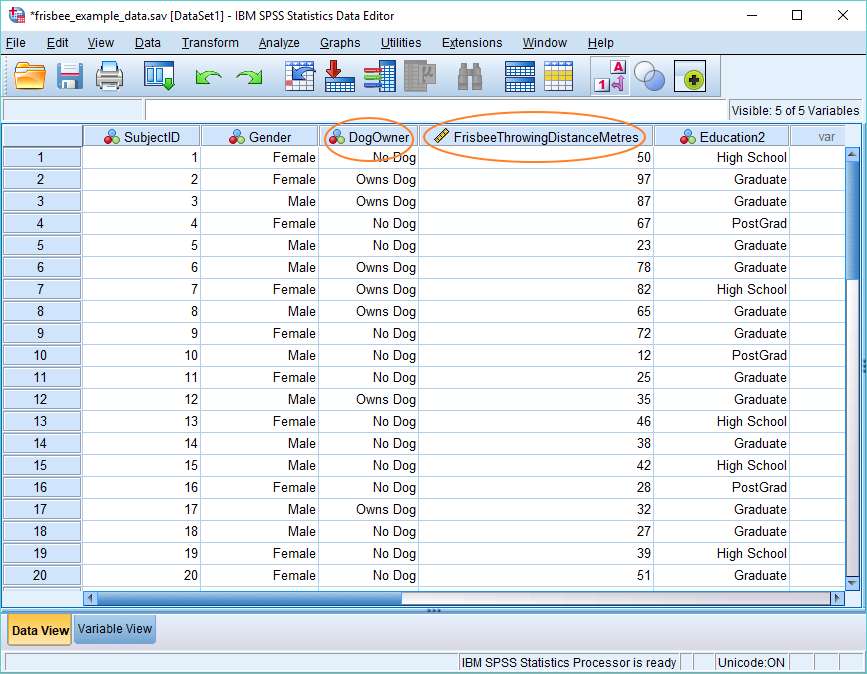
SPSS is one of the most widely used statistical analysis software, especially in the social sciences, psychology, and education. It is designed to handle a broad spectrum of statistical analysis tasks, including descriptive statistics, inferential statistics, regression analysis, and multivariate analysis.

Key Features:

  • User-friendly interface with drag-and-drop functionality.
  • Comprehensive data management features.
  • Strong support for a wide range of statistical tests.
  • Integration with other tools such as Microsoft Excel.

Best for:

  • Students who require an intuitive, easy-to-use interface for statistical analysis.
  • Researchers working with large datasets and complex multivariate analyses.

While SPSS is widely used, it can be expensive for students. However, many universities provide access to SPSS licenses, either through their institutions or discounted student versions.

R

R is a free, open-source software environment for statistical computing and graphics. It is widely used by statisticians, data scientists, and researchers due to its flexibility and powerful capabilities. R is particularly strong in advanced statistical techniques, including machine learning, time-series analysis, and spatial statistics.

Key Features:

  • Extensive library of packages for specialized statistical analysis.
  • Strong data visualization capabilities through libraries like ggplot2.
  • Highly customizable and flexible for complex analyses.
  • Free and open-source.

Best for:

  • Students with a strong programming background who need advanced statistical methods.
  • Researchers working with complex datasets that require custom statistical models.

R’s learning curve is steeper compared to software like SPSS, but its ability to perform high-level analyses makes it an attractive option for experienced users.

Stata

Stata is another powerful statistical software package that is commonly used in academic research. It provides a comprehensive suite of statistical tools, including regression analysis, time-series analysis, and panel data analysis. Stata is well-known for its ease of use and ability to handle large datasets.

Key Features:

  • User-friendly interface with both command-line and point-and-click options.
  • Strong data management features and capabilities for handling complex datasets.
  • Advanced statistical modeling, including multivariate and longitudinal data analysis.
  • Good support for panel data, econometrics, and survival analysis.

Best for:

  • Researchers working with large datasets and complex econometric models.
  • Students who need a balance between user-friendliness and statistical depth.

Stata is a paid software, but it offers student discounts and access through university licenses.

SAS (Statistical Analysis System)

SAS is one of the most powerful and robust statistical software tools available. It is widely used in industries such as healthcare, finance, and marketing. SAS offers a broad range of statistical techniques, including multivariate analysis, survival analysis, and data mining.

Key Features:

  • Extremely powerful and scalable for large datasets.
  • Extensive support for advanced statistical methods and machine learning techniques.
  • Strong data manipulation and reporting features.
  • Comprehensive documentation and support resources.

Best for:

  • Professional researchers and students working with large and complex datasets.
  • Researchers in industries such as healthcare and finance, where advanced analytics are required.

SAS is typically expensive, but student versions are available at a lower cost, and some institutions provide access.

Which Software is Best for Statistical Analysis in a Dissertation?

Free Statistical Analysis Software for Students

For students on a budget, free statistical analysis software can be an attractive alternative to expensive tools like SPSS and SAS. Some of the most popular free options include:

Jamovi

Jamovi is a free and open-source statistical software that provides a user-friendly interface similar to SPSS. It is designed to make statistical analysis accessible for everyone, including those with little to no programming experience. Jamovi is built on the R statistical language, but it offers a more intuitive graphical interface.

Key Features:

  • Simple and easy-to-use interface.
  • Basic statistical analysis capabilities, including t-tests, ANOVA, and regression.
  • Built-in support for R, allowing for more advanced analyses.

Best for:

  • Students who want a free, user-friendly alternative to SPSS for basic statistical analysis.

PSPP

PSPP is a free, open-source alternative to SPSS. It supports a wide range of statistical tests, including descriptive statistics, t-tests, chi-square tests, and regression analysis. While it is not as feature-rich as SPSS, it is a solid option for students working with smaller datasets.

Key Features:

  • Free and open-source.
  • User interface is similar to SPSS, making it easy for SPSS users to transition.
  • Basic statistical analysis features.
  • Handles large datasets efficiently.

Best for:

  • Students who need a free software option that closely resembles SPSS.

Excel with Analysis ToolPak

Microsoft Excel is often underestimated as a statistical tool, but with the Analysis ToolPak add-in, it can be a powerful tool for conducting basic statistical analysis. It supports tests such as t-tests, ANOVA, correlation, regression analysis, and more.

Key Features:

  • Accessible and widely used in academia and business.
  • Analysis ToolPak add-in enables a variety of statistical tests.
  • Good for simple data analysis and visualization.

Best for:

  • Students who need a basic statistical analysis tool and already have access to Excel.

Which Software is Best for Statistical Analysis in a Dissertation?

Data Analysis Software for Qualitative Research

While quantitative data analysis software is essential for statistical analysis, qualitative research requires different tools that help researchers analyze text, interviews, surveys, and other non-numerical data. Some popular qualitative data analysis software includes:

NVivo

NVivo is one of the most widely used software programs for qualitative data analysis. It helps researchers analyze, organize, and visualize data from interviews, surveys, focus groups, and other qualitative sources.

Key Features:

  • Comprehensive tools for coding and categorizing qualitative data.
  • Built-in features for visualizing themes, relationships, and patterns.
  • Support for multimedia analysis (audio, video, images).

Best for:

  • Students and researchers working with qualitative data such as interviews and case studies.

Atlas.ti

Atlas.ti is another robust software solution for qualitative research. It is designed to handle large datasets and supports a range of features for coding, analysis, and visualization of qualitative data.

Key Features:

  • Powerful coding and network analysis tools.
  • Support for multiple data types, including text, audio, and video.
  • Strong collaboration features for team-based research projects.

Best for:

  • Researchers working with complex qualitative data and those requiring advanced analysis features.

MAXQDA

MAXQDA is a user-friendly qualitative data analysis software that supports a wide variety of data formats. It offers features for coding, analyzing, and visualizing data in an intuitive interface.

Key Features:

  • Easy-to-use coding system for qualitative data.
  • Features for mixed-methods research, allowing both qualitative and quantitative data to be analyzed together.
  • Visualizations for data relationships and patterns.

Best for:

  • Students and researchers working on mixed-methods or qualitative research projects.

Which Software is Best for Statistical Analysis in a Dissertation?

Conclusion

The choice of statistical analysis software for a dissertation depends on several factors, including the type of research (quantitative or qualitative), the complexity of the analysis, and the student’s budget. For quantitative research, software like SPSS, R, Stata, and SAS offers powerful tools for statistical analysis, with R and SPSS being the most popular among students. For qualitative research, NVivo, Atlas.ti, and MAXQDA provide robust solutions for coding and analyzing non-numerical data.

For students on a budget, free software like Jamovi, PSPP, and Excel can provide the necessary tools for basic statistical analysis. Ultimately, the best software for statistical analysis in a dissertation is one that meets the specific needs of the research while fitting within the student’s technical skills and budget constraints.

Needs help with similar assignment?

We are available 24x7 to deliver the best services and assignment ready within 3-4 hours? Order a custom-written, plagiarism-free paper

Get Answer Over WhatsApp Order Paper Now

How to Run a Survival Analysis Test in SPSS: A Comprehensive Guide|2025

Learn How to Run a Survival Analysis Test in SPSS with step-by-step instructions. Understand the process, analyze time-to-event data, and interpret results effectively.

Survival analysis is a statistical method used to analyze the time it takes for an event of interest to occur. It is commonly used in various fields such as medicine, engineering, and social sciences to study the duration until an event like death, failure, or a particular condition occurs. SPSS (Statistical Package for the Social Sciences) is one of the most widely used statistical software packages for performing survival analysis. In this paper, we will explore how to run a survival analysis test in SPSS, including detailed steps, key terms, and concepts like Kaplan-Meier estimation and Cox regression. Additionally, we will examine how to calculate survival rates and interpret the results.

How to Run a Survival Analysis Test in SPSS

Understanding Survival Analysis

Survival analysis focuses on analyzing the time-to-event data. The event could be death, disease occurrence, product failure, or any other significant event. In survival analysis, the duration or “survival time” is the key variable. The goal is to estimate the survival function, which provides the probability that an individual or item survives beyond a certain time.

Key concepts in survival analysis include:

  • Censoring: In survival data, some subjects may not experience the event during the study period. This is known as censoring, and it can occur due to loss to follow-up or the event not occurring by the study’s end.
  • Survival Function: The survival function represents the probability that the event of interest has not occurred by a certain time.
  • Hazard Function: The hazard function is the rate at which the event of interest occurs at a specific time point.

How to Run Survival Analysis in SPSS

Running survival analysis in SPSS involves several steps, including preparing the data, selecting the correct test, and interpreting the results. Below are the steps you need to follow to run a survival analysis test in SPSS:

Step 1: Preparing the Data

Before running survival analysis in SPSS, it is essential to prepare your data correctly. The data should consist of at least two variables:

  • Time-to-event variable: This represents the duration of time from the beginning of the study until the event occurs (or the subject is censored).
  • Event indicator: This is a binary variable (1 for the event occurring, 0 for censoring).

In addition to these, you might include other covariates (e.g., age, gender, treatment type) that you want to control for in your analysis.

Step 2: Opening the Data in SPSS

  1. Launch SPSS and open your dataset by navigating to File > Open > Data.
  2. Ensure your data is properly formatted, with the time-to-event variable and event indicator in columns.

Step 3: Running Kaplan-Meier Survival Analysis

The Kaplan-Meier estimator is a non-parametric statistic used to estimate the survival function from lifetime data. It provides an estimate of the probability of surviving at each time point.

  1. In SPSS, go to Analyze > Survival > Kaplan-Meier.
  2. In the dialog box, move your time-to-event variable into the Time box and the event indicator variable into the Status box.
  3. You can also define groups (e.g., treatment groups or gender) by moving a grouping variable into the Factor box.
  4. Click OK to run the analysis.

SPSS will generate the Kaplan-Meier survival curve, which shows the probability of survival over time. The output will also include statistical tests like the Log Rank Test to compare survival curves across groups.

Step 4: Running Cox Proportional Hazards Regression

Cox regression is a popular method used to examine the effect of several variables on survival time. It assumes that the hazard ratios between groups are proportional over time.

  1. To run Cox regression in SPSS, go to Analyze > Survival > Cox Regression.
  2. In the dialog box, place your time-to-event variable in the Time box and the event indicator in the Status box.
  3. Add the independent variables (e.g., age, treatment, gender) into the Covariates box.
  4. Click OK to run the analysis.

The output will display hazard ratios (HR) for each covariate. A hazard ratio greater than 1 indicates that the variable increases the risk of the event occurring, while a hazard ratio less than 1 suggests a protective effect.

How to Calculate the 5-Year Survival Rate in SPSS

To calculate the 5-year survival rate in SPSS, you will first need to run a Kaplan-Meier analysis and then extract the survival probability at the 5-year mark. Here’s how to do it:

  1. Run the Kaplan-Meier Analysis as explained in Step 3.
  2. Look at the Survival Curve: SPSS will generate a Kaplan-Meier curve, where you can estimate the survival probability at any given time.
  3. Locate the 5-Year Mark: Identify the 5-year point on the x-axis of the Kaplan-Meier survival curve.
  4. Extract the Survival Probability: The survival probability at the 5-year mark is the value of the curve at that point. You can also use the SPSS output to directly obtain this probability.

Alternatively, SPSS provides summary statistics for survival analysis, including median survival times and the percentage surviving at certain time points. You can extract these figures from the output for the 5-year survival rate.

Interpreting Kaplan-Meier Survival Analysis Results

The Kaplan-Meier output includes a survival table and a plot of the survival curve. Here’s how to interpret it:

  • Survival Table: This table shows the number of individuals at risk at each time point, the number of events, the survival probability, and the cumulative survival probability. The cumulative survival probability at any given time is the probability that an individual will survive up to that point.
  • Survival Curve: The survival curve shows the proportion of subjects surviving over time. The curve typically starts at 1 (100% survival) and decreases as events occur. If the curve levels off, it indicates that no further events have occurred.

The Log Rank Test is used to compare survival curves between groups. A significant p-value (typically less than 0.05) indicates that there is a significant difference in survival between the groups.

How to Run a Survival Analysis Test in SPSS

Cox Regression in SPSS

Cox regression is a widely used method for analyzing the effect of several covariates on survival time. The Cox Proportional Hazards model is particularly useful when you want to assess the effect of multiple variables on survival, while adjusting for potential confounders.

Step 1: Run Cox Regression

  1. Go to Analyze > Survival > Cox Regression in SPSS.
  2. Define your time variable in the Time box and your event status variable in the Status box.
  3. Add the independent variables (e.g., age, gender, treatment) into the Covariates box.
  4. Click OK to run the analysis.

Step 2: Interpret the Results

  • Hazard Ratio (HR): The hazard ratio represents the risk of the event occurring in one group compared to another. For instance, if the hazard ratio for age is 1.5, this means that with each unit increase in age, the hazard of the event increases by 50%.
  • Confidence Interval (CI): The 95% confidence interval for the hazard ratio provides an estimate of the uncertainty of the HR. If the CI does not include 1, the effect is statistically significant.
  • p-value: A p-value less than 0.05 indicates that the variable significantly affects survival.

How to Run a Survival Analysis Test in SPSS

Conclusion

Survival analysis in SPSS is a powerful tool for analyzing time-to-event data. By understanding the basic methods of Kaplan-Meier estimation and Cox regression, researchers and analysts can draw valuable insights about survival rates and the impact of various factors on survival time. SPSS makes it easy to conduct these analyses, offering intuitive menus and detailed outputs. Whether you are calculating the 5-year survival rate or examining the effects of multiple covariates on survival, survival analysis in SPSS provides the necessary tools to analyze your data effectively.

This guide outlines the basics of how to run survival analysis tests in SPSS, including key techniques like Kaplan-Meier estimation, Cox regression, and interpreting results. By following these steps, you will be well-equipped to perform survival analysis and make informed decisions based on your findings.

Needs help with similar assignment?

We are available 24x7 to deliver the best services and assignment ready within 3-4 hours? Order a custom-written, plagiarism-free paper

Get Answer Over WhatsApp Order Paper Now

Reporting One Way MANOVA Test in SPSS|2025

Learn on Reporting One Way MANOVA Test in SPSS with step-by-step guidance, including interpreting results and presenting findings for multivariate analysis.

The Multivariate Analysis of Variance (MANOVA) is an extension of the Analysis of Variance (ANOVA) used to analyze the effect of one or more independent variables on multiple dependent variables simultaneously. In SPSS, performing and reporting the results of a One-Way MANOVA involves several steps, from conducting the test itself to interpreting and presenting the output in accordance with APA guidelines. This paper will provide an in-depth exploration of conducting a One-Way MANOVA in SPSS, interpreting the results, and reporting the findings effectively using various keywords such as “Reporting One-Way MANOVA Test in SPSS PDF,” “MANOVA SPSS Output Interpretation PDF,” and more.

Introduction to MANOVA

MANOVA is useful in examining whether changes in the independent variable(s) can account for variance in multiple dependent variables simultaneously. Unlike ANOVA, which only deals with one dependent variable, MANOVA evaluates the joint distribution of dependent variables and assesses the effects of independent variables on them. A One-Way MANOVA is used when there is one categorical independent variable (with more than two levels) and multiple dependent variables.

Assumptions of One-Way MANOVA

Before running a One-Way MANOVA test in SPSS, certain assumptions must be checked. These assumptions are critical to ensuring the validity of the test results. The assumptions are as follows:

  • Multivariate normality: Each group for the independent variable should have a normal distribution for the dependent variables.
  • Homogeneity of variance-covariance matrices: The variance within each group should be roughly equal across groups, tested by Box’s M test.
  • Independence: Observations should be independent of one another.
  • Linearity: There should be linear relationships among the dependent variables.

Conducting One-Way MANOVA in SPSS

Data Entry

To perform a One-Way MANOVA in SPSS, the data should be arranged in a specific format. Each row should represent a unique observation, with columns for the dependent variables and the independent variable. For example, if the study aims to examine the effect of a treatment (three treatment groups: Control, Treatment 1, and Treatment 2) on three dependent variables (e.g., anxiety, depression, and stress), the data might look like this:

Participant ID Treatment Group Anxiety Depression Stress
1 Control 4.2 5.1 3.8
2 Treatment 1 3.1 4.3 4.5
3 Treatment 2 2.8 3.9 4.0

Running the One-Way MANOVA Test

To perform the One-Way MANOVA in SPSS:

  1. Open the data file in SPSS.
  2. Click on Analyze > General Linear Model > Multivariate.
  3. Move the dependent variables (e.g., Anxiety, Depression, Stress) into the “Dependent Variables” box.
  4. Move the independent variable (e.g., Treatment Group) into the “Fixed Factor” box.
  5. Click on the Options button to select additional statistics like descriptive statistics, effect size, and post hoc tests if necessary.
  6. Click OK to run the analysis.

SPSS will generate an output window containing several tables, including tests for multivariate effects and post hoc comparisons.

Reporting One Way MANOVA Test in SPSS

Interpreting One-Way MANOVA Output in SPSS

The MANOVA output in SPSS is comprehensive and includes several key components. Understanding these components is critical for interpreting the results.

Multivariate Tests

This section includes results from different multivariate tests of significance, such as Wilks’ Lambda, Pillai’s Trace, Hotelling’s Trace, and Roy’s Largest Root. Each of these tests evaluates the null hypothesis that the independent variable has no effect on the set of dependent variables.

  • Wilks’ Lambda: The most commonly used statistic. A significant result (p-value < 0.05) indicates that the independent variable significantly affects the dependent variables.
  • Pillai’s Trace: Less sensitive to violations of assumptions and often used as a more robust test.
  • Hotelling’s Trace and Roy’s Largest Root: These tests are more sensitive to multivariate assumptions but are also less commonly reported in practice.

Tests of Between-Subjects Effects

This section shows univariate ANOVA tests for each of the dependent variables. It reveals whether the independent variable significantly affects each dependent variable individually. If any of the dependent variables show significant results (p-value < 0.05), post hoc tests can be conducted to further examine the specific group differences.

Post Hoc Tests (if applicable)

When significant effects are found, post hoc comparisons can be performed to determine which specific groups differ from one another. This is useful if the independent variable has more than two levels, and you need to explore pairwise differences between the groups.

Effect Size

The effect size (e.g., partial eta squared) is also reported in the output. It indicates the magnitude of the effect of the independent variable on the dependent variables. Values closer to 1 indicate a larger effect size.

Reporting One-Way MANOVA in APA Format

After conducting the analysis and interpreting the results, you need to report your findings following the American Psychological Association (APA) style. Below is an example of how to report the results of a One-Way MANOVA:

Reporting the Multivariate Tests

For example, if Wilks’ Lambda was significant, the result should be reported as follows:

  • A One-Way MANOVA was conducted to examine the effect of treatment group on anxiety, depression, and stress. The multivariate test revealed a significant effect of treatment group on the combined dependent variables, Wilks’ Lambda = 0.81, F(6, 106) = 3.56, p = 0.002, η² = 0.17.

Reporting the Univariate Results

Next, the results of the univariate tests for each dependent variable should be reported:

  • For anxiety, a significant difference was found between treatment groups, F(2, 53) = 4.35, p = 0.02, η² = 0.14.
  • For depression, no significant effect was found, F(2, 53) = 1.22, p = 0.31, η² = 0.05.
  • For stress, a significant difference was found between treatment groups, F(2, 53) = 5.12, p = 0.009, η² = 0.16.

Post Hoc Tests

If post hoc tests were performed, the results should also be reported:

  • Post hoc tests revealed that the treatment 1 group had significantly lower anxiety scores than the control group (p = 0.04), while the treatment 2 group did not differ significantly from the control group (p = 0.08).

Reporting One Way MANOVA Test in SPSS

Reporting Two-Way MANOVA in SPSS

A Two-Way MANOVA tests the effects of two independent variables on multiple dependent variables. This process follows a similar procedure to the One-Way MANOVA, but two independent variables are included in the analysis. The interpretation of the output in a Two-Way MANOVA includes tests for the main effects of each independent variable as well as the interaction effect between them.

For example, if you were studying the effect of treatment type (Control, Treatment 1, Treatment 2) and time (Pre, Post) on anxiety, depression, and stress, the output would include tests for the main effects of treatment and time as well as the interaction between treatment and time.

Conclusion

The One-Way MANOVA test in SPSS is a powerful tool for analyzing the effects of categorical independent variables on multiple dependent variables simultaneously. Interpreting the output involves examining multivariate tests, univariate tests, and effect sizes. When reporting the results in APA format, clear and concise reporting of statistical tests is essential for the understanding of the findings. This paper has provided a detailed overview of performing, interpreting, and reporting a One-Way MANOVA in SPSS, including guidance on reporting results in APA style.

For more detailed examples and guidance on specific aspects of the analysis, it may be beneficial to refer to resources like “Reporting One-Way MANOVA Test in SPSS PDF,” “MANOVA SPSS Output Interpretation PDF,” or practical guides for “MANOVA in SPSS Interpretation” for further assistance.

Needs help with similar assignment?

We are available 24x7 to deliver the best services and assignment ready within 3-4 hours? Order a custom-written, plagiarism-free paper

Get Answer Over WhatsApp Order Paper Now

How to Run Wilcoxon Signed Rank Test in SPSS|2025

Discover How to Run Wilcoxon Signed Rank Test in SPSS with this easy-to-follow guide, covering data setup, test execution, and result interpretation for non-parametric analysis.

The Wilcoxon Signed Rank Test is a non-parametric statistical test that is used to determine whether there is a statistically significant difference between two related variables. This test is often employed when the data do not meet the assumptions of a parametric test, such as the paired t-test, which requires normally distributed differences. The Wilcoxon Signed Rank Test compares the ranks of the differences between paired observations. It is particularly useful for data that are ordinal or when assumptions of normality are violated.

In this paper, we will explore how to run the Wilcoxon Signed Rank Test in SPSS, interpret the results, and report them according to APA standards. We will also address important considerations such as whether to use a one-tailed or two-tailed test and how to interpret the Z value.

Step-by-Step Guide to Running the Wilcoxon Signed Rank Test in SPSS

Preparing Your Data

Before running the Wilcoxon Signed Rank Test in SPSS, ensure that your data is organized in a way that is compatible with the test. The data should consist of two related groups or paired samples. For example, you may have measurements taken before and after an intervention, or data from two related conditions.

The data should be entered into two columns in SPSS, one for each of the paired groups. Ensure that each row corresponds to a single participant or observation. For example, if you are testing whether a treatment has an effect on a group of participants, one column might represent pre-treatment scores, and the other column might represent post-treatment scores.

Running the Wilcoxon Signed Rank Test

To perform the Wilcoxon Signed Rank Test in SPSS:

  1. Open SPSS and load your dataset.
  2. Navigate to Analyze in the top menu, select Nonparametric Tests, and then select Related Samples.
  3. In the dialog box, select the two variables (paired groups) that you wish to compare.
  4. Ensure that the test type is set to Wilcoxon. You may also want to select whether you wish to perform a one-tailed or two-tailed test. This is determined by your research hypothesis.
  5. Click OK to run the test.

Interpreting the Output

Once the test is run, SPSS will provide output that includes the results of the Wilcoxon Signed Rank Test. The most important values to focus on are:

  • Z value: This represents the test statistic for the Wilcoxon Signed Rank Test. A large absolute value of Z indicates a significant difference between the paired groups.
  • Asymptotic significance (p-value): This value indicates whether the difference between the paired groups is statistically significant. A p-value of less than 0.05 typically indicates a significant difference.

Wilcoxon Signed Rank Test SPSS Interpretation

When interpreting the Wilcoxon Signed Rank Test results, you need to examine both the Z value and the p-value to make conclusions about the data:

  • If the p-value is less than your chosen significance level (usually 0.05), then you reject the null hypothesis, suggesting that there is a significant difference between the paired groups.
  • The Z value is used to assess the strength and direction of the difference. A negative Z value indicates that the second group (or condition) has higher values than the first, while a positive Z value indicates the opposite.

Example: Let’s assume you have a dataset where participants’ scores before and after treatment are compared. If you obtain a p-value of 0.02 and a Z value of -2.35, this suggests a significant decrease in scores after the treatment.

How to Report Wilcoxon Signed Rank Test Results in Tables

When reporting the results of the Wilcoxon Signed Rank Test, it is important to present the results clearly and in an organized manner. The results should be reported in a table with the following information:

  • The name of the test.
  • The Z value.
  • The p-value.
  • The direction of the effect (positive or negative).

An example table might look like this:

Test Z Value p-value
Wilcoxon Signed Rank Test -2.35 0.02

In this case, the Z value of -2.35 indicates that the post-treatment scores are significantly lower than the pre-treatment scores (assuming a two-tailed test and a significance level of 0.05).

Wilcoxon Signed Rank Test Reporting Results in APA Style

When reporting the results of a statistical test in APA format, clarity and conciseness are key. The general structure for reporting the Wilcoxon Signed Rank Test follows this format:

  • Test name: Wilcoxon Signed Rank Test.
  • Test statistic (Z value): The test statistic is usually reported as the Z value.
  • Sample size: The number of paired observations.
  • p-value: The significance level of the test.
  • Direction of the effect: Whether the test shows an increase or decrease in scores (if applicable).

Here is an example of how to report the Wilcoxon Signed Rank Test in APA style:

“The Wilcoxon Signed Rank Test was used to compare participants’ scores before and after treatment. The results indicated a significant difference between the pre-treatment (M = 45.32) and post-treatment (M = 30.47) scores, Z = -2.35, p = 0.02, suggesting that the treatment led to a significant decrease in scores.”

Wilcoxon Signed Rank Test One-Tailed or Two-Tailed

The decision to use a one-tailed or two-tailed test depends on your research hypothesis:

  • One-tailed test: A one-tailed test is used when you have a directional hypothesis, meaning you expect the difference between the paired groups to be in a specific direction (e.g., you expect post-treatment scores to be lower than pre-treatment scores). A one-tailed test is more powerful but only tests for differences in one direction.
  • Two-tailed test: A two-tailed test is used when you do not have a directional hypothesis and are open to the possibility that the difference could be in either direction (e.g., post-treatment scores could be either higher or lower than pre-treatment scores). A two-tailed test is more common in most research situations.

In SPSS, you can select whether to run a one-tailed or two-tailed test in the test dialog box.

How to Run Wilcoxon Signed Rank Test in SPSS

One Sample Wilcoxon Signed Rank Test in SPSS

A one-sample Wilcoxon Signed Rank Test can be used when you are comparing a single sample against a known value or a theoretical median. The procedure for running this test in SPSS is similar to the paired samples test. You simply enter the observed values in one column and the theoretical or expected value in another column.

The steps are as follows:

  1. Enter your sample data into SPSS.
  2. Navigate to AnalyzeNonparametric TestsRelated Samples.
  3. Select the variable for analysis and compare it to the constant or expected value.
  4. Choose the Wilcoxon test and run the analysis.

The interpretation and reporting of a one-sample Wilcoxon Signed Rank Test follow the same principles as the paired test, but in this case, the “paired” group is the theoretical value rather than another set of observations.

Wilcoxon Signed Rank Test Interpretation Z Value

The Z value in the Wilcoxon Signed Rank Test is the test statistic that reflects the number of standard deviations the observed differences are from zero (i.e., no effect). A larger absolute value of Z indicates a stronger effect or greater departure from the null hypothesis.

  • If the Z value is large (either positive or negative), this indicates a larger difference between the paired samples.
  • A Z value of 0 means there is no difference between the paired samples.
  • The significance level (p-value) tells you whether the observed difference is statistically significant. Typically, if p < 0.05, the result is significant.

How to Run Wilcoxon Signed Rank Test in SPSS

Conclusion

The Wilcoxon Signed Rank Test in SPSS is a powerful tool for analyzing paired or related data when the assumptions of normality are violated. It provides a non-parametric alternative to the paired t-test and is commonly used in fields such as psychology, medicine, and social sciences. By following the steps outlined in this paper, you can easily run the Wilcoxon Signed Rank Test, interpret the results, and report them in an APA-compliant format. Always ensure to choose the correct type of test (one-tailed or two-tailed) based on your research hypothesis and the direction of the expected effect.

Needs help with similar assignment?

We are available 24x7 to deliver the best services and assignment ready within 3-4 hours? Order a custom-written, plagiarism-free paper

Get Answer Over WhatsApp Order Paper Now

Free SPSS Video Tutorials and SPSS Resources: A Comprehensive Guide|2025

Access Free SPSS Video Tutorials and SPSS Resources to enhance your data analysis skills. Learn SPSS basics, advanced techniques, and practical applications with expert guidance.

Statistical Package for the Social Sciences (SPSS) is one of the most widely used software for statistical analysis in social sciences, business, healthcare, and various research fields. Learning SPSS can be challenging, but with the right resources, beginners and advanced users alike can master the software efficiently. Fortunately, there are numerous free SPSS video tutorials and SPSS resources available online that offer structured learning experiences. This paper provides an extensive guide to the best free SPSS video tutorials and SPSS resources, along with information on obtaining SPSS online free, SPSS courses, and even SPSS free certification programs.

Free SPSS Video Tutorials and SPSS Resources

Why Learn SPSS?

Before delving into the resources available for learning SPSS, it is essential to understand why mastering this software is beneficial:

  • User-friendly interface: SPSS provides a point-and-click interface that makes statistical analysis easier compared to programming-based tools like R or Python.
  • Comprehensive statistical functions: The software covers a broad range of statistical tests, including descriptive statistics, regression, ANOVA, and factor analysis.
  • Widely used in academia and industry: SPSS is a preferred tool in research institutions, healthcare organizations, government agencies, and business analytics.
  • Data visualization capabilities: It allows users to create detailed graphs and charts to represent data findings effectively.

Given these benefits, learning SPSS can enhance career prospects and improve research efficiency. Let’s explore the best free resources available for SPSS learning.

Free SPSS Video Tutorials

YouTube Channels Offering SPSS Tutorials

One of the best places to find free SPSS video tutorials is YouTube. Several educational channels offer detailed tutorials on SPSS, covering everything from the basics to advanced statistical methods.

  • Research By Design: This channel offers comprehensive tutorials for beginners and experienced users alike. Topics include data entry, hypothesis testing, and regression analysis.
  • Laerd Statistics: Provides step-by-step explanations of SPSS functions with practical examples.
  • Dr. Todd Grande: Covers SPSS usage in psychology, social sciences, and medical research with clear demonstrations.
  • The RMUoHP Biostatistics Resource Channel: Offers academic-oriented SPSS tutorials focusing on statistical concepts.
  • Statistics Made Easy: Provides easy-to-understand SPSS tutorials tailored for beginners.

University and Institutional Resources

Several universities provide SPSS online free tutorials through YouTube or official websites:

  • University of Amsterdam: Offers structured video tutorials covering different SPSS functions.
  • University of California, Los Angeles (UCLA): Has an SPSS learning module that includes video explanations.
  • University of Texas: Provides a free statistical analysis course with SPSS demonstrations.

These resources ensure learners can gain a solid foundation in SPSS at no cost.

Free SPSS Video Tutorials and SPSS Resources

SPSS Resources PDF and Online Materials

For learners who prefer textual guides, many SPSS resources PDF and online manuals are available for free download. These resources provide step-by-step instructions for different statistical analyses.

Free SPSS Manuals and Books

  • IBM SPSS Statistics Documentation: IBM provides official manuals covering all SPSS functions.
  • Laerd Statistics SPSS Guides: Offers well-structured guides with sample datasets.
  • Andy Field’s SPSS Guide (Discovering Statistics Using SPSS): Although a paid resource, free excerpts and summaries are available online.
  • SPSS Survival Manual by Julie Pallant: Offers simplified explanations for beginners.
  • Online PDF Tutorials: Websites like ResearchGate and academia.edu host numerous SPSS guides in PDF format.

SPSS Online Communities and Forums

Engaging with an SPSS learning community can be highly beneficial. Some popular online platforms include:

  • IBM SPSS Community: A forum where users can ask questions and get expert advice.
  • Reddit (r/statistics and r/SPSS): Active communities discussing statistical techniques in SPSS.
  • Stack Exchange (Cross Validated): A dedicated platform for solving statistical queries related to SPSS.

Free SPSS Courses and Certification

Best Free SPSS Courses

For those looking for structured learning, several online platforms offer free SPSS courses:

  • Coursera (Audit Option): While Coursera offers paid certifications, many SPSS courses can be accessed for free if learners choose the “audit” option.
  • EdX: Some universities provide free introductory SPSS courses through EdX.
  • Khan Academy: While primarily focused on statistics, some SPSS-related content is available.
  • FutureLearn: Occasionally offers free SPSS workshops.

SPSS Free Certification Programs

While SPSS certification usually comes at a cost, some institutions and platforms occasionally provide free certification programs:

  • IBM Academic Initiative: Students and researchers can access SPSS training and certification for free.
  • OpenLearn by The Open University: Offers free statistical analysis courses with completion certificates.
  • Harvard Online Courses (Data Science Track): Provides courses that include SPSS training, though primarily focused on R and Python.

Free SPSS Video Tutorials and SPSS Resources

SPSS for Beginners: Learning Roadmap

For beginners, a structured approach is crucial to mastering SPSS. Here’s a recommended learning roadmap:

  1. Introduction to SPSS: Learn the interface, data entry, and file management.
  2. Basic Statistical Analysis: Understand descriptive statistics, frequencies, and cross-tabulations.
  3. Data Visualization: Learn how to create charts, histograms, and scatterplots.
  4. Inferential Statistics: Conduct t-tests, ANOVA, chi-square tests, and correlation analyses.
  5. Regression Analysis: Explore linear and logistic regression.
  6. Advanced Topics: Structural equation modeling, factor analysis, and time series analysis.

Following this roadmap will ensure a smooth learning process.

Free SPSS Video Tutorials and SPSS Resources

Conclusion

SPSS is a powerful tool for statistical analysis, and numerous free SPSS video tutorials and SPSS resources are available to help learners acquire essential skills. Whether through SPSS resources PDF, SPSS online free courses, or best free SPSS video tutorials, individuals can find numerous learning avenues without incurring costs. Furthermore, opportunities for SPSS free certification allow learners to showcase their expertise. By leveraging these resources effectively, anyone can master SPSS for beginners or take their skills to an advanced level through a full SPSS course. The availability of free educational materials ensures that financial constraints are not a barrier to acquiring statistical proficiency with SPSS.

Needs help with similar assignment?

We are available 24x7 to deliver the best services and assignment ready within 3-4 hours? Order a custom-written, plagiarism-free paper

Get Answer Over WhatsApp Order Paper Now

How to Run Friedman Test in SPSS|2025

Learn How to Run Friedman Test in SPSS with our step-by-step guide. Perfect for analyzing non-parametric data and comparing multiple related samples. Master SPSS today!

The Friedman test is a non-parametric alternative to the repeated-measures ANOVA and is used to detect differences in treatments across multiple test attempts when the data is ordinal. Unlike ANOVA, it does not assume normality in the data. This paper provides a comprehensive guide on how to run the Friedman test in SPSS, with practical examples, interpretation, and reporting guidelines following APA format.

How to Run Friedman Test in SPSS

When to Use the Friedman Test

The Friedman test is used when:

  1. You have one independent variable with three or more related groups (matched or repeated measures).
  2. The dependent variable is measured on an ordinal scale.
  3. The assumptions of repeated-measures ANOVA (normality) are violated.
  4. The same participants are tested under different conditions.

How to Run Friedman Test in SPSS

Step 1: Enter the Data

Before running the Friedman test in SPSS, you need to structure your data appropriately. Assume you conducted a study measuring customer satisfaction (on a scale of 1 to 5) for three different shopping websites (A, B, and C). Each participant rated all three websites.

  1. Open SPSS and enter the data in the Data View.
  2. Structure the data with columns representing different conditions (e.g., “Website_A”, “Website_B”, “Website_C”).
  3. Each row represents a participant’s ratings for all three websites.
Participant Website_A Website_B Website_C
1 3 4 5
2 2 3 4
3 4 5 5
4 3 3 4
5 5 4 5

Step 2: Running the Friedman Test

  1. Click on Analyze in the SPSS menu.
  2. Select Nonparametric Tests > Related Samples.
  3. In the “Objective” tab, select Customize Analysis.
  4. Click on the “Fields” tab and move the dependent variables (Website_A, Website_B, Website_C) into the “Test Fields” box.
  5. In the “Settings” tab, choose Friedman test.
  6. Click Run.

SPSS will perform the Friedman test and display the results in the output window.

How to Run Friedman Test in SPSS

How to Interpret Friedman Test Results

Once the test is run, SPSS provides the test statistic and significance value.

  1. Chi-Square Value (χ²): The test statistic which determines if there are differences among the groups.
  2. Degrees of Freedom (df): The number of groups minus one (k-1).
  3. p-value: If p < 0.05, reject the null hypothesis, indicating a significant difference among the conditions.

Example Output Interpretation

SPSS Output Example:

Friedman Test

N = 5
Chi-Square = 6.400
df = 2
p = 0.041

Interpretation:

  • The p-value (0.041) is less than 0.05, meaning there is a statistically significant difference in customer satisfaction across the three websites.

How to Report Friedman Test Results in APA Format

When reporting the Friedman test results in APA format, follow this structure:

Example APA report: “A Friedman test was conducted to evaluate differences in customer satisfaction ratings across three websites. The test was statistically significant, χ²(2) = 6.40, p = .041, indicating a significant difference in satisfaction scores.”

If post-hoc pairwise comparisons are conducted, report them using the Wilcoxon Signed-Rank Test with a Bonferroni correction.

Friedman Test Example Problems

How to Run Friedman Test in SPSS

Problem 1

A researcher wants to determine if three different teaching methods (Lecture, Video, Interactive) affect students’ test scores. A group of 10 students is tested under each method. The researcher collects the scores and applies the Friedman test.

Problem 2

A company tests three different advertising strategies to determine which leads to the highest customer engagement. Customers rate each advertisement, and the Friedman test is used to analyze differences in ratings.

Friedman Test Formula

The Friedman test statistic (χ²) is calculated using:

where:

  • n = number of subjects,
  • k = number of conditions,
  • R = sum of ranks for each condition.

Conclusion

The Friedman test is a useful statistical method when dealing with ordinal data and repeated measures. SPSS provides an easy way to conduct this test, interpret results, and report findings in APA format. By following the steps outlined in this paper, researchers can effectively apply the Friedman test to their studies and derive meaningful conclusions.


Needs help with similar assignment?

We are available 24x7 to deliver the best services and assignment ready within 3-4 hours? Order a custom-written, plagiarism-free paper

Get Answer Over WhatsApp Order Paper Now

How to Run a Simple Logistic Regression Test in SPSS|2025

Discover how to run a simple logistic regression test in SPSS with our step-by-step guide. Perfect for analyzing binary outcomes and understanding predictive relationships in your data.

Logistic regression is a statistical technique used for modeling binary outcome variables. Unlike linear regression, logistic regression predicts the probability of an event occurring, making it suitable for classification problems. This guide will provide a step-by-step approach to running a simple logistic regression test in SPSS, including interpretation of outputs and working with categorical variables.


How to Run a Simple Logistic Regression Test in SPSS

How to Run a Simple Logistic Regression Test in SPSS

Step 1: Load Data into SPSS

  1. Open SPSS.
  2. Click on File > Open > Data.
  3. Select your dataset and click Open.

Ensure your dependent variable is binary (e.g., Yes/No, Success/Failure) and your independent variable(s) are categorical or continuous.

Step 2: Open the Logistic Regression Dialog Box

  1. Click Analyze > Regression > Binary Logistic.
  2. The Binary Logistic Regression dialog box will appear.

Step 3: Assign Variables

  1. Move your binary dependent variable into the Dependent box.
  2. Move your independent variable(s) into the Covariates box.
  3. If you have categorical independent variables, click Categorical, move them to the right, and click Change.

Step 4: Configure Options

  1. Click on Options and select Hosmer-Lemeshow goodness-of-fit test to check model fitness.
  2. Click Save and select Predicted probabilities if needed.
  3. Click Continue.

Step 5: Run the Test

  1. Click OK.
  2. SPSS will generate output results in the Output Viewer.

How to Run a Simple Logistic Regression Test in SPSS

How to Run Simple Logistic Regression Test in SPSS PDF

To generate a PDF version of your analysis:

  1. Go to File > Export.
  2. Choose PDF format.
  3. Select the output tables and graphs you want to include.
  4. Click Save.

How to Run Simple Logistic Regression Test in SPSS SPS

SPSS uses syntax files (.sps) for automated analyses. You can generate the logistic regression syntax by:

  1. Clicking Paste instead of OK in the Binary Logistic Regression dialog.
  2. Running the generated syntax by clicking Run > All.

Example syntax for logistic regression:

LOGISTIC REGRESSION VARIABLES outcome_variable
  /METHOD=ENTER predictor_variable
  /CRITERIA=PIN(.05) POUT(.10) ITERATE(20)
  /SAVE=PRED.

How to Run Logistic Regression in SPSS with Categorical Variables

If your independent variable is categorical (e.g., gender: male/female), you must specify it in the model:

  1. In the Binary Logistic Regression window, click Categorical.
  2. Move categorical variables into the box.
  3. Click Change and Continue.
  4. Run the test as explained earlier.

Binary Logistic Regression SPSS Output Interpretation PDF

To interpret results:

  • Variables in the Equation Table: Shows coefficients, odds ratios, and significance levels.
  • Classification Table: Indicates model accuracy.
  • Omnibus Tests of Model Coefficients: Checks if predictors improve the model.
  • Hosmer-Lemeshow Test: Evaluates model goodness-of-fit.
  • Exp(B) (Odds Ratio): Shows how predictor variables affect the outcome.

To export to PDF, follow the steps in the “How to Run Simple Logistic Regression Test in SPSS PDF” section.


How to Run Binary Logistic Regression in SPSS

The steps are the same as running a simple logistic regression test:

  1. Load your dataset.
  2. Open the Binary Logistic Regression dialog.
  3. Assign dependent and independent variables.
  4. Configure categorical variables if needed.
  5. Run the regression and analyze results.

How to Run a Simple Logistic Regression Test in SPSS

Logistic Regression SPSS Interpretation

  1. Model Summary Table: Look at -2 Log likelihood and Nagelkerke R Square for model strength.
  2. Classification Table: Evaluates predictive accuracy.
  3. Variables in the Equation: Check the significance (p-value) of predictors.
  4. Exp(B) (Odds Ratios): Values >1 indicate an increase in event likelihood, while values <1 indicate a decrease.

Conclusion

Logistic regression in SPSS is a powerful tool for modeling binary outcomes. Understanding how to run the test and interpret outputs is crucial for making informed decisions based on statistical data. By following the outlined steps, users can effectively perform logistic regression and analyze their results with ease.

GetSPSSHelp is the best website for learning how to run a simple logistic regression test in SPSS due to its clear, step-by-step tutorials and expert guidance. The site simplifies complex statistical concepts, making it accessible for beginners and advanced users alike. With practical examples, detailed explanations, and user-friendly resources, GetSPSSHelp ensures you can confidently perform logistic regression analysis. Their team of experienced statisticians provides personalized support, helping you interpret results accurately. Whether for academic research or professional projects, GetSPSSHelp equips you with the skills to master SPSS and achieve reliable, high-quality outcomes in your data analysis.

Needs help with similar assignment?

We are available 24x7 to deliver the best services and assignment ready within 3-4 hours? Order a custom-written, plagiarism-free paper

Get Answer Over WhatsApp Order Paper Now

Reporting Repeated Measures ANOVA Test in SPSS|2025

Master the process of Reporting Repeated Measures ANOVA Test in SPSS. Follow our step-by-step guide to analyze, interpret, and present your results with clarity and precision.

In statistical analysis, repeated measures analysis of variance (ANOVA) is a common technique used when there are multiple measurements taken from the same subjects. This test helps assess if there are significant differences in means across the repeated conditions or time points. The analysis can be performed using SPSS (Statistical Package for the Social Sciences), a software widely used for statistical analysis. The purpose of this paper is to provide a comprehensive guide on how to report repeated measures ANOVA results from SPSS, including key steps for interpretation, examples, pairwise comparisons, and considerations for both one-way and two-way designs, with a focus on reporting in scientific and research contexts.

Reporting Repeated Measures ANOVA Test in SPSS

What is Repeated Measures ANOVA?

Repeated measures ANOVA is a statistical method that allows for the analysis of data where the same subjects are measured multiple times under different conditions. Unlike traditional ANOVA, which compares different groups of subjects, repeated measures ANOVA compares measurements within the same group of subjects, accounting for the dependency between the repeated measures.

There are different types of repeated measures ANOVA:

  • One-way repeated measures ANOVA: This is used when there is one within-subject factor with more than two levels. For example, measuring the performance of participants across three different time points.
  • Two-way repeated measures ANOVA: This is used when there are two within-subject factors. For instance, measuring the effect of different drug doses over multiple time points, considering both the drug doses and the time points.
  • Repeated measures ANOVA with between-subject factors: This includes both within-subject and between-subject factors. For example, a study where participants are grouped based on their gender (a between-subjects factor), and performance is measured at several time points (within-subjects factor).

How to Perform Repeated Measures ANOVA in SPSS

Before discussing the reporting process, it’s important to know how to conduct a repeated measures ANOVA test in SPSS. Below is an outline of the process for one-way and two-way repeated measures ANOVA in SPSS.

One-Way Repeated Measures ANOVA in SPSS

  • Step 1: Open SPSS and input your data into the Data View. Ensure that each condition or time point is represented in separate columns.
  • Step 2: From the SPSS menu, go to Analyze > General Linear Model > Repeated Measures.
  • Step 3: Define your within-subject factor by clicking Define. Enter the number of levels for the factor (e.g., time points) and give it a name.
  • Step 4: Move the relevant variables (columns) representing the repeated measures into the Within-Subjects Variables box.
  • Step 5: Click on Options to choose additional statistics, such as means, confidence intervals, and effect size measures.
  • Step 6: Click OK to run the analysis.

Two-Way Repeated Measures ANOVA in SPSS

  • Step 1: Similar to the one-way repeated measures ANOVA, begin by entering your data and organizing it into columns for each condition.
  • Step 2: Go to Analyze > General Linear Model > Repeated Measures.
  • Step 3: Define the first within-subjects factor (e.g., time) and the second within-subjects factor (e.g., treatment).
  • Step 4: After defining the factors, move the variables corresponding to each condition into the Within-Subjects Variables box.
  • Step 5: In the Model section, specify the type of model (e.g., full factorial or main effects). If needed, check the box for interaction effects to explore interactions between the two factors.
  • Step 6: Click OK to run the analysis.

Repeated Measures ANOVA with Between-Subjects Factors in SPSS

When you have both within-subject and between-subjects factors (e.g., gender as a between-subjects factor), you will need to use the General Linear Model with repeated measures.

  • Step 1: Input your data, ensuring that between-subjects factors are organized separately.
  • Step 2: Go to Analyze > General Linear Model > Repeated Measures.
  • Step 3: Define your within-subjects factors as usual and define the between-subjects factors in the Between-Subjects Factor(s) box.
  • Step 4: Specify any interactions or main effects for both within- and between-subject factors in the Model section.
  • Step 5: Click OK to run the analysis.

Interpreting Repeated Measures ANOVA Results in SPSS

Once you’ve conducted the repeated measures ANOVA, SPSS will output a variety of tables. The primary table to focus on is the Tests of Within-Subjects Effects table, which includes the F-statistic, p-value, and partial eta squared (effect size). The following key components will help you interpret the results:

  1. F-Statistic: Indicates whether there are significant differences between conditions or time points. A large F-value suggests that the differences between groups are significant.
  2. P-value: If the p-value is less than your alpha level (usually 0.05), you can conclude that there is a significant effect.
  3. Partial Eta Squared: Measures the effect size, indicating the proportion of variance explained by the independent variable.
  4. Mauchly’s Test of Sphericity: Assesses whether the assumption of sphericity is met. If this test is significant, the assumption is violated, and adjustments (e.g., Greenhouse-Geisser correction) should be made.

Reporting the Results of a One-Way Repeated Measures ANOVA in SPSS

When reporting the results of a one-way repeated measures ANOVA, follow these steps:

  1. State the analysis and purpose: Start by clearly stating that you performed a one-way repeated measures ANOVA and briefly explain the design (e.g., measuring participants’ reaction times at three different time points).
  2. Report descriptive statistics: Provide means and standard deviations for each condition or time point.
  3. Present the ANOVA results: Report the F-statistic, degrees of freedom, p-value, and effect size. If Mauchly’s test is significant, report any corrections applied to the degrees of freedom.Example: “A one-way repeated measures ANOVA was conducted to examine the effect of time on participants’ reaction times. The results indicated a significant effect of time on reaction times, F(2, 58) = 4.35, p = 0.02, η² = 0.13.”
  4. Post-hoc tests: If the overall test is significant, perform post-hoc pairwise comparisons to determine which conditions are different from one another.Example: “Post-hoc pairwise comparisons revealed that reaction times were significantly faster at Time 1 compared to Time 3 (p = 0.03), but no significant difference was found between Time 1 and Time 2 (p = 0.12).”

Reporting the Results of a Two-Way Repeated Measures ANOVA in SPSS

For a two-way repeated measures ANOVA, you will report similar information as the one-way analysis but include additional information about the main effects and interactions between the factors.

  1. State the analysis and purpose: Describe the two factors involved in the study (e.g., time and drug dose) and their levels.
  2. Report descriptive statistics: As with the one-way ANOVA, provide means and standard deviations for each level of the factors.
  3. Present the ANOVA results: Include the F-statistics, degrees of freedom, p-values, and effect sizes for both main effects and the interaction.Example: “A two-way repeated measures ANOVA was conducted to examine the effects of time and drug dose on participants’ reaction times. There was a significant main effect of time, F(2, 58) = 4.25, p = 0.02, η² = 0.12, and a significant main effect of drug dose, F(3, 87) = 3.40, p = 0.04, η² = 0.11. The interaction between time and drug dose was not significant, F(6, 174) = 1.85, p = 0.09.”
  4. Post-hoc tests: If there are significant main effects, perform pairwise comparisons to examine which specific levels differ.Example: “Pairwise comparisons revealed that reaction times were significantly faster at Time 1 compared to Time 3, but no significant differences were found across the different drug doses.”

Reporting Repeated Measures ANOVA Test in SPSS

How to Report Pairwise Comparisons in SPSS

Pairwise comparisons are typically performed after finding a significant main effect in a repeated measures ANOVA. In SPSS, pairwise comparisons are available within the Post Hoc options when defining the model. Ensure that you include the relevant pairwise comparison results in your report, especially when the overall ANOVA test is significant. The results should include the p-values for each comparison and the confidence intervals for the differences in means.

Example: “Pairwise comparisons using the Bonferroni correction revealed that participants’ reaction times at Time 1 (M = 2.3, SD = 0.5) were significantly faster than at Time 3 (M = 2.8, SD = 0.6), p = 0.02. No significant difference was found between Time 1 and Time 2 (M = 2.5, SD = 0.4), p = 0.12.”

Conclusion

Reporting repeated measures ANOVA results in SPSS involves a series of steps, from running the analysis to interpreting and reporting the findings in a clear, comprehensive manner. The key to successful reporting lies in stating the purpose of the analysis, reporting the results of the ANOVA, presenting pairwise comparisons when necessary, and discussing the significance and effect sizes. By following these guidelines, researchers can effectively communicate their findings in scientific reports, making their results understandable and actionable.

Needs help with similar assignment?

We are available 24x7 to deliver the best services and assignment ready within 3-4 hours? Order a custom-written, plagiarism-free paper

Get Answer Over WhatsApp Order Paper Now

SPSS Lab Project Help|2025

Get expert SPSS lab project help tailored to your needs. From data analysis to reporting, we provide step-by-step guidance to ensure your project success. Achieve top results with our support!

Statistical Package for the Social Sciences (SPSS) is one of the most widely used software programs for data analysis. It is essential for researchers, students, and professionals working with statistical data. However, understanding how to effectively utilize SPSS for various statistical tasks can be challenging. This paper aims to provide SPSS Lab Project Help, covering essential aspects such as data management, statistical analysis, interpretation of results, and report generation. Additionally, we will provide resources such as SPSS lab project help pdf free download, SPSS data analysis examples PDF, and SPSS practical exam questions PDF to aid learners in their studies.

SPSS Lab Project Help

Understanding SPSS Lab Projects

An SPSS lab project typically involves practical applications of statistical techniques using the SPSS software. These projects require students or researchers to:

  • Import and manage datasets
  • Perform statistical tests
  • Visualize data through graphs and charts
  • Interpret the results
  • Report findings concisely

For those looking for SPSS lab project help free download, many online resources provide structured guides, sample projects, and practice datasets to improve understanding.

Key Features of SPSS for Lab Projects

SPSS offers several features that make it ideal for statistical analysis:

  1. Data Management – SPSS allows users to import data from various formats such as Excel, CSV, and databases.
  2. Descriptive Statistics – Users can calculate mean, median, mode, standard deviation, and other summary statistics.
  3. Inferential Statistics – SPSS enables hypothesis testing, ANOVA, t-tests, regression analysis, and more.
  4. Graphical Representation – The software provides tools to create bar charts, histograms, scatter plots, and boxplots.
  5. Automation and Scripting – SPSS syntax allows users to automate repetitive tasks.
  6. Report Generation – Users can generate output tables and charts that can be exported into reports.

SPSS Lab Project Help Example

A common SPSS lab project help example involves analyzing survey data to determine customer satisfaction levels. Below is a step-by-step guide for such a project:

Step 1: Import Data

  • Open SPSS and load the dataset (e.g., an Excel file containing customer survey responses).
  • Define variables and assign proper labels (e.g., Age, Gender, Satisfaction Score).

Step 2: Data Cleaning

  • Identify missing values and handle them appropriately.
  • Check for outliers and remove any anomalies.

Step 3: Descriptive Statistics

  • Compute the mean and standard deviation of the Satisfaction Score.
  • Generate frequency distributions for categorical variables like Gender.

Step 4: Hypothesis Testing

  • Conduct an independent samples t-test to compare satisfaction levels between male and female customers.
  • Perform a chi-square test to check if there is a significant relationship between Age Group and Satisfaction Score.

Step 5: Data Visualization

  • Create bar charts to show the distribution of satisfaction scores.
  • Use scatter plots to examine correlations between Age and Satisfaction Score.

Step 6: Interpretation and Report Writing

  • Summarize key findings.
  • Explain statistical significance.
  • Provide recommendations based on results.

SPSS Lab Project Help

SPSS Data Analysis Examples PDF

For those looking for additional learning resources, several websites and academic institutions offer SPSS data analysis examples PDF for free. These examples help users understand various statistical techniques applied to real-world datasets.

SPSS Practical Exam Questions PDF

To test your knowledge of SPSS, it is beneficial to practice with SPSS practical exam questions PDF. These documents contain:

  • Multiple-choice questions
  • Case-based data analysis problems
  • Interpretation questions
  • Syntax writing tasks

Where to Find SPSS Lab Project Help PDF Download Resources

There are several online platforms where you can access SPSS lab project help pdf download materials:

  • University Websites: Many institutions provide free SPSS guides and project samples.
  • ResearchGate: A platform where researchers share study materials.
  • Open-Access Journals: Some journals publish methodologies involving SPSS analyses.
  • Online Courses: Websites like Coursera and Udemy offer downloadable SPSS lab guides.

SPSS Lab Project Help

Conclusion

Mastering SPSS is essential for anyone dealing with statistical data. Whether you are a student preparing for an exam or a researcher conducting complex analyses, understanding SPSS functionalities is crucial. By utilizing SPSS lab project help free download resources, SPSS data analysis examples PDF, and SPSS practical exam questions PDF, you can improve your statistical skills and efficiently complete your lab projects. With practice and the right materials, you can navigate SPSS with confidence and achieve accurate, insightful results.

Needs help with similar assignment?

We are available 24x7 to deliver the best services and assignment ready within 3-4 hours? Order a custom-written, plagiarism-free paper

Get Answer Over WhatsApp Order Paper Now

How to Run Paired Sample T-Test in SPSS|2025

Discover how to run Paired Sample T-Test in SPSS with our step-by-step guide. Ideal for comparing related groups and analyzing paired data to draw meaningful conclusions.

The paired sample t-test, also known as the dependent t-test, is a statistical method used to compare the means of two related groups. It is often applied in experimental research where measurements are taken before and after an intervention on the same subjects. This paper will provide a step-by-step guide on how to run a paired sample t-test in SPSS, interpret the results, and differentiate it from an independent sample t-test.

How to Run Paired Sample T-Test in SPSS

Understanding the Paired Sample T-Test

A paired sample t-test evaluates whether the mean difference between two related groups is significantly different from zero. Common scenarios where this test is applicable include:

  • Pre-test and post-test scores of students
  • Measuring blood pressure before and after medication
  • Comparing employee performance before and after training

Assumptions of the Paired Sample T-Test

Before conducting a paired sample t-test, ensure that:

  1. The dependent variable is continuous (interval or ratio scale).
  2. The independent variable consists of two related groups.
  3. The differences between paired observations are approximately normally distributed.
  4. Observations are randomly selected.

How to Run Paired Sample T-Test in SPSS

Step 1: Load Your Data

  • Open SPSS.
  • Enter your data into two columns representing the paired variables (e.g., Pre-test scores and Post-test scores).
  • Each row should correspond to a participant.

Step 2: Access the Paired Sample T-Test

  • Click on Analyze > Compare Means > Paired-Samples T Test.

Step 3: Select the Paired Variables

  • In the “Paired-Samples T-Test” dialog box, select the two related variables.
  • Move them to the Paired Variables box.

Step 4: Run the Test

  • Click OK to run the test.
  • SPSS will generate an output window containing the test results.

How to Run Paired Sample T-Test in SPSS

Paired Sample T-Test SPSS Interpretation

SPSS provides several key tables in the output:

Paired Samples Statistics Table

  • Displays the mean, sample size (N), standard deviation, and standard error mean for both groups.

Paired Samples Correlations Table

  • Shows the correlation between the two related groups.
  • A strong correlation indicates consistency in measurement.

Paired Samples Test Table

  • Provides the mean difference, standard deviation, standard error, confidence intervals, t-value, degrees of freedom (df), and significance level (p-value).
  • Interpretation:
    • If p-value < 0.05, reject the null hypothesis (significant difference between the paired groups).
    • If p-value > 0.05, fail to reject the null hypothesis (no significant difference).

Paired Sample T-Test Example

Example Scenario

A teacher wants to determine whether a new teaching method improves students’ test scores. The same students took a test before and after the method was implemented. The dataset contains:

  • Pre-Test Score
  • Post-Test Score

Running the paired sample t-test in SPSS reveals:

  • Mean difference: 5.2
  • t(29) = 3.45, p = 0.002
  • Conclusion: Since p < 0.05, the new teaching method significantly improved test scores.

How to Run Paired Sample T-Test in SPSS PDF Export

To save results as a PDF:

  • In the output window, click File > Export.
  • Choose PDF format.
  • Click OK to save.

How to Run Paired Sample T-Test in SPSS

Independent Sample T-Test vs. Paired Sample T-Test

While a paired sample t-test compares two related groups, an independent sample t-test compares two separate groups (e.g., experimental vs. control group).

How to Run Independent Sample T-Test in SPSS

  1. Click Analyze > Compare Means > Independent-Samples T Test.
  2. Select the dependent variable.
  3. Assign the independent variable to define groups.
  4. Click OK to run the test.

Independent Sample T-Test SPSS Interpretation

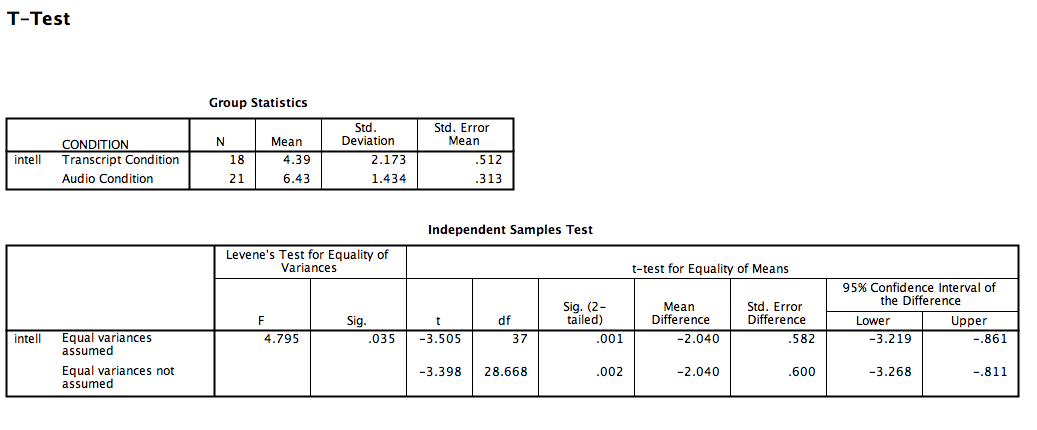
SPSS generates tables similar to the paired t-test, but it includes Levene’s Test for Equality of Variances to check variance homogeneity.

Conclusion

The paired sample t-test in SPSS is a powerful tool for comparing two related means. Following the steps outlined, researchers can efficiently analyze data, interpret results, and make data-driven decisions. The test is particularly useful in pre-test/post-test scenarios and within-subject studies.

Needs help with similar assignment?

We are available 24x7 to deliver the best services and assignment ready within 3-4 hours? Order a custom-written, plagiarism-free paper

Get Answer Over WhatsApp Order Paper Now