Pearsons Correlation Coefficient Determining Statistical Relationship Between Variables|2025
Pearsons Correlation Coefficient Determining Statistical Relationship Between Variables. Understand how this statistical tool measures the strength and direction of relationships in data analysis.
Pearson’s correlation coefficient, often denoted as r, is a widely used statistical tool that quantifies the linear relationship between two continuous variables. It is a measure of how well one variable can be predicted by another. The Pearson correlation coefficient ranges from -1 to 1, where values closer to 1 indicate a strong positive linear relationship, values closer to -1 indicate a strong negative linear relationship, and values near 0 suggest little to no linear relationship.
Understanding the Pearson correlation coefficient is critical in research and data analysis. It helps researchers determine the strength and direction of a relationship between variables, which is valuable in various fields such as social sciences, economics, biology, and healthcare. This paper delves into Pearson’s correlation coefficient, its formula, interpretation, applications, and the use of statistical tools like SPSS in calculating and interpreting the correlation.
Pearson’s Correlation Coefficient: An Overview
Pearson’s correlation coefficient is a measure of the degree of linear relationship between two variables. This statistical tool is essential for understanding the strength and direction of the relationship between variables, which can further influence decisions in fields like finance, education, medicine, and social sciences.
Mathematically, the Pearson correlation coefficient r is calculated as:
r=n(Σxy)−(Σx)(Σy)[nΣx2−(Σx)2][nΣy2−(Σy)2]r = \frac{{n(\Sigma xy) – (\Sigma x)(\Sigma y)}}{{\sqrt{{[n\Sigma x^2 – (\Sigma x)^2][n\Sigma y^2 – (\Sigma y)^2]}}}}
Where:
- n is the number of pairs of data points.
- x and y are the individual data points of the two variables.
- Σxy is the sum of the product of the paired scores.
- Σx² and Σy² are the sum of the squared values of the x and y variables respectively.
This formula calculates the degree to which the variables move together in a linear fashion. The value of r can vary from -1 to 1:
- r = 1 indicates a perfect positive linear relationship.
- r = -1 indicates a perfect negative linear relationship.
- r = 0 indicates no linear relationship.
Interpretation of Pearson’s Correlation Coefficient
The interpretation of Pearson’s correlation coefficient revolves around its magnitude and direction:
- Positive Correlation (r > 0): When r is positive, it indicates that as one variable increases, the other also increases. For example, the number of hours studied and exam scores may have a positive correlation.
- Negative Correlation (r < 0): When r is negative, it means that as one variable increases, the other decreases. For instance, the number of hours spent watching TV and academic performance may have a negative correlation.
- Zero or No Correlation (r = 0): If r equals zero, it implies that there is no linear relationship between the two variables. However, this does not mean that the variables are independent, as they could still have a non-linear relationship.
Strength of Correlation
- 0.1 to 0.3: Weak positive correlation.
- 0.3 to 0.5: Moderate positive correlation.
- 0.5 to 0.7: Strong positive correlation.
- 0.7 to 1: Very strong positive correlation.
- -0.1 to -0.3: Weak negative correlation.
- -0.3 to -0.5: Moderate negative correlation.
- -0.5 to -0.7: Strong negative correlation.
- -0.7 to -1: Very strong negative correlation.
Example Problems with Solutions: Pearson’s Correlation
Problem 1:
Question: A researcher wants to examine the relationship between the number of hours students study and their exam scores. The data collected from 5 students is shown below:
| Student | Hours Studied (X) | Exam Score (Y) |
|---|---|---|
| 1 | 1 | 50 |
| 2 | 2 | 55 |
| 3 | 3 | 60 |
| 4 | 4 | 70 |
| 5 | 5 | 80 |
Solution: To calculate Pearson’s correlation coefficient, we apply the formula and substitute the appropriate values for x and y.
Step 1: Calculate the necessary summations:
- Σx = 1 + 2 + 3 + 4 + 5 = 15
- Σy = 50 + 55 + 60 + 70 + 80 = 315
- Σx² = 1² + 2² + 3² + 4² + 5² = 1 + 4 + 9 + 16 + 25 = 55
- Σy² = 50² + 55² + 60² + 70² + 80² = 2500 + 3025 + 3600 + 4900 + 6400 = 18425
- Σxy = (1 * 50) + (2 * 55) + (3 * 60) + (4 * 70) + (5 * 80) = 50 + 110 + 180 + 280 + 400 = 1020
Step 2: Apply these values to the Pearson’s correlation formula:
r=5(1020)−(15)(315)[5(55)−(15)2][5(18425)−(315)2]r = \frac{{5(1020) – (15)(315)}}{{\sqrt{{[5(55) – (15)²][5(18425) – (315)²]}}}}
After simplifying the equation, we find r ≈ 0.995, indicating a very strong positive correlation between hours studied and exam scores.
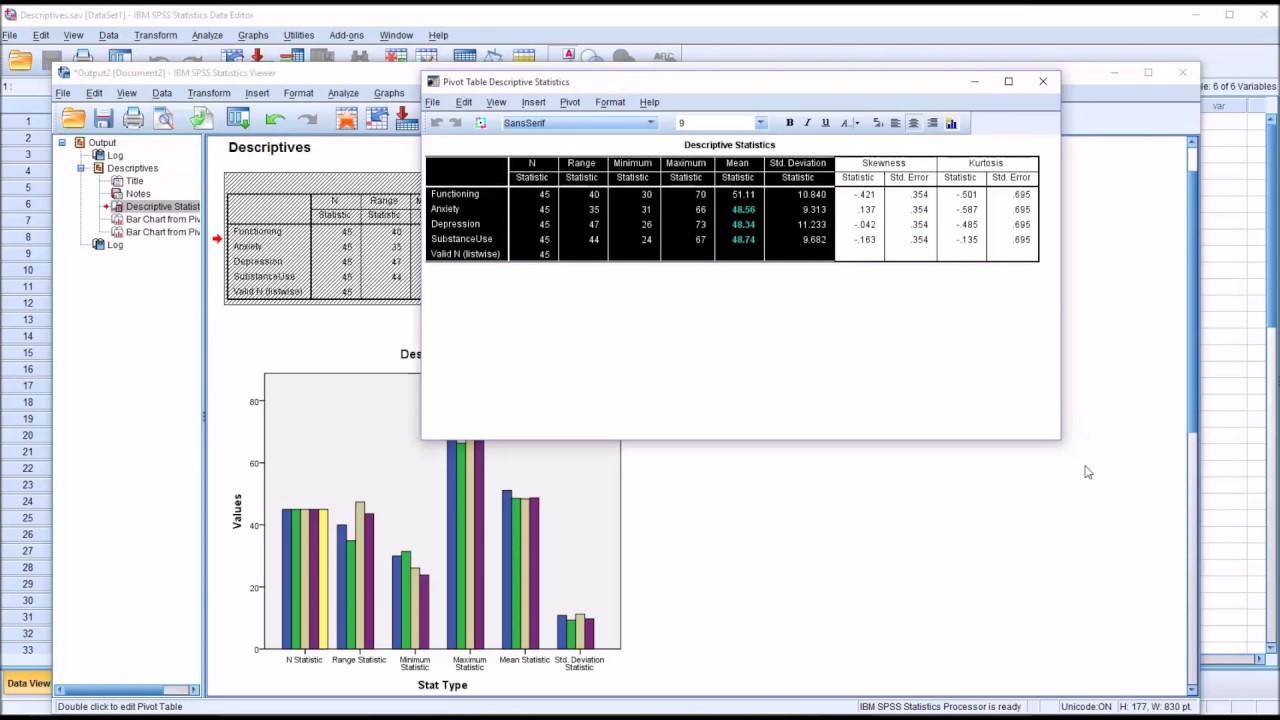
Using SPSS to Calculate Pearson’s Correlation Coefficient
SPSS (Statistical Package for the Social Sciences) is a popular software used for statistical analysis. It provides a straightforward method for calculating Pearson’s correlation coefficient.
Steps in SPSS:
- Enter the data into two columns, one for each variable (e.g., hours studied and exam score).
- Click on Analyze → Correlate → Bivariate.
- In the dialog box, select the two variables you wish to correlate.
- Check the Pearson option and click OK.
SPSS will generate an output with the Pearson correlation coefficient and its corresponding p-value.
When to Use Pearson Correlation in Research
Pearson’s correlation is appropriate in the following situations:
- The variables involved should be continuous (interval or ratio data).
- The relationship between the variables should be linear.
- The data should approximate a normal distribution.
- Both variables should be measured at the same level of measurement (continuous).
It is crucial to ensure that these assumptions are met before using Pearson’s correlation. For non-linear relationships or ordinal data, other correlation coefficients, like Spearman’s rank correlation, may be more appropriate.
Sample Research Using Pearson’s Correlation
In social science research, Pearson’s correlation can be used to study relationships between variables. For instance, a researcher may examine the relationship between income level (X) and educational attainment (Y). By collecting data from a sample of individuals, they could compute the Pearson correlation coefficient to determine if there is a linear relationship between these two variables.
Pearson’s Correlation Coefficient Formula: Copy and Paste
The formula for calculating the Pearson correlation coefficient is:
r=n(Σxy)−(Σx)(Σy)[nΣx2−(Σx)2][nΣy2−(Σy)2]r = \frac{{n(\Sigma xy) – (\Sigma x)(\Sigma y)}}{{\sqrt{{[n\Sigma x^2 – (\Sigma x)^2][n\Sigma y^2 – (\Sigma y)^2]}}}}
Understanding the Pearson Correlation P-Value
In statistical hypothesis testing, the p-value is used to determine the significance of the correlation. The null hypothesis assumes that there is no correlation between the two variables. A p-value less than a chosen significance level (e.g., α = 0.05) indicates that the correlation is statistically significant, meaning the observed relationship is unlikely due to chance.
If the p-value is greater than 0.05, we fail to reject the null hypothesis and conclude that there is no significant correlation between the variables.
Conclusion
Pearson’s correlation coefficient is an invaluable statistical tool for understanding the linear relationship between two continuous variables. It allows researchers to quantify and interpret the strength and direction of this relationship, which can inform decisions and further research. Whether through manual calculation or using software like SPSS, Pearson’s r provides insights that guide scientific discovery across various fields. Researchers should carefully consider the assumptions underlying the use of this statistic to ensure valid and meaningful results.
By mastering the Pearson correlation coefficient, researchers can gain a deeper understanding of data and make more informed decisions based on the relationships between variables.
Needs help with similar assignment?
We are available 24x7 to deliver the best services and assignment ready within 3-4 hours? Order a custom-written, plagiarism-free paper