Step-by-Step Guide to Completing SPSS Assignments|2025

Master data analysis with this Step-by-Step Guide to Completing SPSS Assignments. Ideal for students and professionals, this guide walks you through data entry, test selection, output interpretation, and report writing to ensure accuracy and success in your SPSS projects.

Introduction

SPSS (Statistical Package for the Social Sciences) is a powerful tool for statistical analysis, widely used in academic research, business analytics, and social sciences. However, many students struggle with SPSS assignments due to its complex interface and the need for statistical knowledge.

This step-by-step guide will walk you through the entire process of completing an SPSS assignment—from data entry and cleaning to running statistical tests and interpreting results. By the end, you’ll have a structured approach to tackle any SPSS task efficiently.


Understanding the Assignment Requirements

Before opening SPSS, carefully read your assignment instructions to determine:
✔ Research question/hypothesis (What are you testing?)
✔ Variables involved (Independent/Dependent, Measurement scales)
✔ Statistical tests required (T-tests, ANOVA, Regression, Chi-Square, etc.)
✔ Output expectations (Tables, graphs, written interpretation)

Example Assignment Prompt:
“Compare the mean exam scores of male and female students using an independent samples t-test. Report descriptive statistics, test results, and a brief interpretation.”

Key Tasks Identified:

  1. Enter/import data.

  2. Run descriptive statistics.

  3. Conduct an independent samples t-test.

  4. Interpret and report results.


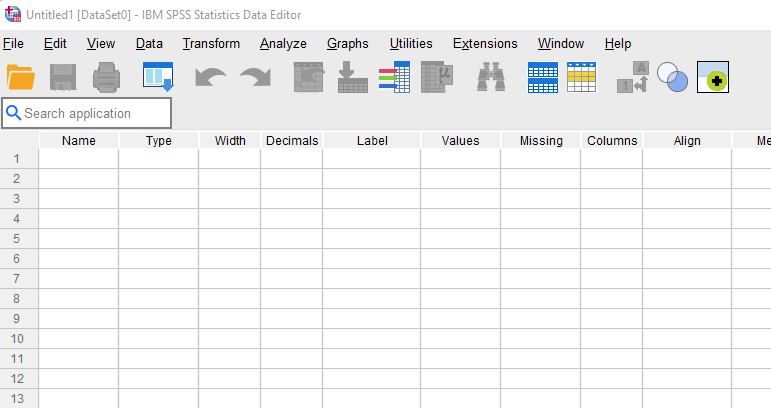
Preparing and Entering Data in SPSS

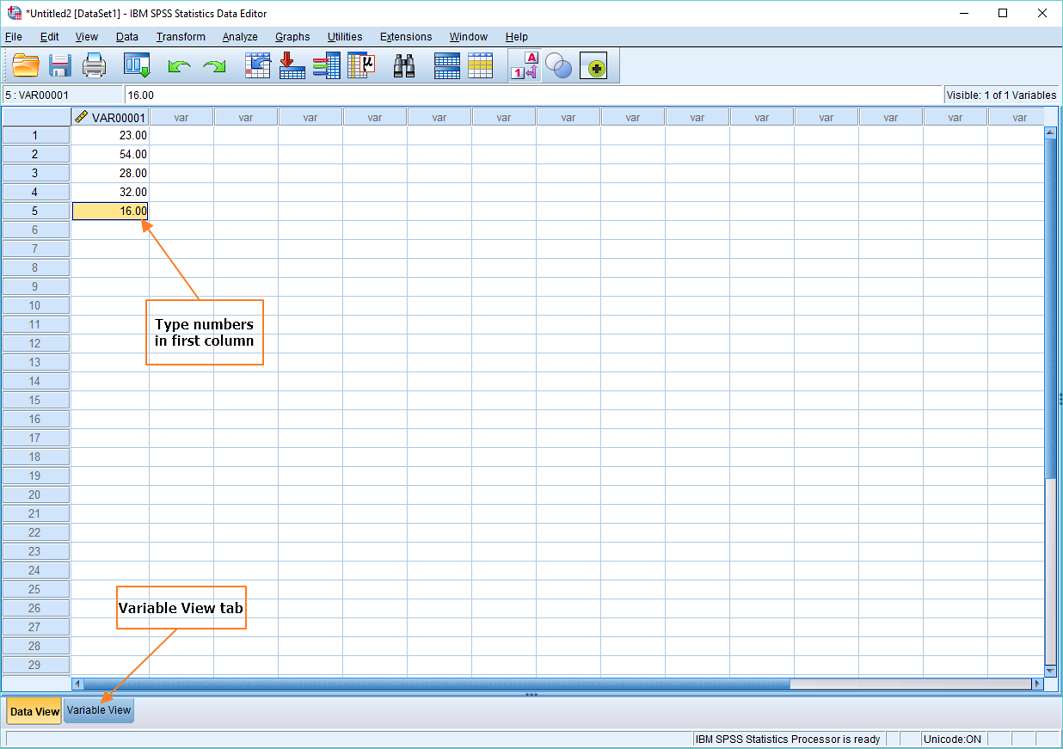
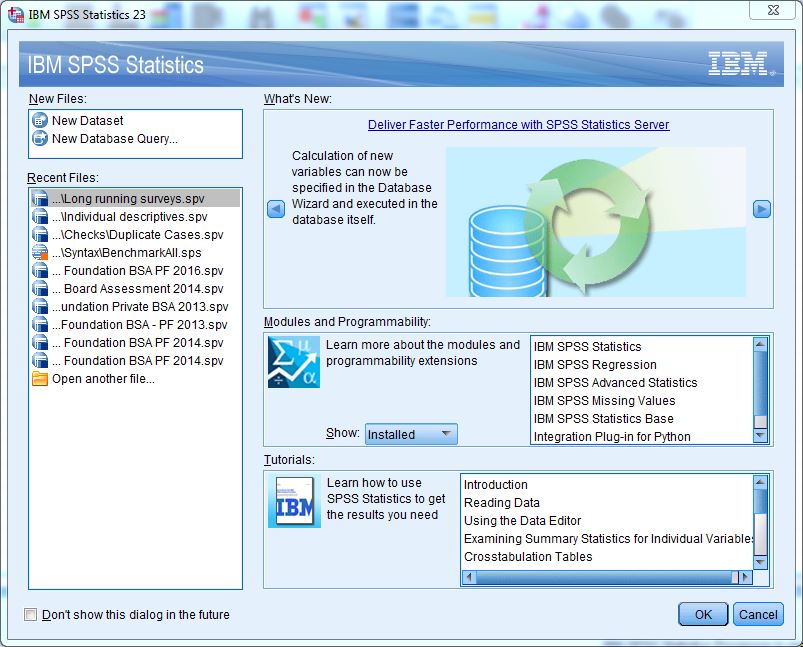
Step 1: Open SPSS and Set Up Variables

  1. Launch SPSS → Click “Variable View” (bottom-left tab).

  2. Define each variable:

    • Name (e.g., “Gender,” “Exam_Score”)

    • Type (Numeric for quantitative, String for text)

    • Label (Full description, e.g., “Student Gender”)

    • Values (For categorical variables, e.g., 1 = Male, 2 = Female)

    • Measure (Nominal, Ordinal, Scale)

Example Variable Setup:

Name Type Label Values Measure
Gender Numeric Student Gender 1=Male, 2=Fem Nominal
Exam_Score Numeric Final Exam (%) Scale

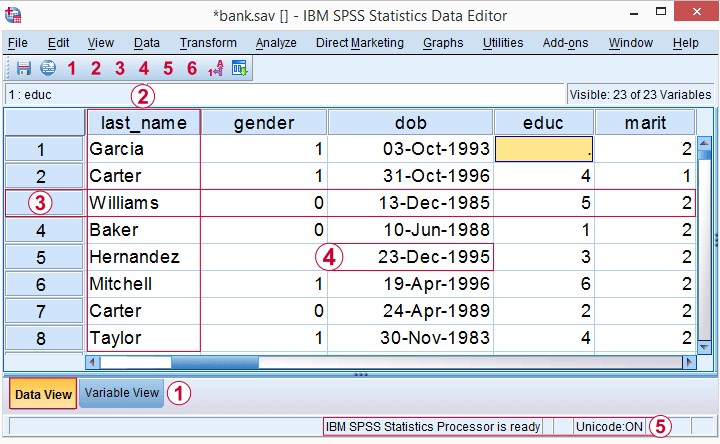
Step 2: Enter Data in “Data View”

  1. Switch to “Data View” (top-left tab).

  2. Manually input data or import from Excel (File → Open → Data → Select .xlsx file).

Example Data Entry:

Gender Exam_Score
1 85
2 92
1 78

Step-by-Step Guide to Completing SPSS Assignments

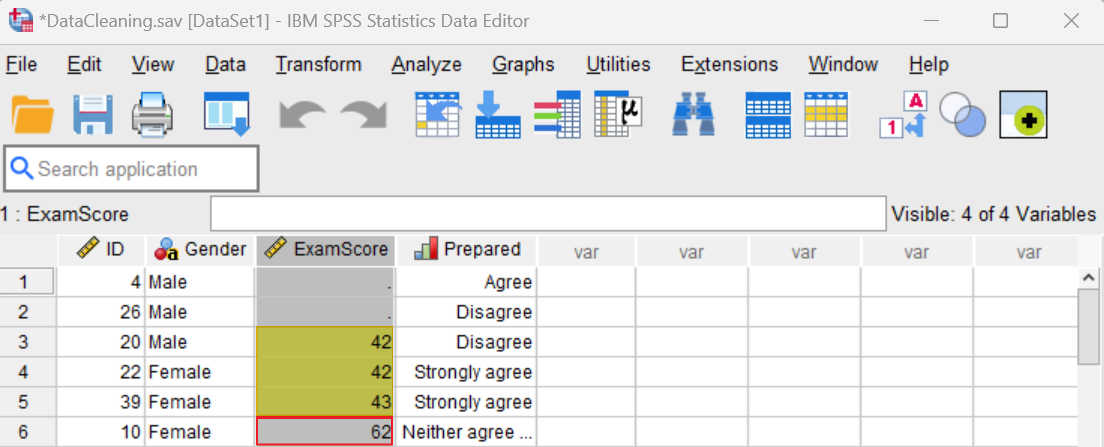
Cleaning and Screening Data

Before analysis, check for:
✔ Missing values (Analyze → Descriptive Statistics → Frequencies)
✔ Outliers (Graphs → Boxplots)
✔ Normality (Shapiro-Wilk test: Analyze → Descriptive → Explore → Plots → Normality)

Fixing Issues:

  • Missing Data: Use “Recode” or “Replace Missing Values” (Transform menu).

  • Outliers: Decide whether to exclude or transform (e.g., log transformation).


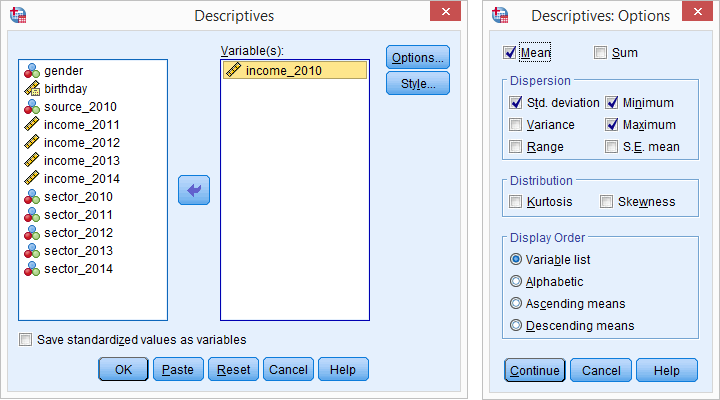
Running Descriptive Statistics

Purpose: Summarize key features of the data.

Steps:

  1. Analyze → Descriptive Statistics → Descriptives/Frequencies

  2. Select variables (e.g., Exam_Score).

  3. Click “Options” to include Mean, SD, Min, Max.

Example Output:

N Mean Std. Deviation
Exam_Score 30 80.2 9.5

Interpretation:

  • The average exam score is 80.2% with moderate variability (SD = 9.5).


Conducting Statistical Tests

Case 1: Independent Samples T-Test (Comparing Two Groups)

Steps:

  1. Analyze → Compare Means → Independent-Samples T-Test

  2. Move Exam_Score to “Test Variable(s).”

  3. Move Gender to “Grouping Variable” → Define Groups (1 and 2).

  4. Click OK.

Interpreting Output:

  1. Group Statistics: Compare means (e.g., Males: 78.5, Females: 82.0).

  2. Levene’s Test: If p > 0.05, assume equal variances.

  3. T-Test Results: Check Sig. (2-tailed). If p < 0.05, the difference is significant.

Reporting:
*”An independent-samples t-test revealed that females (M = 82.0, SD = 8.2) scored significantly higher than males (M = 78.5, SD = 9.1), t(28) = 2.45, p = .021.”*


Case 2: One-Way ANOVA (Comparing Three+ Groups)

Steps:

  1. Analyze → Compare Means → One-Way ANOVA

  2. Move Exam_Score to “Dependent List.”

  3. Move Group (e.g., Class_Section) to “Factor.”

  4. Click Post Hoc → Select Tukey → OK.

Interpreting Output:

  1. ANOVA Table: If p < 0.05, groups differ significantly.

  2. Post-Hoc Tests: Identify which groups differ (e.g., Section A > Section B).

Reporting:
*”A one-way ANOVA showed significant differences in exam scores by class section, F(2, 27) = 4.67, p = .018. Tukey post-hoc tests indicated Section A (M = 85.2) scored higher than Section B (M = 77.4), p = .012.”*


Case 3: Pearson Correlation (Relationship Between Variables)

Steps:

  1. Analyze → Correlate → Bivariate

  2. Select variables (e.g., Study_Hours, Exam_Score).

  3. Check Pearson → OK.

Interpreting Output:

  • Correlation Coefficient (r):

    • 0 to 0.3 = Weak

    • 0.3 to 0.7 = Moderate

    • 0.7+ = Strong

  • Sig. (p-value): If p < 0.05, the correlation is significant.

Reporting:
*”A Pearson correlation revealed a moderate positive relationship between study hours and exam scores, r(28) = .52, p = .003.”*


Case 4: Chi-Square Test (Categorical Associations)

Steps:

  1. Analyze → Descriptive Statistics → Crosstabs

  2. Move one variable to Rows (e.g., Gender), another to Columns (e.g., Pass/Fail).

  3. Click Statistics → Check Chi-Square → OK.

Interpreting Output:

  • Pearson Chi-Square: If p < 0.05, the association is significant.

Reporting:
*”A chi-square test indicated a significant association between gender and pass/fail rates, χ²(1) = 5.67, p = .017.”*


Step-by-Step Guide to Completing SPSS Assignments

Creating Tables and Graphs

Generating Tables:

  1. Right-click output tables → Copy → Paste into Word.

  2. Use APA formatting (e.g., italicize headers, align decimals).
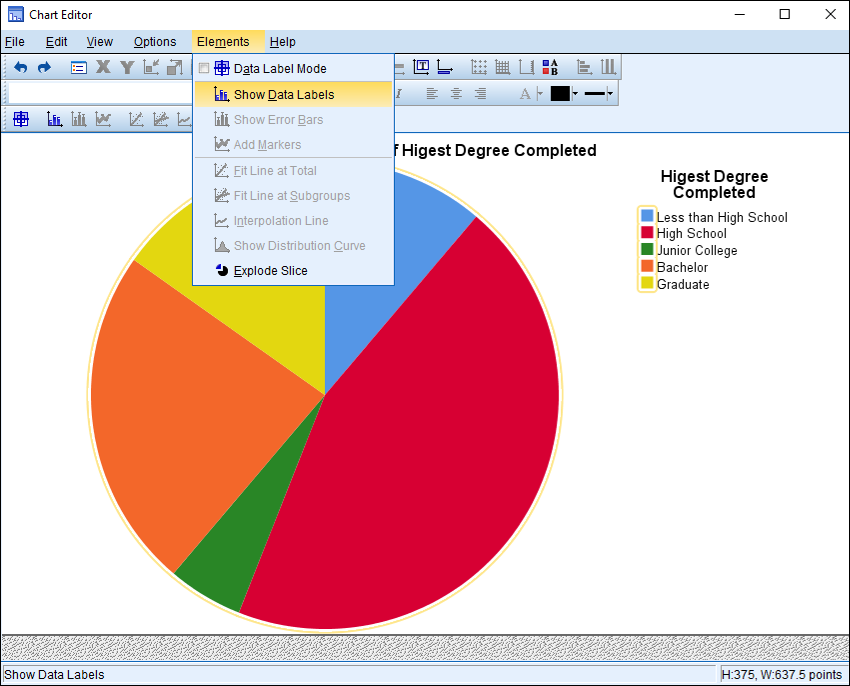
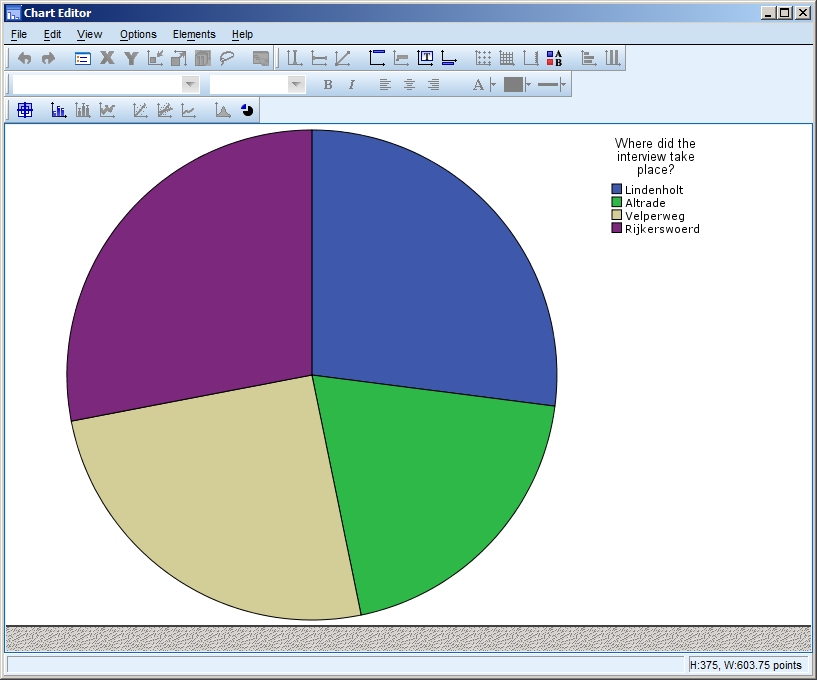
Creating Graphs:

  1. Graphs → Chart Builder

  2. Select type (Bar, Scatter, Histogram).

  3. Drag variables to axes → Click OK.

Example:

  • Bar Chart: Compare group means.

  • Scatterplot: Visualize correlations.


Writing the Interpretation

Structure your interpretation with:

  1. Objective: Restate the research question.

  2. Method: Test used (e.g., “An independent t-test was conducted…”).

  3. Results: Key statistics (means, p-values, effect sizes).

  4. Conclusion: Answer the research question.

Example:
*”The analysis compared exam scores between male and female students using an independent t-test. Results showed females scored significantly higher (M = 82.0) than males (M = 78.5), t(28) = 2.45, p = .021. This suggests gender may influence academic performance.”*


Proofreading and Submission

✔ Check:

  • All tests align with the assignment requirements.

  • No missing values/errors in output.

  • Interpretation is clear and concise.
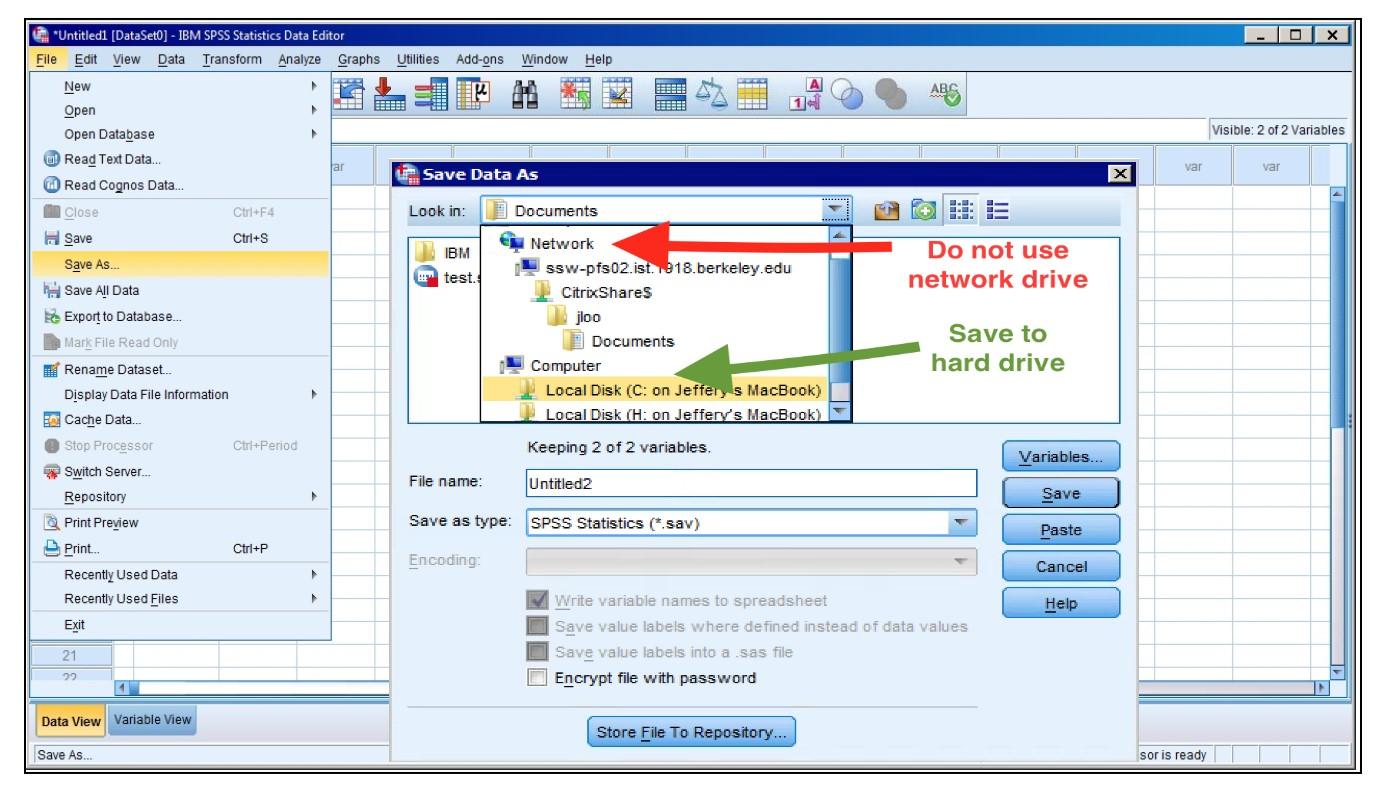
    ✔ Save:

  • SPSS Data File (.sav)

  • Output File (.spv)

  • Export tables/graphs to Word/PDF.


Step-by-Step Guide to Completing SPSS Assignments

Conclusion

Completing an SPSS assignment involves:

  1. Understanding requirements (hypothesis, variables, tests).

  2. Preparing data (entry, cleaning, screening).

  3. Running analyses (descriptives, t-tests, ANOVA, etc.).

  4. Interpreting and reporting results (tables, graphs, written summary).

By following this structured approach, you can efficiently tackle SPSS assignments with confidence.

Needs help with similar assignment?

We are available 24x7 to deliver the best services and assignment ready within 3-4 hours? Order a custom-written, plagiarism-free paper

Get Answer Over WhatsApp Order Paper Now

Tips for SPSS Beginners|2025

Discover essential Tips for SPSS Beginners to build a strong foundation in data analysis. Learn how to navigate the interface, enter data correctly, choose the right tests, and interpret output effectively. Perfect for students and first-time users aiming to master SPSS with confidence.

Familiarize Yourself with the SPSS Interface

Understanding the SPSS interface is the first step towards effective data analysis. The main components include:

  • Data View: Displays your dataset in a spreadsheet format, where rows represent cases and columns represent variables.

  • Variable View: Allows you to define and manage your variables, including names, types, and labels.

Import Data Efficiently

SPSS supports various data formats such as Excel, CSV, and TXT files. To import data:

  1. Go to File > Open > Data.

  2. Select your file format and locate your dataset.

  3. Ensure variables are assigned correctly during import.

Tips for SPSS Beginners

Define Variables Properly

Accurate variable definition ensures meaningful analysis:

  • Variable Names: Use short, descriptive names without spaces or special characters.

  • Variable Type: Choose appropriate types (e.g., numeric, string).

  • Value Labels: Assign labels to categorical variables for clarity.

Clean Your Data

Data cleaning is crucial for reliable results:

  • Identify Missing Data: Use Analyze > Descriptive Statistics > Frequencies to detect blanks.

  • Handle Outliers: Visualize data using boxplots (Graphs > Chart Builder).

  • Transform Variables: Use Transform > Compute Variable to create new variables or recode existing ones.

Utilize SPSS Syntax

SPSS Syntax allows for automation and reproducibility:

  • Generate Syntax: Use the “Paste” button instead of “OK” in dialog boxes to generate syntax.

  • Modify and Run: Edit and execute commands in the Syntax Editor.

  • Save Syntax Files: Store syntax files for future use, ensuring consistency.

Create Effective Visualizations

Visual representations enhance data interpretation:

  • Chart Builder: Access via Graphs > Chart Builder.

  • Choose Chart Types: Select appropriate charts like histograms, bar charts, or scatterplots.

  • Customize: Adjust titles, labels, and color schemes for clarity.

Interpret SPSS Output Carefully

Understanding SPSS output is vital:

  • Key Metrics: Focus on p-values, confidence intervals, and effect sizes.

  • Tables and Charts: Review tables and charts that summarize your results.

  • Formatting: Use APA formatting for academic reports.

Save and Export Your Work

Preserve your work and share results:

  • Save Data: Use File > Save As to save datasets as .sav files.

  • Export Outputs: Export outputs to Word or PDF via File > Export.

  • Backup: Always back up your files to prevent data loss.

Engage with the SPSS Community

Learning from others can accelerate your progress:

  • Online Communities: Join forums and groups where SPSS users share knowledge and experiences.

  • Seek Help: Don’t hesitate to ask questions and seek assistance when needed.

Practice Regularly

Hands-on experience is the best way to learn:

  • Real Datasets: Work with publicly available datasets to apply your skills.

  • Consistent Practice: Regularly use SPSS to become more comfortable and proficient.

Tips for SPSS Beginners

Understand Levels of Measurement

SPSS uses measurement levels to determine how variables are treated statistically:

  • Nominal: Categories without inherent order (e.g., gender, country)

  • Ordinal: Categories with order but not equal intervals (e.g., education level)

  • Scale (Interval/Ratio): Continuous variables with equal intervals (e.g., age, income)

Properly setting these levels in the Variable View helps SPSS determine which analyses are suitable. For example, you cannot compute a mean for a nominal variable like “marital status.”

Tip: Always double-check the “Measure” column in Variable View to avoid analysis errors or misleading outputs.


Use Split File and Select Cases Wisely

These two features allow you to perform subgroup analyses or isolate specific cases for analysis.

  • Split File: Found under Data > Split File, it enables you to analyze data by groups (e.g., compare males vs. females).

  • Select Cases: Found under Data > Select Cases, it lets you include or exclude cases based on conditions (e.g., only analyzing respondents above age 30).

Tip: Always turn off Split File and Select Cases when you’re done, or future analyses may be affected.


Know the Difference Between Recode and Compute

  • Recode is used when you want to convert variable values. For example, turning a 5-point Likert scale into 3 categories (e.g., 1–2 = Disagree, 3 = Neutral, 4–5 = Agree).

    • Use Transform > Recode into Same Variables or Recode into Different Variables.

  • Compute is used to create new variables based on formulas (e.g., computing the total score from multiple questions).

    • Use Transform > Compute Variable.

Tip: Always test your computed or recoded variables by running Frequencies or Descriptives to confirm the transformation worked as expected.


Document Your Process

Documentation is crucial, especially when working in teams or revisiting projects later. SPSS provides several ways to document your work:

  • Syntax Comments: Use an asterisk (*) before a line to write a comment in the Syntax Editor.

  • Output Notes: Add notes to output sections using the right-click context menu.

  • Data Documentation: Use the Label and Value Labels fields in Variable View to clarify what variables and codes mean.

Tip: Good documentation can save you hours of confusion in the future, especially when sharing your work.


Tips for SPSS Beginners

Use Descriptive Statistics Before Inferential Tests

Before jumping into t-tests, regressions, or ANOVA, always run descriptive statistics. This helps you:

  • Check data quality

  • Understand variable distributions

  • Identify potential outliers or errors

Use:

  • Analyze > Descriptive Statistics > Frequencies

  • Analyze > Descriptive Statistics > Descriptives

  • Graphs > Chart Builder (for histograms, boxplots, etc.)

Tip: A strong understanding of your data reduces the risk of incorrect statistical assumptions.


Save Syntax and Output Files Separately

SPSS files come in different types:

  • .sav: Data files

  • .sps: Syntax files

  • .spv: Output files

Always save your syntax separately so that your analysis can be reproduced or modified later. Even if you’re using the GUI, clicking “Paste” before “OK” creates a record of your commands.

Tip: Adopt a consistent naming convention, such as project1_cleaned.sav, project1_analysis.sps, and project1_results.spv.


Avoid Common Mistakes in SPSS

Even experienced users can fall into these traps:

  • Forgetting to change a variable’s type from string to numeric

  • Running analyses on missing or unclean data

  • Misinterpreting output (especially p-values or direction of effects)

  • Copy-pasting outputs without checking the assumptions of the test

  • Not saving your work frequently (SPSS doesn’t autosave!)

Tip: Use a checklist when preparing data and running analyses to avoid these pitfalls.


Learn How to Interpret Key Outputs

Here are some examples of essential outputs and how to interpret them:

T-Test Output

  • Look at Levene’s Test to determine equal variances.

  • Focus on the Sig. (2-tailed) value: p < .05 usually indicates a significant difference between groups.

Regression Output

  • : Indicates how much variance is explained by the model.

  • Coefficients Table: Pay attention to B, Beta, and Sig. values.

ANOVA Output

  • Look for F and Sig. values.

  • If significant, follow up with Post Hoc Tests (e.g., Tukey).

Tip: Don’t rely solely on p-values. Consider effect sizes and confidence intervals for meaningful insights.


Tips for SPSS Beginners

Explore SPSS Help and Tutorials

SPSS includes built-in help and tooltips for almost every function:

  • Use Help > Topics for detailed guides.

  • Hover over variable names and icons for descriptions.

  • Access the IBM Knowledge Center online for tutorials and user manuals.

Additionally, popular resources include:

  • YouTube channels (e.g., Research By Design, Global Stats Academy)

  • Free courses (e.g., Coursera, YouTube, Udemy)

  • SPSS books for beginners like “SPSS Survival Manual” by Julie Pallant

Tip: Bookmark helpful links and videos in a dedicated “SPSS Resources” folder.


Integrate SPSS with Other Tools

While SPSS is powerful, it can be complemented by other software:

  • Excel: For data entry, visualization, or preliminary calculations.

  • Word/PDF: Export outputs for reports.

  • R/Python: For advanced data processing and custom scripting.

SPSS also supports:

  • Python Plugins (for automation)

  • R integration (via R Essentials module)

Tip: Knowing a second data analysis tool (like R) can increase your flexibility as a data analyst.


Customize SPSS for a Better Workflow

SPSS can be tailored to suit your preferences:

  • Change the default output style: Go to Edit > Options > Output Labels to customize tables.

  • Use templates for output appearance: Save your favorite chart styles and formatting.

  • Set default folder paths for data and output files under Edit > Options > File Locations.

Tip: Making SPSS “yours” reduces friction and speeds up routine tasks.


Practice with Real-World Data Sets

Theory is essential, but practical application builds confidence. Here are some public datasets to practice on:

Use these datasets to:

  • Test data cleaning techniques

  • Build basic and advanced statistical models

  • Explore storytelling with data


Learn Data Visualization Best Practices

Creating clear and meaningful graphs is crucial:

  • Avoid chart junk: Keep charts simple and focus on key messages.

  • Label axes and titles clearly

  • Use color purposefully to differentiate groups

SPSS’s Chart Editor lets you fine-tune your visuals. Alternatively, you can export data to Excel for additional visualization tools.


Develop Your Analytical Thinking

SPSS is a tool—your critical thinking makes the difference. As you grow:

  • Focus on asking the right questions.

  • Learn to challenge results and consider alternative explanations.

  • Use SPSS to support, not replace, logical reasoning.


Tips for SPSS Beginners

Don’t Fear Mistakes—They’re Part of Learning

Everyone makes errors in SPSS. Whether it’s a misplaced decimal or selecting the wrong test, mistakes are normal and essential for growth.

Tip: Keep a journal or notes about what you learned from each mistake. Over time, this log becomes a powerful learning tool.


Conclusion: Building SPSS Confidence Step by Step

Mastering SPSS takes time, practice, and patience. But with the right approach, even the most hesitant beginner can become a confident data analyst. Let’s recap the most important tips:

  1. Understand the interface—Data View and Variable View are your foundation.

  2. Clean your data before analysis.

  3. Practice syntax, even if you prefer the GUI.

  4. Document everything—from variables to tests.

  5. Explore descriptive stats before running complex models.

  6. Engage with the SPSS community and keep learning.

Remember, SPSS is just a tool. Your curiosity, problem-solving skills, and commitment to learning will determine your success. Take your time, explore real-world problems, and don’t be afraid to experiment.

Needs help with similar assignment?

We are available 24x7 to deliver the best services and assignment ready within 3-4 hours? Order a custom-written, plagiarism-free paper

Get Answer Over WhatsApp Order Paper Now

Understanding the Basics of SPSS|2025

Start your data analysis journey by Understanding the Basics of SPSS. This beginner-friendly guide covers essential features, data entry, variable setup, and basic statistical tests to help students and researchers confidently navigate SPSS and perform accurate, efficient analyses.

Introduction

In today’s data-driven world, having the right tools to analyze data is essential. One of the most widely used statistical software packages is IBM SPSS Statistics. Designed for beginners and professionals alike, SPSS simplifies complex data analysis and is a powerful tool for social scientists, healthcare researchers, marketers, and educators. This article offers a comprehensive guide to understanding the basics of SPSS, using highly searched terms to help you find the information you need quickly and efficiently.


Understanding the Basics of SPSS

What is SPSS?

SPSS, which stands for Statistical Package for the Social Sciences, is a software program developed by IBM for statistical analysis. It is commonly used in social sciences, psychology, health research, education, marketing, and business. SPSS enables users to perform descriptive statistics, regression analysis, ANOVA, and various advanced statistical procedures with ease.


Key Features of SPSS

SPSS is known for its:

  • User-friendly interface: Ideal for users who are not familiar with programming languages.
  • Data management capabilities: Easily sort, filter, and manipulate datasets.
  • Comprehensive statistical tools: Includes descriptive, inferential, and predictive analytics.
  • Customizable output: Create graphs, tables, and exportable reports.

These features make SPSS one of the most sought-after data analysis tools in research and academia.


Why Use SPSS for Data Analysis?

There are several reasons why SPSS is the go-to tool for many data analysts:

  • Accuracy and reliability: Ensures statistically valid results.
  • Ease of use: Great for beginners and professionals alike.
  • Support for various data formats: Accepts Excel, CSV, and database files.
  • Extensive documentation and community support: Easy access to tutorials and troubleshooting help.

Understanding the Basics of SPSS

Understanding the SPSS Interface

Before diving into analysis, it’s important to understand the SPSS interface. Key components include:

  • Data View: Where raw data is displayed in spreadsheet format.
  • Variable View: Where you define properties like variable names, types, labels, and measurement scales.
  • Output Viewer: Displays the results of statistical analyses.
  • Syntax Editor: For users who prefer command-based data manipulation.

Familiarity with these areas can greatly enhance your efficiency and accuracy.


Importing and Managing Data in SPSS

SPSS allows users to import data from multiple sources:

  • Excel spreadsheets (.xls, .xlsx)
  • CSV files (.csv)
  • Text files (.txt)
  • SQL databases

To import data:

  1. Go to File > Open > Data.
  2. Select your file format.
  3. Adjust variable types and labels in Variable View.

Once your data is imported, you can use sorting, filtering, and recoding functions to manage it.


Data Cleaning and Preparation in SPSS

Before running analyses, data must be cleaned and prepared:

  • Identify and handle missing values.
  • Remove duplicates.
  • Ensure consistency in variable types.
  • Create new variables using transformations.

Clean data leads to more accurate and trustworthy results.


Descriptive Statistics in SPSS

Descriptive statistics summarize your data and provide key insights. Common techniques include:

  • Mean, median, and mode
  • Standard deviation and variance
  • Frequency distributions
  • Cross-tabulations

To access these:

  • Go to Analyze > Descriptive Statistics

These tools are essential for getting a clear overview of your dataset.


Choosing the Right Statistical Test

SPSS offers a wide range of statistical tests. Choosing the right one depends on:

  • Type of data (nominal, ordinal, interval, ratio)
  • Number of groups being compared
  • Research hypothesis

Common tests include:

  • T-tests: Compare means between two groups.
  • ANOVA: Compare means among three or more groups.
  • Chi-square tests: Assess relationships between categorical variables.
  • Correlation and regression: Explore relationships between continuous variables.

Understanding the Basics of SPSS

Interpreting SPSS Output

SPSS outputs are detailed but can be overwhelming. Key things to look for:

  • P-values: Indicate statistical significance (commonly < 0.05).
  • Confidence intervals: Show the range within which the true value lies.
  • Effect size: Measures the strength of a relationship.
  • Tables and charts: Visual representations help explain the data.

Understanding how to read output tables is essential for reporting results.


Creating Professional Reports in SPSS

SPSS makes it easy to create polished, exportable reports:

  • Tables: Use pivot tables and format them for clarity.
  • Graphs: Bar charts, histograms, scatterplots, and more.
  • Exporting: Output can be exported to Word, PDF, or Excel.
  • APA style: Reports can be formatted to meet academic standards.

Professional reporting ensures your analysis is both credible and presentable.


Understanding the Basics of SPSS

Common Challenges and Troubleshooting

While SPSS is user-friendly, beginners often face challenges:

  • Missing or incorrect variable labels
  • Incorrect measurement scales
  • Unexpected null results
  • Output that’s difficult to interpret

To troubleshoot:

  • Check variable types and formats.
  • Consult SPSS forums or IBM documentation.
  • Use the Syntax Editor for more control.
  • Work with a sample dataset to practice before using your own data.

Conclusion

Understanding the basics of SPSS is a critical step toward becoming proficient in data analysis. From importing data to interpreting complex outputs, SPSS offers a streamlined solution for researchers and analysts. With its user-friendly interface and powerful statistical tools, SPSS remains a top choice for those looking to conduct meaningful and accurate data analysis.

Whether you are a student working on your thesis or a professional preparing market research, SPSS can save you time and improve the quality of your insights. Use this guide as a foundation, and continue exploring the many features and techniques SPSS has to offer.

Needs help with similar assignment?

We are available 24x7 to deliver the best services and assignment ready within 3-4 hours? Order a custom-written, plagiarism-free paper

Get Answer Over WhatsApp Order Paper Now

Understanding the SPSS Interface|2025

Understanding the SPSS Interface is the first step to mastering data analysis. This guide offers a clear overview of menus, tools, and layout, helping beginners navigate SPSS efficiently and confidently. Perfect for students and professionals looking to build a strong foundation in statistical software use.

Understanding the SPSS Interface: A Comprehensive Guide

IBM SPSS Statistics is a powerful software suite widely used for statistical analysis in social science, market research, health sciences, and various other fields. Its user-friendly interface allows both novice and experienced users to perform complex data analyses with relative ease. Understanding the SPSS interface is crucial for effective data management and analysis. This guide provides an in-depth exploration of the SPSS interface, focusing on its key components and functionalities.Data For Development+2Wikipedia+2Vskills+2

Understanding the SPSS Interface

Overview of the SPSS Interface

Upon launching SPSS, users are greeted with a well-organized interface designed to streamline data analysis tasks. The main components of the interface include:

  • Menu Bar: Located at the top, it provides access to various functions such as file operations, data handling, analysis tools, and more.

  • Toolbar: Situated below the menu bar, it offers quick access to frequently used tools and commands.mindmajix

  • Data Editor: The central workspace where data is entered, viewed, and edited.

  • Output Viewer: Displays the results of analyses, including tables, charts, and statistical outputs.

  • Syntax Editor: Allows users to write and execute commands using SPSS syntax for advanced operations.

  • Pivot Table Editor: Enables customization and formatting of tables generated in the Output Viewer.Vskills+4Social Science Computing Cooperative+4Academia+4

  • Chart Editor: Facilitates the creation and modification of graphical representations of data.

The Data Editor Window

The Data Editor is the primary workspace in SPSS, where users input and manipulate data. It comprises two main views:UniSA Login+2Vskills+2users.ssc.wisc.edu+2UniSA Login+1Wikipedia+1

Data View

In the Data View, data is displayed in a spreadsheet format:Kent State University Libraries+2Wikipedia+2Vskills+2

Each cell in the Data View represents a data point for a specific case and variable. Users can enter, edit, and navigate through data efficiently in this view.Vskills+3Social Science Statistics+3Wikipedia+3

Variable View

The Variable View provides metadata about the dataset:

  • Name: The identifier for each variable.

  • Type: Specifies the data type (e.g., numeric, string).

  • Width: Determines the number of characters for string variables.

  • Decimals: Sets the number of decimal places for numeric variables.

  • Label: A descriptive label for the variable.

  • Values: Defines value labels for categorical variables.studylib.net

  • Missing: Identifies missing data codes.Berkeley iSchool Courses

  • Columns: Adjusts the width of the variable column in the Data View.

  • Align: Sets the alignment of variable values.

  • Measure: Indicates the level of measurement (Nominal, Ordinal, Scale).Studeersnel+1Berkeley iSchool Courses+1

This view is essential for defining and managing the structure of the dataset.

Understanding the SPSS Interface

The Output Viewer

The Output Viewer displays the results of analyses performed in SPSS. It consists of two main sections:Social Science Computing Cooperative+2Vskills+2users.ssc.wisc.edu+2Social Science Computing Cooperative+1Vskills+1

  • Outline Pane: Provides a hierarchical view of the output, allowing users to navigate through different sections easily.

  • Display Pane: Shows the actual output, including tables, charts, and statistical results.

Users can interact with the output by double-clicking objects to edit them, rearranging items, or exporting results for reporting purposes.

The Syntax Editor

For advanced users, the Syntax Editor offers a command-line interface to write and execute SPSS syntax. Syntax allows for:UniSA Login

  • Reproducibility: Ensures analyses can be repeated with the same commands.

  • Automation: Facilitates the automation of repetitive tasks.

  • Complex Operations: Enables the execution of complex data manipulations and analyses not accessible through the graphical interface.Wikipedia

The Syntax Editor is particularly useful for handling large datasets and performing batch processing.

The Pivot Table Editor

The Pivot Table Editor allows users to customize the appearance and layout of tables generated in the Output Viewer:Vskills+1Academia+1

  • Rearranging Rows and Columns: Users can drag and drop elements to reorganize the table structure.

  • Formatting: Adjusts fonts, colors, and styles to enhance readability.

  • Summarizing Data: Applies summary statistics to data within the table.

This editor is essential for preparing tables for presentation or publication.

The Chart Editor

The Chart Editor provides tools to create and modify graphical representations of data:

  • Chart Types: Users can select from various chart types, including bar charts, histograms, pie charts, and scatterplots.

  • Customization: Adjusts elements such as titles, axis labels, legends, and colors.

  • Data Series: Modifies the data series displayed in the chart.

Effective use of the Chart Editor enhances the visual appeal and clarity of data presentations.

Understanding the SPSS Interface

Working with Data in SPSS (continued)

Importing and Exporting Data

SPSS supports various data formats, making it versatile for different research needs:

  • Import Options:

    • Excel files (.xls, .xlsx)

    • CSV (.csv)

    • Text files (.txt, .dat)

    • SAS, STATA, and other statistical formats

    • Database connections (e.g., SQL)

When importing, SPSS provides a preview pane and field-mapping options to ensure variables align correctly.

  • Export Options:

    • Exporting results to Excel, PDF, or Word

    • Saving datasets in different formats for use in other tools

This interoperability is crucial for collaboration and integrating SPSS into broader workflows.

Data Cleaning and Preparation

Data cleaning is a fundamental task before any analysis. SPSS offers tools to:

  • Identify missing values

  • Recode variables

  • Compute new variables

  • Sort and filter data

  • Detect outliers

These features are accessible through both menus and syntax, offering flexibility depending on user preference.

Data Transformation

SPSS simplifies data transformation through:

  • Recode into Same or Different Variables

  • Compute Variable for creating new fields using mathematical expressions

  • Rank Cases, Aggregate, and Split Files for grouped analyses

Such features are especially helpful when dealing with large or complex datasets.


Running Analyses in SPSS

SPSS’s analytical tools are its core strength. Users can perform a wide range of statistical analyses:

Descriptive Statistics

This includes:

  • Frequencies

  • Descriptive (mean, standard deviation)

  • Explore

  • Crosstabs

Useful for getting an overview of your data.

Inferential Statistics

SPSS supports:

  • T-tests (one-sample, paired, independent)

  • ANOVA (one-way, two-way)

  • Chi-square tests

  • Correlation (Pearson, Spearman)

  • Regression (linear, logistic)

Each analysis opens a dialog box with intuitive prompts for selecting dependent and independent variables.

Nonparametric Tests

Ideal when data doesn’t meet parametric assumptions, SPSS offers:

  • Mann-Whitney U

  • Kruskal-Wallis

  • Wilcoxon Signed-Rank

  • Friedman Test

These are accessible via the “Nonparametric Tests” menu.

Advanced Statistics

SPSS also includes modules for:

  • Factor Analysis

  • Cluster Analysis

  • Discriminant Analysis

  • Multivariate Analysis (MANOVA)

These features are essential for deeper, multivariate interpretations and modeling.


Understanding the SPSS Interface

Challenges in Understanding the SPSS Interface

Despite its power and versatility, many users—especially beginners—face challenges when navigating SPSS.

Steep Learning Curve

While SPSS is GUI-driven, its complexity can overwhelm new users. The sheer number of menus and options makes it easy to get lost.

  • Confusion between Data View and Variable View

  • Difficulty interpreting Output Viewer

  • Limited familiarity with statistical concepts required to choose the right analysis

Syntax Versus GUI

New users tend to rely heavily on the GUI, avoiding syntax due to its perceived complexity. However:

  • Some advanced operations are only available through syntax.

  • Users who avoid learning syntax may struggle to automate processes or replicate analyses.

Encouraging a gradual introduction to syntax can help bridge this gap.

Output Management

The Output Viewer can quickly become cluttered, making it difficult to interpret or organize results.

  • Users may not understand how to edit or format pivot tables.

  • Exporting and copying results into reports can be non-intuitive at first.

Chart and Table Customization

Although customization is possible via the Chart and Pivot Table Editors, the process can be tedious and confusing without practice.

  • Too many formatting options without clear guidance

  • Limited defaults for professional-quality output

Software Limitations and Bugs

At times, SPSS may crash during large analyses, particularly with older machines or extensive syntax files. Other usability concerns include:

  • Lack of real-time collaboration features

  • No autosave for syntax or outputs

  • Clunky integration with modern platforms (e.g., cloud storage)


Strategies to Overcome Interface Challenges

Structured Learning

Investing time in a structured SPSS course—either self-paced online or instructor-led—can significantly reduce the learning curve. Good courses cover:

  • Basic interface navigation

  • Data management

  • Fundamental and advanced statistical procedures

  • Syntax writing

Practice with Real Datasets

Using sample datasets allows users to get hands-on experience without worrying about “breaking” anything. SPSS includes built-in examples such as:

  • demo.sav

  • employee data

  • market research surveys

These can be accessed via File > Open > Data > Samples Folder.

Tutorials and Documentation

IBM provides extensive documentation and user manuals. Additionally, online communities, forums, and YouTube channels offer free tutorials on:

  • Data entry

  • Common analyses

  • Output interpretation

  • Chart editing

Combine GUI and Syntax

Using the GUI to generate syntax (by selecting Paste instead of OK) is a good way to learn SPSS commands gradually. This hybrid approach lets users:

  • Understand the logic behind commands

  • Edit commands for reuse

  • Build confidence to write syntax from scratch

Customize Environment

Users can make the SPSS interface easier to navigate by:

  • Customizing toolbars

  • Setting default directories for file saving

  • Using templates for charts and tables

These small adjustments help streamline workflows.


Best Practices for Efficient SPSS Use

Save Often and Organize Files

SPSS doesn’t autosave syntax or output files. Always:

  • Save your syntax frequently

  • Keep datasets, syntax files, and outputs in organized folders

  • Name variables and files clearly

Use Syntax Logs

Maintain a log of all syntax used during a project. This provides:

  • A clear trail for reproducibility

  • An easy way to troubleshoot errors

Validate Data Before Analysis

Always:

  • Check for missing data

  • Verify variable types and labels

  • Use Descriptives to ensure values are in expected ranges

Document Your Work

Use the COMMENT command in syntax or include comments in output reports to explain decisions and methods.


Understanding the SPSS Interface

The Future of SPSS and User Interface Improvements

As statistical software evolves, IBM continues to update SPSS to improve usability. Recent updates include:

  • Enhanced chart builder

  • Improved syntax editor with syntax highlighting

  • Better integration with R and Python

Still, many users advocate for:

  • A modernized interface

  • Real-time collaboration tools

  • More intuitive customization options

Open-source competitors like RStudio and Jamovi continue to attract users due to their flexibility and user-friendly design.


Conclusion

Understanding the SPSS interface is essential for harnessing its powerful statistical tools. While its layout and menu-driven structure are designed for accessibility, they still pose significant challenges, especially for beginners. Navigating the Data Editor, Output Viewer, Syntax Editor, and customization tools takes time and practice.

To overcome these challenges, users should blend structured learning with hands-on experimentation, gradually incorporating syntax into their workflow. By investing in understanding SPSS’s interface and capabilities, researchers and analysts can unlock its full potential and conduct more accurate, efficient, and reproducible analyses.

Needs help with similar assignment?

We are available 24x7 to deliver the best services and assignment ready within 3-4 hours? Order a custom-written, plagiarism-free paper

Get Answer Over WhatsApp Order Paper Now

Creating Professional Reports in SPSS|2025

Creating Professional Reports in SPSS can be challenging without the right tools and techniques. Learn how to streamline your reporting process and present statistical findings with clarity and precision.

Introduction

Statistical Package for the Social Sciences (SPSS) is widely used for statistical analysis across various domains, including academia, healthcare, social sciences, and business. While its analytical capabilities are robust, users often encounter challenges when tasked with creating professional and presentable reports directly from SPSS. This article examines the typical hurdles faced during report creation in SPSS and suggests practical solutions and best practices.

Importance of Professional Reporting in SPSS

Professional reports are essential in conveying the results of statistical analysis to stakeholders, clients, or academic audiences. These reports must be accurate, clearly structured, visually appealing, and easy to interpret. SPSS allows users to generate outputs such as tables, graphs, and descriptive statistics, but transforming these outputs into coherent reports that meet professional standards remains a complex task.

Creating Professional Reports in SPSS

Features of SPSS Report Generation

SPSS includes features that support report creation:

  • Output Viewer: Displays results of analyses
  • Chart Builder: Creates custom visualizations
  • Table Editor: Allows some formatting of output tables
  • Export Options: Allows exporting to Word, Excel, PDF, and other formats
  • Syntax Editor: Enables automation and customization of analysis and output

Despite these tools, the report creation process is often cumbersome and requires supplementary tools to achieve desired professionalism.

Common Challenges in Creating Reports in SPSS

4.1. Interface Limitations SPSS’s Output Viewer has limited flexibility in editing and formatting content. Aligning tables, adjusting font sizes, or modifying colors often require exporting to a word processor.

4.2. Customization Constraints Customization of charts and tables is minimal. For instance, editing axis titles, legends, or color schemes in graphs can be unintuitive and time-consuming.

4.3. Output Management and Formatting Issues The output generated is not always organized or user-friendly. Reports can become lengthy, with irrelevant outputs cluttering the view. Organizing output sections for different parts of the analysis is not straightforward.

4.4. Integration with Other Software While SPSS allows exporting to MS Word and Excel, formatting does not always transfer well. Users often need to reformat content manually, consuming valuable time.

4.5. Interpretation Difficulties Non-statistical stakeholders may find SPSS outputs difficult to interpret due to technical jargon or lack of explanation within tables and charts.

4.6. Data Visualization Limitations The visual appeal of SPSS-generated charts is limited compared to modern visualization tools. Creating publication-quality charts within SPSS alone is a challenge.

4.7. Handling Large Datasets Reports involving large datasets can overwhelm SPSS, causing lag or crashes. Output viewers may freeze or crash, complicating report compilation.

4.8. Exporting Challenges Exporting complex outputs with consistent formatting is a challenge. Images and tables often lose alignment, and pagination issues arise when printing or saving to PDF.

4.9. Version Compatibility Different versions of SPSS may have slight differences in output formatting, which can lead to inconsistencies when collaborating with others using different versions.

4.10. Learning Curve Beginners find it challenging to create structured and visually appealing reports. SPSS documentation lacks depth in guiding users on report creation.

Creating Professional Reports in SPSS

Best Practices for Creating Professional Reports in SPSS

  • Use SPSS syntax to automate repetitive analysis and organize outputs
  • Suppress unnecessary output to reduce clutter
  • Label variables and values clearly before analysis
  • Apply consistent formatting within the Table Editor
  • Use Chart Editor to improve chart readability
  • Export only the necessary output and compile reports in Word or PowerPoint
  • Include narrative explanations alongside tables and charts

Enhancing Reports with External Tools

Professional-grade reports often require supplementing SPSS outputs with:

  • Microsoft Word: For document formatting and textual explanations
  • Excel: For refining tables or creating additional charts
  • PowerPoint: For presenting reports to audiences
  • Visualization tools: Such as Tableau or Power BI for better graphics

Using these tools, users can combine SPSS output with explanatory text, annotations, and custom visuals to enhance report professionalism.

Case Study Example

Scenario: A market research analyst needs to present customer satisfaction survey results.

Challenges:

  • Raw SPSS output included numerous irrelevant statistics
  • Charts were unappealing and difficult to interpret
  • Report needed to be presented to non-technical stakeholders

Solutions:

  • Analyst used syntax to limit output to relevant tests
  • Exported tables to Word and reformatted with styles and captions
  • Recreated graphs in Excel with clearer visuals
  • Added commentary to explain findings in layman terms

Outcome:

  • The final report was concise, visually engaging, and easy to interpret, meeting client expectations.

Creating Professional Reports in SPSS

Conclusion

Creating professional reports in SPSS is often challenging due to interface limitations, formatting issues, and restricted customization. However, with structured approaches, use of syntax, and integration with external tools, users can overcome these challenges. Continuous learning and adopting best practices in report preparation are key to making SPSS reports not only statistically sound but also professionally presentable.

Needs help with similar assignment?

We are available 24x7 to deliver the best services and assignment ready within 3-4 hours? Order a custom-written, plagiarism-free paper

Get Answer Over WhatsApp Order Paper Now

Interpreting SPSS Output|2025

Interpreting SPSS Output is essential for making accurate data-driven decisions. This guide helps you understand statistical results, charts, and tables generated by SPSS with clarity and confidence.

Interpreting SPSS Output: A Comprehensive Guide to Understanding Statistical Results

Statistical analysis is a cornerstone of empirical research, and IBM SPSS (Statistical Package for the Social Sciences) is one of the most widely used tools for performing such analyses. However, generating output is only half the battle—interpreting it correctly is equally crucial. Misinterpretation can lead to incorrect conclusions, undermining the validity of research findings.

This guide provides a step-by-step approach to interpreting SPSS output for common statistical tests, including:

  • Descriptive Statistics

  • T-tests (Independent and Paired Samples)

  • ANOVA (One-Way and Repeated Measures)

  • Correlation (Pearson and Spearman)

  • Regression (Linear and Logistic)

  • Chi-Square Test of Independence

By the end of this article, you will be able to confidently read, analyze, and report SPSS results in your research.


Interpreting SPSS Output

Understanding the Structure of SPSS Output

SPSS generates output in two main forms:

  1. Tables (Numerical results, e.g., means, p-values, effect sizes)

  2. Charts/Graphs (Visual representations, e.g., histograms, scatterplots)

The Output Viewer organizes results in a hierarchical manner, with each analysis producing multiple tables and graphs.

Key Sections in SPSS Output

  • Descriptive Statistics (Mean, SD, N)

  • Test Statistics (T, F, χ²)

  • P-values (Sig.)

  • Effect Sizes (Cohen’s d, η², R²)

  • Post-Hoc Tests (If applicable)


Interpreting Descriptive Statistics

Before running inferential tests, always examine descriptive statistics to understand data distribution.

Example: Descriptives Table

N Mean Std. Deviation
Group A 30 75.2 10.5
Group B 30 68.4 9.8

Interpretation:

  • N: Sample size per group (30 each).

  • Mean: Group A (75.2) scored higher than Group B (68.4).

  • Std. Deviation: Variability is similar (~10), suggesting comparable spread.

Next Step: Check for normality (Shapiro-Wilk, Q-Q plots) before running parametric tests.


Interpreting SPSS Output

Interpreting T-Tests

Independent Samples T-Test

When to Use: Comparing means between two unrelated groups (e.g., male vs. female scores).

Key Tables in Output:

  1. Group Statistics (Means, SDs)

  2. Levene’s Test for Equality of Variances

  3. T-Test Results

Example Output:
Levene’s Test:

  • *F = 0.85, p = 0.36*
    Interpretation:

  • If p > 0.05, assume equal variances (use the first row).

  • If p ≤ 0.05, assume unequal variances (use the second row).

T-Test Results:

t df Sig. (2-tailed) Mean Difference
Equal variances assumed 2.45 58 0.017 6.8

Interpretation:

  • t(58) = 2.45, p = 0.017

  • Since p < 0.05, the difference is statistically significant.

  • Mean Difference = 6.8 (Group A scored 6.8 points higher than Group B).

Reporting:
*”An independent-samples t-test revealed a statistically significant difference between Group A (M = 75.2, SD = 10.5) and Group B (M = 68.4, SD = 9.8), t(58) = 2.45, p = .017, with a mean difference of 6.8 points.”*


Paired Samples T-Test

When to Use: Comparing means of the same group at two time points (e.g., pre-test vs. post-test).

Example Output:

Mean N Std. Deviation t df Sig. (2-tailed)
Post – Pre 5.2 30 3.1 4.12 29 0.001

Interpretation:

  • t(29) = 4.12, p = 0.001

  • Significant improvement from pre-test to post-test (mean increase = 5.2).

Reporting:
*”A paired-samples t-test showed a significant increase in scores from pre-test (M = 65.0, SD = 8.2) to post-test (M = 70.2, SD = 7.5), t(29) = 4.12, p = .001.”*


Interpreting SPSS Output

Interpreting ANOVA

One-Way ANOVA

When to Use: Comparing means across three or more independent groups.

Key Tables in Output:

  1. Descriptive Statistics

  2. ANOVA Table (F-test)

  3. Post-Hoc Tests (Tukey, Bonferroni)

Example Output:
ANOVA Table:

Source SS df MS F Sig.
Between Groups 120.5 2 60.25 5.67 0.006
Within Groups 478.3 57 8.39

Interpretation:

  • F(2, 57) = 5.67, p = 0.006 → Significant difference exists.

  • Post-Hoc Tests Needed (to identify which groups differ).

Tukey’s HSD Output:

(I) Group (J) Group Mean Difference (I-J) Sig.
A B 4.3* 0.02
A C 1.2 0.45
B C -3.1* 0.04

Interpretation:

  • A vs. B (p = 0.02) and B vs. C (p = 0.04) are significant.

  • A vs. C (p = 0.45) is not significant.

Reporting:
*”A one-way ANOVA revealed a significant difference between groups, F(2, 57) = 5.67, p = .006. Post-hoc Tukey tests indicated that Group A (M = 78.3, SD = 9.1) scored significantly higher than Group B (M = 74.0, SD = 8.7), p = .02, and Group B scored lower than Group C (M = 77.1, SD = 10.2), p = .04.”*


Interpreting Correlation

Pearson’s r

When to Use: Examining the linear relationship between two continuous variables.

Example Output:

Age Income
Age 1 0.65**
Income 0.65** 1

Interpretation:

  • r = 0.65, p < 0.01 → Strong positive correlation.

  • As Age increases, Income tends to increase.

Reporting:
*”A Pearson correlation revealed a strong positive relationship between Age and Income, r = .65, p < .01.”*


Interpreting SPSS Output

Interpreting Regression

Linear Regression

When to Use: Predicting a continuous outcome from one or more predictors.

Key Tables:

  1. Model Summary (R²)

  2. ANOVA (F-test for model significance)

  3. Coefficients (Beta weights, p-values)

Example Output:
Model Summary:

  • *R² = 0.42* → 42% of variance in Salary is explained by Experience.

ANOVA:

  • *F(1, 48) = 34.7, p < 0.001* → Model is significant.

Coefficients:

B Std. Error Beta t Sig.
(Constant) 30,000 2,100 14.3 0.000
Experience 2,500 420 0.65 5.89 0.000

Interpretation:

  • Experience (β = 0.65, p < 0.001) is a significant predictor.

  • For each additional year of Experience, Salary increases by $2,500.

Reporting:
*”A linear regression indicated that Experience significantly predicted Salary, β = .65, t(48) = 5.89, p < .001, accounting for 42% of the variance (R² = .42).”*


Common Pitfalls in Interpreting SPSS Output

  1. Ignoring Assumptions (Normality, Homogeneity of Variance)

  2. Misreading p-values (p < 0.05 = Significant)

  3. Overlooking Effect Sizes (Statistical vs. Practical Significance)

  4. Misinterpreting Correlation as Causation


Interpreting SPSS Output

Conclusion

Interpreting SPSS output correctly is essential for drawing valid conclusions. By following structured guidelines—examining descriptives, checking test assumptions, and accurately reporting statistics—researchers can ensure their findings are robust and reliable.

Key Takeaways:
✔ Always check descriptive statistics first.
✔ Verify test assumptions (normality, homogeneity).
✔ Report p-values, effect sizes, and confidence intervals.
✔ Use post-hoc tests when ANOVA is significant.

By mastering SPSS output interpretation, researchers enhance their analytical credibility and contribute meaningful insights to their fields.

Needs help with similar assignment?

We are available 24x7 to deliver the best services and assignment ready within 3-4 hours? Order a custom-written, plagiarism-free paper

Get Answer Over WhatsApp Order Paper Now

Choosing the Right Statistical Test|2025

Choosing the Right Statistical Test is crucial for accurate data analysis in SPSS. This guide simplifies the selection process based on your research question, data type, and study design, helping you make informed decisions and ensure valid, reliable results in academic or professional statistical projects.

Choosing the Right Statistical Test: A Comprehensive Guide Using SPSS

Statistical analysis is a crucial component of research across various disciplines, including psychology, medicine, business, and social sciences. Selecting the appropriate statistical test ensures accurate data interpretation and valid conclusions. However, the challenge lies in determining which test is suitable for a given dataset and research question.

SPSS (Statistical Package for the Social Sciences) is a powerful software tool that facilitates statistical analysis. However, without a proper understanding of test selection, researchers may draw incorrect inferences. This article explores the key considerations in choosing the right statistical test and demonstrates how to apply these tests in SPSS.


Choosing the Right Statistical Test

Understanding the Basics: Types of Data and Research Questions

Before selecting a statistical test, researchers must understand:

  • Types of Variables (Independent vs. Dependent, Categorical vs. Continuous)

  • Research Design (Experimental, Observational, Correlational)

  • Hypothesis Type (Null vs. Alternative, One-tailed vs. Two-tailed)

Types of Variables

  • Categorical (Nominal/Ordinal): Gender, Education Level, Marital Status

  • Continuous (Interval/Ratio): Age, Income, Test Scores

Research Questions

  • Descriptive: Summarizing data (Mean, Median, Mode)

  • Comparative: Comparing groups (T-tests, ANOVA)

  • Relational: Examining associations (Correlation, Regression)

  • Predictive: Forecasting outcomes (Linear Regression, Logistic Regression)


Key Considerations in Selecting a Statistical Test

Several factors influence the choice of a statistical test:

Number of Variables

  • Univariate Analysis: Single variable (Descriptive Stats)

  • Bivariate Analysis: Two variables (Correlation, Chi-Square)

  • Multivariate Analysis: Multiple variables (MANOVA, Multiple Regression)

Nature of Data

  • Parametric Tests: Assume normality, interval/ratio data (T-test, ANOVA, Pearson’s r)

  • Non-Parametric Tests: No normality assumption, ordinal/nominal data (Mann-Whitney U, Kruskal-Wallis, Spearman’s rho)

Number of Groups

  • Two Groups: Independent T-test, Paired T-test, Mann-Whitney U

  • Three or More Groups: ANOVA, Kruskal-Wallis

Relationship vs. Difference Testing

  • Testing Differences: T-tests, ANOVA

  • Testing Relationships: Correlation, Regression


Choosing the Right Statistical Test

Common Statistical Tests and Their Applications in SPSS

Below is a guide to selecting the right test based on research design and data type.

Comparing Means (Parametric Tests)

Scenario Statistical Test SPSS Procedure
Compare two independent groups Independent Samples T-test Analyze → Compare Means → Independent-Samples T-Test
Compare two related groups Paired Samples T-test Analyze → Compare Means → Paired-Samples T-Test
Compare three+ independent groups One-Way ANOVA Analyze → Compare Means → One-Way ANOVA
Compare three+ related groups Repeated Measures ANOVA Analyze → General Linear Model → Repeated Measures

Non-Parametric Alternatives

Scenario Statistical Test SPSS Procedure
Compare two independent groups Mann-Whitney U Test Analyze → Nonparametric Tests → Independent Samples
Compare two related groups Wilcoxon Signed-Rank Test Analyze → Nonparametric Tests → Related Samples
Compare three+ independent groups Kruskal-Wallis Test Analyze → Nonparametric Tests → Independent Samples
Compare three+ related groups Friedman Test Analyze → Nonparametric Tests → Related Samples

Testing Relationships

Scenario Statistical Test SPSS Procedure
Association between two continuous variables Pearson’s r Analyze → Correlate → Bivariate
Association between two ordinal variables Spearman’s rho Analyze → Correlate → Bivariate (Check Spearman)
Association between categorical variables Chi-Square Test Analyze → Descriptive Stats → Crosstabs

Predictive Modeling

Scenario Statistical Test SPSS Procedure
Predict a continuous outcome Linear Regression Analyze → Regression → Linear
Predict a categorical outcome Logistic Regression Analyze → Regression → Binary Logistic

Step-by-Step SPSS Guide for Common Tests

Independent Samples T-test (Comparing Two Groups)

  1. Click: Analyze → Compare Means → Independent-Samples T-Test

  2. Select the continuous dependent variable (e.g., Test Scores).

  3. Define Groups (e.g., Group 1: Male, Group 2: Female).

  4. Interpret: Check the p-value (if p < 0.05, groups differ significantly).

One-Way ANOVA (Comparing Three+ Groups)

  1. Click: Analyze → Compare Means → One-Way ANOVA

  2. Select the dependent variable (e.g., Sales Performance).

  3. Select the categorical independent variable (e.g., Marketing Strategy).

  4. Interpret: If p < 0.05, conduct Post-Hoc tests (Tukey) to identify differing groups.

Pearson’s Correlation (Testing Relationships)

  1. Click: Analyze → Correlate → Bivariate

  2. Select two continuous variables (e.g., Age and Income).

  3. Check Pearson and click OK.

  4. Interpret: Correlation coefficient (r) ranges from -1 to +1.

Chi-Square Test (Categorical Association)

  1. Click: Analyze → Descriptive Statistics → Crosstabs

  2. Select two categorical variables (e.g., Smoking Status and Lung Disease).

  3. Check Chi-Square under Statistics.

  4. Interpret: If p < 0.05, variables are associated.


Choosing the Right Statistical Test

Common Mistakes and How to Avoid Them

  • Using Parametric Tests on Non-Normal Data: Always check normality (Shapiro-Wilk, Q-Q plots).

  • Ignoring Assumptions: Homogeneity of variance (Levene’s Test), multicollinearity in regression.

  • Misinterpreting p-values: p < 0.05 indicates significance, but effect size matters (Cohen’s d, Eta-squared).

  • Overlooking Post-Hoc Tests: In ANOVA, always run Tukey or Bonferroni corrections.


Conclusion

Choosing the right statistical test is critical for valid research findings. By understanding data types, research questions, and test assumptions, researchers can make informed decisions. SPSS simplifies the execution of these tests, but proper selection and interpretation remain the researcher’s responsibility.

Following this structured approach ensures robust statistical analysis, leading to credible and impactful research outcomes.


Needs help with similar assignment?

We are available 24x7 to deliver the best services and assignment ready within 3-4 hours? Order a custom-written, plagiarism-free paper

Get Answer Over WhatsApp Order Paper Now

Data Cleaning and Preparation Challenges in SPSS|2025

Data Cleaning and Preparation Challenges in SPSS can impact the accuracy and reliability of your analysis. This guide explores common issues like missing values, data entry errors, and variable inconsistencies, offering practical solutions to streamline your workflow and ensure clean, well-structured datasets for effective statistical analysis.

Introduction

Data analysis begins with data collection, but its reliability and accuracy hinge on how well the data is cleaned and prepared. Before any statistical procedure can be conducted, it is critical to ensure that the data used is accurate, complete, and properly formatted. In this article, we explore the challenges researchers and data analysts face during data cleaning and preparation in SPSS (Statistical Package for the Social Sciences), and how to overcome them.

Importance of Data Cleaning and Preparation

The validity of statistical analysis largely depends on the quality of input data. Dirty or unprepared data can lead to incorrect conclusions, misleading statistical significance, or skewed descriptive statistics. Data cleaning and preparation are vital for:

  • Enhancing data integrity

  • Minimizing errors in analysis

  • Making datasets analysis-ready

  • Saving time in long-term data processing

Data preparation sets the foundation for credible findings, especially in fields like healthcare, social sciences, business intelligence, and market research.


Overview of SPSS in Data Management

SPSS is a widely-used statistical software suite developed by IBM. Known for its user-friendly interface and advanced statistical capabilities, SPSS is popular in academic, government, and corporate sectors. SPSS allows for a seamless transition from raw data to insightful analysis, provided the data is clean and well-prepared.

The SPSS Data Editor is split into two views: Data View and Variable View. The former allows users to see and manipulate raw data, while the latter provides metadata management such as variable names, labels, types, and measurement levels.


Data Cleaning and Preparation Challenges in SPSS

Common Data Cleaning and Preparation Challenges in SPSS

Inconsistent Data Formats

Data can be entered in multiple formats, especially when derived from different sources. For example, dates might appear as “01/01/2023”, “2023-01-01”, or “Jan 1, 2023”. SPSS requires consistent formatting for analysis; otherwise, errors or misinterpretations can occur.

Missing Data

Missing values are a pervasive problem in real-world datasets. SPSS recognizes blank entries or user-defined missing values but handling them appropriately is not always straightforward. Unmanaged missing data can bias results or reduce statistical power.

Duplicate Entries

Duplicated responses in survey data or observational studies inflate sample sizes and can lead to erroneous statistical interpretations. Identifying and removing duplicates manually is time-consuming and error-prone.

Outliers and Anomalies

Outliers can distort means, inflate standard deviations, and skew regression models. In SPSS, identifying outliers requires multiple steps, such as visualizations (boxplots, scatterplots) and descriptive statistics, which can be overlooked by novice users.

Data Entry Errors

Mistyped numbers, misplaced decimal points, or incorrect categorical codes compromise data quality. SPSS does not automatically validate such errors unless stringent checks are applied.

Variable Naming and Labeling Issues

Poor variable names (e.g., “var1”, “Q5”, “xyz”) reduce data interpretability. Without clear labels, future users may struggle to understand the data context or content.

Inadequate Documentation

Without proper documentation, users may be unsure what a particular value or variable represents, especially in collaborative research. This can hinder data interpretation or replication.

Data Transformation Confusion

Many analyses require transforming data—e.g., computing z-scores, logarithmic transformations, or recoding values. Mistakes during these steps can lead to inaccurate model inputs.

Incorrect Variable Types

SPSS distinguishes between numeric, string, date, and other types. Assigning the wrong type can make data unusable for analysis (e.g., treating “age” as a string rather than numeric).

Scale and Measurement Level Problems

SPSS needs users to define whether variables are nominal, ordinal, scale, or interval. Incorrect classification can limit available statistical procedures and affect the interpretation of results.


Data Cleaning and Preparation Challenges in SPSS

Step-by-Step Data Cleaning Process in SPSS

  1. Import Data
    Import data from Excel, CSV, or database files into SPSS.

  2. Inspect Data
    Use Data View and Variable View to spot inconsistencies, anomalies, or mislabeling.

  3. Check for Missing Values
    Use Frequencies, Descriptives, or Explore to examine missing data.

  4. Remove Duplicates
    Use Identify Duplicate Cases under Data to detect repeated entries.

  5. Recode Variables
    Use Transform > Recode into Same/Different Variables to standardize categories.

  6. Create New Variables
    Use Compute Variable to transform or create new columns for analysis.

  7. Detect Outliers
    Utilize boxplots, Z-scores, or the Explore function to identify extreme values.

  8. Assign Correct Measurement Levels
    Check and correct scale levels in Variable View.

  9. Label Variables and Values
    Properly label variables and assign value labels for easier interpretation.

  10. Save a Cleaned Version
    Use File > Save As to create a separate, clean data file for analysis.


Tools and Features in SPSS for Data Cleaning

  • Frequencies and Descriptives: Helps identify missing data, outliers, or distribution anomalies.

  • Explore: Offers detailed descriptive stats and boxplots for outlier detection.

  • Compute Variable: Useful for creating calculated columns.

  • Recode: Reclassifies variables for standardization.

  • Split File: Helps analyze data subsets by grouping variables.

  • Select Cases: Allows users to analyze specific segments of the dataset.

  • Sort Cases: Organizes data for easier manual review and batch operations.

  • Data Validation Rules: A powerful but underused tool to set criteria for valid data entries.


Data Cleaning and Preparation Challenges in SPSS

Best Practices in Data Preparation

  • Document Every Step: Keep records of cleaning decisions, including recoding and variable renaming.

  • Use Versioning: Always maintain raw data and work on a copy to avoid irreversible mistakes.

  • Set Consistent Naming Conventions: Use clear, concise, and informative variable names.

  • Conduct Preliminary Analysis: Run frequencies and cross-tabulations to detect anomalies early.

  • Educate Team Members: Ensure everyone understands SPSS measurement levels and formatting requirements.

  • Develop a Cleaning Checklist: Ensure that no steps are skipped during preparation.


Case Study Example

Scenario: A healthcare researcher collects patient data on demographics, symptoms, and treatment responses for a COVID-19 study across five hospitals.

Challenges Faced:

  • Data came in varied formats—Excel, paper-based transcription, and CSV.

  • Multiple entries for the same patient ID.

  • Gender coded differently across sites (e.g., “Male”, “M”, “1”).

  • Missing treatment dates.

  • Several age entries appeared as “0” or over “150”.

Cleaning Process:

  • Standardized gender values using Recode.

  • Identified and removed duplicate patient IDs.

  • Treated “0” and “150+” as outliers; either corrected or excluded.

  • Recalculated variables like hospital stay duration using Compute.

  • Assigned value labels and variable names for clarity.

Outcome: The cleaned dataset was successfully used for logistic regression modeling, with clear, replicable steps documented in the study appendix.


Data Cleaning and Preparation Challenges in SPSS

Conclusion

Data cleaning and preparation are non-negotiable steps in any SPSS analysis project. While SPSS offers powerful tools, users must be vigilant and methodical to address challenges like missing values, outliers, formatting inconsistencies, and incorrect variable settings. By adopting best practices and using SPSS features effectively, researchers can significantly improve data quality and the validity of their analytical findings.

Needs help with similar assignment?

We are available 24x7 to deliver the best services and assignment ready within 3-4 hours? Order a custom-written, plagiarism-free paper

Get Answer Over WhatsApp Order Paper Now

Linear and Multiple Regression Analysis in SPSS|2025

Regression analysis is a powerful statistical method used to examine the relationship between a dependent (response) variable and one or more independent (predictor) variables. In the world of data analysis, SPSS (Statistical Package for the Social Sciences) is one of the most widely used tools for conducting both linear and multiple regression analyses. SPSS offers a user-friendly interface and a wide range of statistical techniques that make it an essential tool for researchers, analysts, and data scientists. In this paper, we will explore the fundamentals of linear and multiple regression analysis in SPSS, focusing on their theoretical underpinnings, practical applications, and the steps involved in conducting these analyses using SPSS.

Understanding Regression Analysis

Before delving into the specifics of linear and multiple regression in SPSS, it is important to understand what regression analysis entails.

Regression Analysis is a statistical technique used for modeling the relationship between a dependent variable and one or more independent variables. The goal is to establish a model that can predict or explain the dependent variable based on the values of the independent variables. The basic idea behind regression is to fit a mathematical equation that best represents the relationship between the variables.

  • Linear Regression involves a single independent variable and seeks to model the relationship between the dependent variable and the independent variable as a straight line.
  • Multiple Regression extends this idea to include two or more independent variables, allowing for a more comprehensive analysis of the factors that influence the dependent variable.

Linear Regression in SPSS

Linear regression is the simplest form of regression analysis and serves as the foundation for more advanced models. It is commonly used to predict the value of a dependent variable based on the value of a single independent variable.

Theoretical Concept of Linear Regression

In simple linear regression, the relationship between the dependent variable (Y) and the independent variable (X) is modeled as:

Y=β0+β1X+ϵY = \beta_0 + \beta_1X + \epsilon

Where:

  • YY is the dependent variable.
  • β0\beta_0 is the y-intercept (constant term).
  • β1\beta_1 is the coefficient for the independent variable XX, which represents the slope of the regression line.
  • ϵ\epsilon is the error term, which accounts for the variability in YY that cannot be explained by XX.

The primary objective of linear regression is to estimate the coefficients β0\beta_0 and β1\beta_1, such that the difference between the predicted values and the actual values of YY is minimized.

Conducting Linear Regression in SPSS

  1. Data Preparation: Before performing a regression analysis in SPSS, the data must be appropriately prepared. This includes ensuring that the dependent variable is continuous and that the independent variable(s) are also either continuous or categorical with sufficient categories.

  2. Running Linear Regression:

    • Open SPSS and load your dataset.
    • Click on Analyze in the top menu, then select Regression and choose Linear.
    • A dialog box will appear. Move the dependent variable into the Dependent box and the independent variable into the Independent(s) box.
    • Click OK to run the analysis.
  3. Interpreting Results: The output will include several tables, such as:

    • Coefficients Table: This table shows the estimated values for the regression coefficients, including β0\beta_0 (constant) and β1\beta_1 (slope). The significance of these coefficients can be assessed using p-values.
    • Model Summary Table: This includes the R-squared value, which indicates the proportion of variance in the dependent variable explained by the independent variable.
    • ANOVA Table: This tests the overall significance of the regression model.
  4. Assumptions of Linear Regression: Linear regression makes several assumptions, including:

    • Linearity: The relationship between the dependent and independent variables is linear.
    • Homoscedasticity: The variance of the residuals is constant across levels of the independent variable.
    • Independence: The residuals are independent of each other.
    • Normality: The residuals should be approximately normally distributed.

Applications of Linear Regression

Linear regression is widely used in various fields such as economics, social sciences, health research, and marketing. Examples include:

  • Predicting sales based on advertising expenditure.
  • Estimating the effect of temperature on crop yield.
  • Assessing the relationship between income and education level.

Linear and Multiple Regression Analysis in SPSS

Multiple Regression in SPSS

While linear regression involves a single independent variable, Multiple Regression extends this concept by analyzing the relationship between a dependent variable and two or more independent variables. Multiple regression is more versatile as it allows for a more comprehensive model that can account for multiple factors influencing the dependent variable simultaneously.

Theoretical Concept of Multiple Regression

In multiple regression, the relationship between the dependent variable (Y) and multiple independent variables (X1,X2,…,XnX_1, X_2, …, X_n) is modeled as:

Y=β0+β1X1+β2X2+⋯+βnXn+ϵY = \beta_0 + \beta_1X_1 + \beta_2X_2 + \cdots + \beta_nX_n + \epsilon

Where:

  • YY is the dependent variable.
  • β0\beta_0 is the y-intercept.
  • β1,β2,…,βn\beta_1, \beta_2, …, \beta_n are the coefficients for the independent variables X1,X2,…,XnX_1, X_2, …, X_n.
  • ϵ\epsilon is the error term.

The goal of multiple regression is to estimate the coefficients for each independent variable, allowing us to understand how each predictor influences the dependent variable while controlling for the others.

Conducting Multiple Regression in SPSS

  1. Data Preparation: Similar to linear regression, the data must be cleaned and formatted appropriately. Multiple regression requires the inclusion of at least two independent variables.

  2. Running Multiple Regression:

    • Open SPSS and load your dataset.
    • Click on Analyze, then Regression, and select Linear.
    • In the dialog box, move the dependent variable to the Dependent box and the multiple independent variables to the Independent(s) box.
    • Click OK to run the analysis.
  3. Interpreting Results: The output will provide similar tables to those seen in simple linear regression, including:

    • Coefficients Table: This will list the coefficients for each independent variable. It is important to examine the significance of these coefficients (p-values) to determine which variables have a statistically significant impact on the dependent variable.
    • Model Summary Table: This includes the R-squared value, adjusted R-squared, and the standard error of the estimate. Adjusted R-squared accounts for the number of predictors in the model and is often a better indicator of model fit.
    • ANOVA Table: This tests whether the model as a whole is statistically significant.
  4. Assumptions of Multiple Regression: Multiple regression makes similar assumptions to simple linear regression, but there are a few additional considerations:

    • Multicollinearity: The independent variables should not be highly correlated with each other. High correlation can inflate standard errors and make it difficult to determine the unique contribution of each predictor.
    • Linearity: The relationship between the dependent variable and each independent variable should be linear.
    • Homoscedasticity: The variance of the residuals should remain constant across levels of the independent variables.

Applications of Multiple Regression

Multiple regression is commonly used in various research fields to examine the impact of several variables on a dependent variable. Examples include:

  • Predicting house prices based on factors such as square footage, number of bedrooms, and location.
  • Analyzing the impact of various factors like income, education, and job experience on job satisfaction.
  • Investigating the factors that influence customer satisfaction in a retail setting.

Linear and Multiple Regression Analysis in SPSS

Key Differences Between Linear and Multiple Regression

While both linear and multiple regression aim to model relationships between variables, they differ in several ways:

  1. Number of Predictors: Linear regression involves a single independent variable, while multiple regression involves two or more independent variables.
  2. Complexity: Multiple regression is more complex and can provide more nuanced insights into the relationships between variables.
  3. Multicollinearity: Multiple regression requires careful consideration of multicollinearity (correlation between predictors), which is not a concern in simple linear regression.

Conclusion

Both linear and multiple regression analyses are fundamental tools in statistical modeling, and SPSS provides a robust platform for performing these analyses. Linear regression is valuable for examining the relationship between two variables, while multiple regression allows for a more comprehensive analysis by including multiple predictors. By understanding how to conduct and interpret these analyses in SPSS, researchers and analysts can gain valuable insights into the factors that influence various outcomes, aiding in decision-making and predictive modeling.

Whether you’re exploring the impact of advertising on sales or understanding the determinants of student performance, linear and multiple regression in SPSS offer powerful tools for data-driven research and analysis.

Needs help with similar assignment?

We are available 24x7 to deliver the best services and assignment ready within 3-4 hours? Order a custom-written, plagiarism-free paper

Get Answer Over WhatsApp Order Paper Now

Analysis of Group Differences Using t-Test and ANOVA|2025

Explore the Analysis of Group Differences Using t-Test and ANOVA to compare means across groups. Learn when and how to apply these statistical methods for accurate results.

In research, especially in the social sciences, psychology, and medical fields, comparing group differences is a common task. Researchers often aim to determine whether there is a statistically significant difference between the means of two or more groups. To achieve this, various statistical methods are employed, with two of the most commonly used being the t-test and Analysis of Variance (ANOVA). Both methods are designed to test hypotheses about group means, but they are applied in different contexts and serve different purposes. This paper will explore the use of t-tests and ANOVA for analyzing group differences, discussing their assumptions, applications, and key differences, as well as the interpretation of results.

Analysis of Group Differences Using t-Test and ANOVA

The t-Test: A Basic Overview

The t-test is one of the most commonly used statistical tests to compare the means of two groups. It is typically used when the data is approximately normally distributed and when there is a need to determine if two independent or related samples have significantly different means. The t-test is based on the t-distribution, which, like the normal distribution, is bell-shaped but has heavier tails. It is particularly useful for small sample sizes, where the normal distribution may not be a good approximation.

Types of t-Tests

There are two primary types of t-tests:

  1. Independent Samples t-Test: This test compares the means of two independent groups. For instance, one might use this test to compare the average test scores of students from two different schools.

  2. Paired Samples t-Test: This test is used when the data involves two related samples. For example, it might be used to compare measurements taken before and after a treatment on the same group of individuals.

Assumptions of the t-Test

The t-test relies on several key assumptions:

  • Normality: The data in each group should follow a normal distribution. This assumption is more critical when sample sizes are small.
  • Homogeneity of Variance: The variance within each group should be roughly equal. This assumption is crucial for the independent samples t-test, where unequal variances can lead to inaccurate results.
  • Independence: For the independent samples t-test, the samples must be independent of each other. For the paired samples t-test, the observations in the two groups must be paired in a meaningful way (e.g., before-and-after measurements on the same subjects).

Hypothesis Testing in the t-Test

In hypothesis testing, the null hypothesis typically states that there is no difference between the group means. The alternative hypothesis suggests that there is a significant difference. The formula for calculating the t-value varies depending on whether the sample sizes are equal or unequal, but the general form is as follows:

t=Difference in group meansStandard error of the differencet = \frac{\text{Difference in group means}}{\text{Standard error of the difference}}

After calculating the t-statistic, the researcher compares it to a critical value from the t-distribution, based on the degrees of freedom and the chosen significance level (often 0.05). If the calculated t-value exceeds the critical value, the null hypothesis is rejected, suggesting a significant difference between the groups.

Analysis of Group Differences Using t-Test and ANOVA

Analysis of Variance (ANOVA): A Deeper Dive

While the t-test is ideal for comparing two groups, ANOVA extends this idea to compare the means of three or more groups. ANOVA tests whether there are any statistically significant differences between the means of multiple groups by analyzing the variation within and between the groups. The central concept in ANOVA is partitioning the total variance in the data into two components: variance between groups and variance within groups.

Types of ANOVA

There are several types of ANOVA, depending on the number of independent variables and the nature of the data:

  1. One-Way ANOVA: This is used when there is one independent variable with more than two levels (groups). For example, it can be used to test whether students from three different schools have different average test scores.

  2. Two-Way ANOVA: This is used when there are two independent variables. It can also examine the interaction between these two variables. For example, a study might look at both the type of teaching method (e.g., traditional vs. online) and the gender of students to determine their effects on academic performance.

  3. Repeated Measures ANOVA: This test is used when the same subjects are measured multiple times under different conditions. It is similar to the paired samples t-test, but it can handle more complex experimental designs.

Assumptions of ANOVA

Like the t-test, ANOVA has several assumptions that must be met for the results to be valid:

  • Normality: The data in each group should be normally distributed.
  • Homogeneity of Variances: The variance within each group should be roughly equal. This assumption is tested using tests like Levene’s test.
  • Independence: The observations should be independent of each other.

Hypothesis Testing in ANOVA

In ANOVA, the null hypothesis states that all group means are equal. The alternative hypothesis suggests that at least one group mean is different. ANOVA uses the F-statistic, which is calculated as the ratio of the variance between the groups to the variance within the groups:

F=Variance between groupsVariance within groupsF = \frac{\text{Variance between groups}}{\text{Variance within groups}}

If the F-statistic is large and the p-value is below the chosen significance level (typically 0.05), the null hypothesis is rejected, indicating that at least one of the group means is significantly different. However, if the ANOVA test is significant, it does not tell us which specific groups are different from each other. Post-hoc tests, such as Tukey’s HSD (Honest Significant Difference) test, are often conducted to identify which pairs of groups differ.

Comparing t-Test and ANOVA

While both the t-test and ANOVA are used to compare group means, they are suited for different situations:

  • t-Test: Best suited for comparing the means of two groups. If you have only two groups, the t-test is simpler and more direct.

  • ANOVA: Best suited for comparing the means of three or more groups. ANOVA is more flexible in terms of the number of groups and can handle more complex designs (e.g., with more than one independent variable).

One key difference is that while the t-test compares two groups at a time, ANOVA evaluates all group means simultaneously, which can make it more efficient when dealing with multiple groups. However, ANOVA’s F-statistic only tells us if there is a significant difference, but not where that difference lies—this requires additional post-hoc testing.

Analysis of Group Differences Using t-Test and ANOVA

Real-World Applications of t-Test and ANOVA

Both the t-test and ANOVA have broad applications in various fields. Here are a few examples:

  1. Medicine: In clinical trials, a t-test can be used to compare the effects of a treatment versus a placebo on a particular health outcome. ANOVA might be used to test the effects of multiple treatments across several groups of patients.

  2. Education: Researchers may use a t-test to compare the performance of students from two different educational programs. ANOVA can be used to compare the effectiveness of multiple teaching methods across several classrooms.

  3. Business: A company might use a t-test to analyze the difference in customer satisfaction between two product versions. ANOVA could be employed to compare the sales performance of several stores located in different regions.

  4. Psychology: In psychological research, a t-test might be used to compare the effects of two therapies, while ANOVA could examine the impact of different types of therapies (e.g., cognitive-behavioral therapy, mindfulness-based therapy, and traditional psychotherapy).

Limitations of t-Test and ANOVA

While both the t-test and ANOVA are powerful tools, they have limitations:

  • t-Test:
    • It can only compare two groups at a time.
    • It is sensitive to violations of assumptions, particularly normality and homogeneity of variance.
  • ANOVA:
    • It does not tell you which specific groups differ from one another.
    • It can become complicated with more complex experimental designs, particularly when there are interactions between factors.

Conclusion

In summary, both the t-test and ANOVA are fundamental statistical techniques used to compare group means and analyze group differences. The t-test is appropriate when comparing two groups, whereas ANOVA is more suitable for comparing three or more groups. Despite their similarities, the choice between a t-test and ANOVA depends on the number of groups being compared and the nature of the research design. Understanding the assumptions and limitations of these tests is crucial for obtaining valid and reliable results.

Furthermore, while both tests can be powerful when used correctly, it is essential to conduct proper follow-up analyses, such as post-hoc tests in ANOVA, to determine exactly where the group differences lie. Ultimately, these statistical methods form the backbone of hypothesis testing in many fields, providing researchers with tools to make informed decisions based on data.

Needs help with similar assignment?

We are available 24x7 to deliver the best services and assignment ready within 3-4 hours? Order a custom-written, plagiarism-free paper

Get Answer Over WhatsApp Order Paper Now