Importance of SPSS Help with Dissertation Research and Design|2025
Discover the importance of SPSS help with dissertation research and design. Learn how expert support can enhance your data analysis, improve research accuracy, and ensure successful dissertation outcomes.
Conducting research and designing a dissertation can be a complex and challenging process. The role of statistical analysis is critical in ensuring the research findings are accurate, reliable, and valid. This is where the Statistical Package for the Social Sciences (SPSS) becomes an invaluable tool. SPSS is a comprehensive software package used for statistical analysis and data management, offering a wide range of functions to support research projects. In this paper, we explore the importance of SPSS help with dissertation research and design, emphasizing its utility, relevance, and impact on producing high-quality academic work.
What is SPSS?
SPSS, which stands for Statistical Package for the Social Sciences, is a powerful software application widely used for data analysis in academic, professional, and organizational research. Developed in the late 1960s, SPSS has evolved into one of the most popular statistical tools due to its user-friendly interface, flexibility, and versatility. In research, SPSS enables users to organize, analyze, and interpret data efficiently, making it a preferred choice for students and researchers across various disciplines.
Importance of SPSS Help with Dissertation Research & Design PPT
When preparing a dissertation, especially in fields that rely on quantitative data, creating a clear and well-structured presentation of research findings is crucial. The integration of SPSS in a PowerPoint (PPT) presentation provides several advantages:
- Visualization of Data: SPSS allows for the creation of visually appealing charts, graphs, and tables, which can be easily imported into a PPT. These visual elements help communicate complex statistical findings effectively.
- Simplified Statistical Interpretation: SPSS simplifies the interpretation of statistical outputs, making it easier to present findings in a comprehensible manner for academic audiences.
- Enhanced Clarity: With SPSS help, researchers can ensure that their presentation materials are accurate and clear, highlighting key points and trends in the data.
- Professional Quality: SPSS’s integration with other software ensures that presentations maintain a professional and polished appearance, essential for academic evaluations.
10 Importance of SPSS
- Data Management: SPSS is equipped to handle large datasets efficiently, making it ideal for dissertation research that involves extensive data collection.
- User-Friendly Interface: Its intuitive design enables researchers to conduct complex statistical analyses without requiring advanced programming skills.
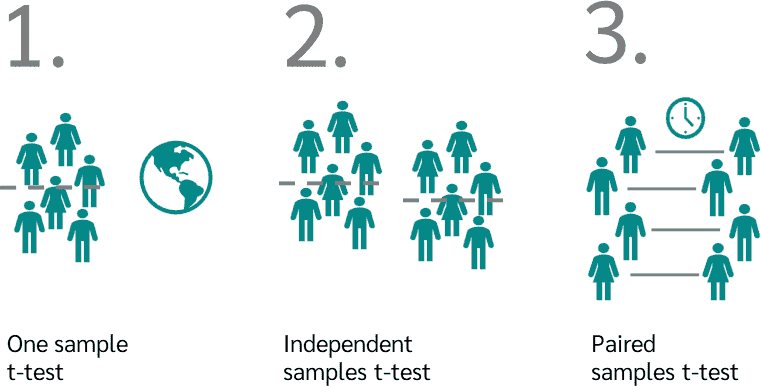
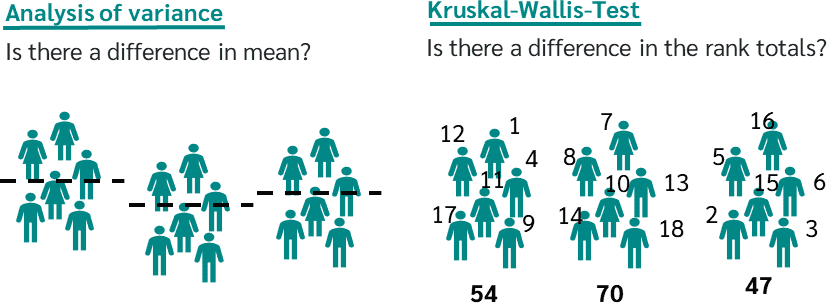
- Wide Range of Statistical Tests: SPSS supports numerous statistical tests, including t-tests, ANOVA, regression analysis, and chi-square tests, catering to diverse research needs.
- Accurate Results: By minimizing human error, SPSS ensures accurate computations and reliable statistical outputs.
- Data Transformation: Researchers can clean, code, and transform data effectively using SPSS, enhancing data quality.
- Graphical Representation: The software generates high-quality graphs and charts to illustrate findings.
- Customizable Analyses: SPSS allows users to tailor analyses to suit specific research questions.
- Reproducibility: Its standardized processes ensure that analyses can be replicated for verification.
- Time Efficiency: Automating data analysis tasks saves time and effort during dissertation preparation.
- Cross-Disciplinary Utility: SPSS is applicable in various fields, including social sciences, education, healthcare, and marketing.
Importance of SPSS in Research
SPSS plays a pivotal role in the research process, particularly in quantitative studies. It helps researchers uncover patterns, trends, and relationships within data. Some key aspects of its importance include:
- Objective Decision-Making: By providing precise statistical results, SPSS aids in making objective decisions based on empirical evidence.
- Hypothesis Testing: SPSS simplifies the process of testing hypotheses, enabling researchers to confirm or reject their assumptions.
- Data Visualization: The software’s ability to produce graphs and charts enhances the interpretation and communication of results.
- Trend Analysis: SPSS’s analytical tools allow researchers to identify trends over time, which is particularly useful in longitudinal studies.
- Reliability Testing: The software can assess the reliability and validity of research instruments, ensuring data integrity.
Importance of SPSS PDF
SPSS-generated PDFs are instrumental for research documentation and dissemination. These documents offer:
- Comprehensive Reporting: SPSS can export detailed statistical reports in PDF format, which are useful for sharing with supervisors, peers, or examiners.
- Data Security: PDFs provide a secure way to present findings, preventing unauthorized modifications.
- Archiving: SPSS PDFs serve as an excellent archival format, preserving research outputs for future reference.
- Accessibility: SPSS PDFs are universally accessible across devices and platforms, ensuring that findings reach a broad audience.
Why Use SPSS for Data Analysis?
Choosing SPSS for data analysis offers several advantages:
- Efficiency: SPSS streamlines data analysis, allowing researchers to focus on interpreting results rather than manual calculations.
- Versatility: The software supports various statistical methods, making it suitable for diverse research designs.
- Ease of Use: Its graphical interface and menu-driven commands make it accessible even to beginners.
- Integration: SPSS integrates seamlessly with other software, such as Excel and R, enhancing its functionality.
- Reliability: SPSS ensures that statistical computations are accurate, reducing the risk of errors.
SPSS Meaning in Research
In research, SPSS stands for more than just a software tool; it represents a systematic approach to handling and analyzing data. Its meaning in research is rooted in its ability to:
- Facilitate Data Management: SPSS organizes and preprocesses raw data for analysis.
- Support Hypothesis Testing: It offers tools to test and validate research hypotheses.
- Enhance Credibility: By producing robust and replicable results, SPSS bolsters the credibility of research findings.
- Promote Analytical Rigor: The software ensures methodological rigor, essential for academic and professional research.

Use of Statistical Software in Research
Statistical software like SPSS has transformed the landscape of research by:
- Automating Calculations: Automating complex statistical procedures saves time and minimizes errors.
- Improving Accuracy: Statistical software ensures precise computations, enhancing the reliability of research findings.
- Handling Big Data: Tools like SPSS can process large datasets efficiently, which is increasingly relevant in today’s data-driven world.
- Facilitating Collaboration: Researchers can share SPSS files and outputs easily, fostering collaborative projects.
- Customizing Analyses: Statistical software allows users to customize analyses to align with specific research objectives.
SPSS in Research Example
Consider a dissertation studying the impact of online learning on student performance. Using SPSS, the researcher can:
- Data Entry: Enter survey responses and test scores into SPSS.
- Descriptive Statistics: Compute means, medians, and standard deviations to summarize data.
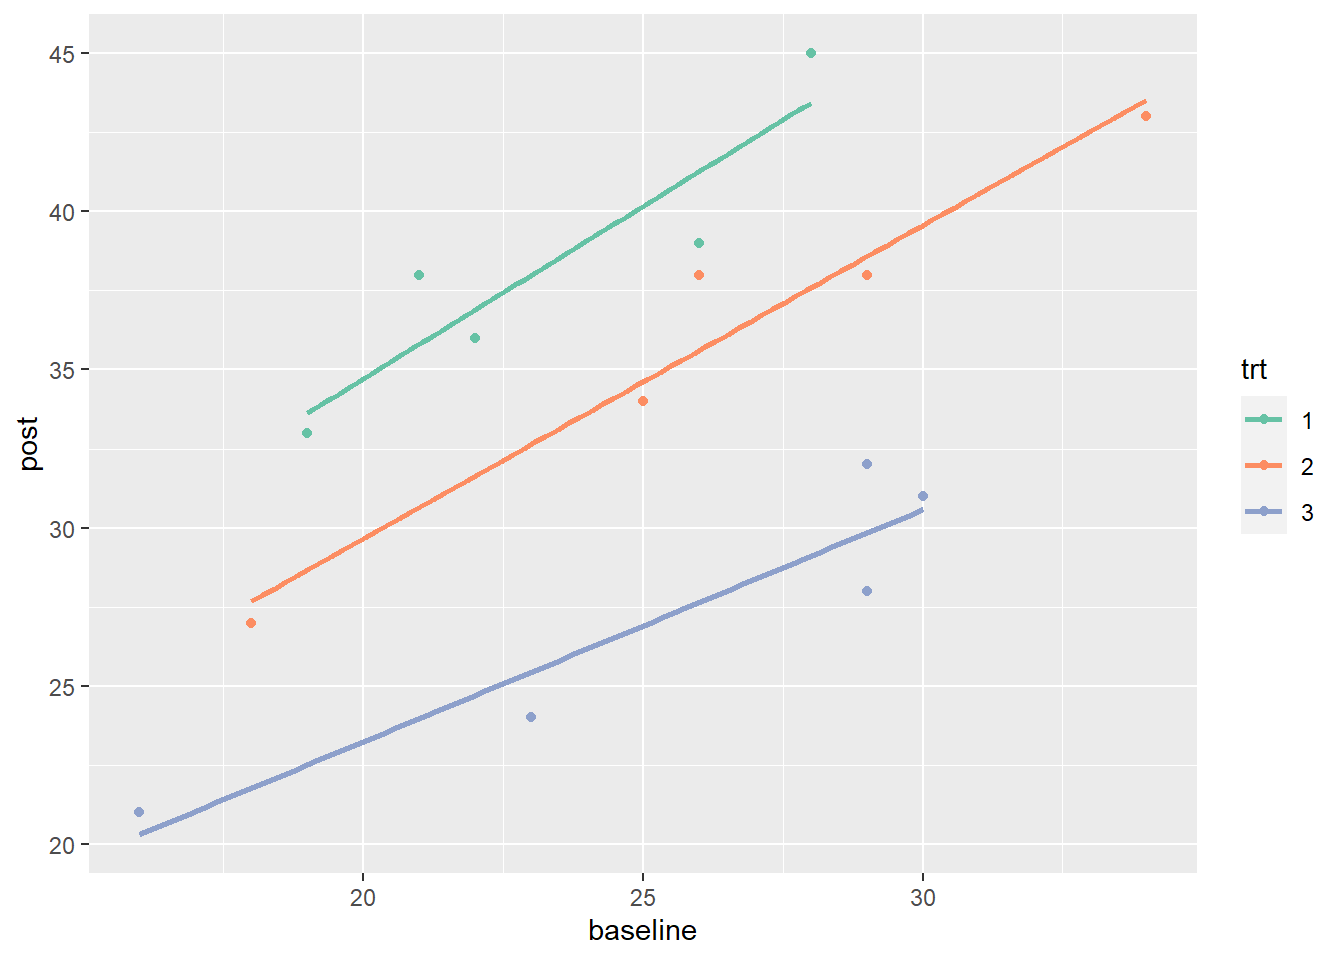
- Correlation Analysis: Assess the relationship between variables, such as time spent online and academic performance.
- Regression Analysis: Evaluate the predictive power of independent variables on dependent variables.
- Visualization: Create graphs and charts to illustrate findings, such as a bar chart showing performance differences across groups.

Conclusion
The importance of SPSS help with dissertation research and design cannot be overstated. As a powerful statistical software tool, SPSS supports researchers in managing, analyzing, and presenting data effectively. From hypothesis testing to data visualization, its features enhance the quality and credibility of research outputs. Whether through SPSS help in creating a compelling PPT presentation, generating reliable PDFs, or conducting rigorous data analyses, this software plays a central role in academic research. By leveraging SPSS, researchers can ensure that their dissertation projects meet the highest standards of analytical rigor and professional presentation.
Needs help with similar assignment?
We are available 24x7 to deliver the best services and assignment ready within 3-4 hours? Order a custom-written, plagiarism-free paper


:max_bytes(150000):strip_icc()/t-test_final2-d26bbb129cc441c192ccf8e784ae06a4.png)