Customizing SPSS Graphs and Charts|2025

IBM SPSS Statistics is a powerful statistical software package widely used in social sciences, healthcare, market research, and many other fields to analyze data and perform statistical modeling. One of the critical aspects of SPSS is its ability to create visual representations of data, such as graphs and charts, which allow users to interpret their results more easily. Customizing these graphs and charts is an essential skill for producing professional-quality reports and presentations.

This paper delves into the process of customizing SPSS graphs and charts, focusing on the various types of graphs, how to modify them, and how to interpret them in the context of complex datasets. The paper will also explore key techniques, such as customizing SPSS graphs and charts online, creating line graphs with multiple variables, adjusting the Y-axis scale, and utilizing the SPSS Chart Editor.

Types of Graphs in SPSS

SPSS offers a wide range of graph types to represent data in different ways, each tailored to display specific patterns or trends in the data. Common graph types include:

  1. Bar Graphs: These are ideal for comparing categorical data. They display data as rectangular bars with lengths proportional to the values they represent.
  2. Line Graphs: These graphs are used to display continuous data and are especially useful for showing trends over time, particularly when dealing with multiple variables.
  3. Pie Charts: Pie charts represent proportions and are often used when you want to show how individual parts contribute to a whole.
  4. Scatter Plots: Scatter plots display the relationship between two continuous variables, with each point representing an individual data point. They are useful for identifying correlations.
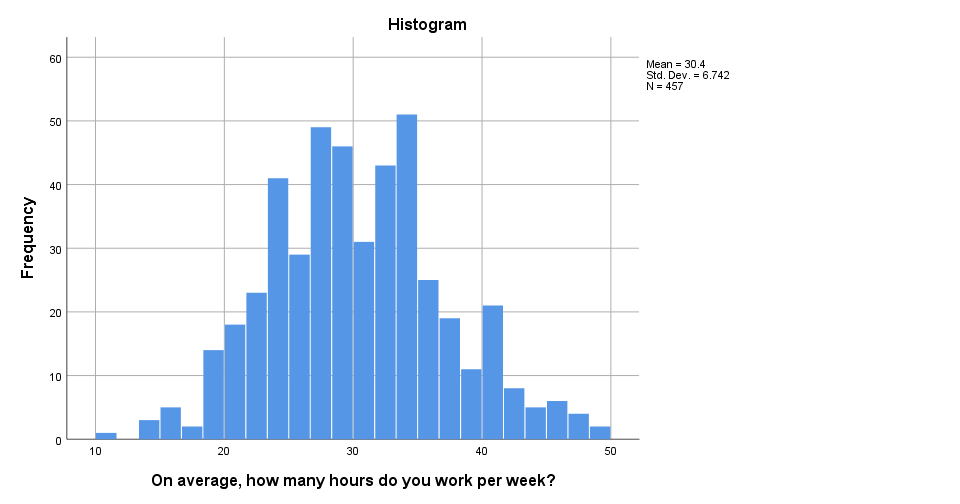
  5. Histograms: Histograms are used for displaying the frequency distribution of a continuous variable. They show the number of observations within each interval of the data.
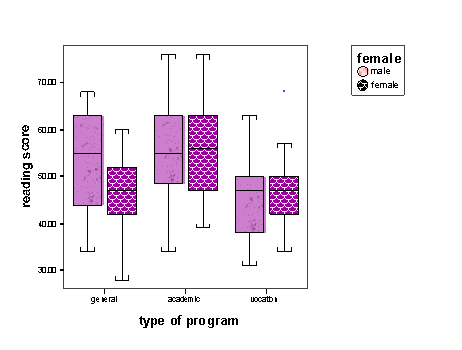
  6. Box Plots: These represent the distribution of numerical data through their quartiles and are useful for identifying outliers and understanding the spread of data.

SPSS also supports several specialized graphs, such as stacked bar charts, dot plots, and area charts, depending on the data structure and research needs.

How to Create Graphs in SPSS

Creating graphs in SPSS is straightforward and can be done through the Chart Builder. The following steps outline how to create a basic graph:

  1. Open the Data Set: Start by loading the dataset that you intend to analyze.
  2. Access the Chart Builder: Navigate to Graphs on the top menu and select Chart Builder. This opens the Chart Builder window.
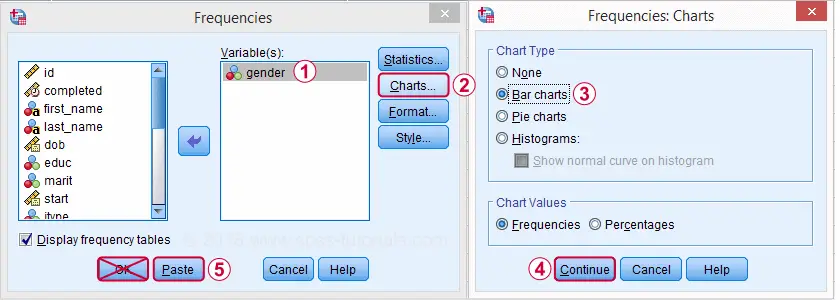
  3. Select a Graph Type: In the Chart Builder, you will find different categories of graph types. Drag and drop the appropriate type of graph you wish to create into the chart preview area.
  4. Define Variables: For the selected graph, assign the relevant variables to the axes or other parts of the graph. For example, in a bar chart, drag the categorical variable to the x-axis and the numerical variable to the y-axis.
  5. Customize the Graph: You can customize various elements of the graph such as the colors, labels, and axis titles.
  6. Generate the Graph: Once the graph is customized, click OK to generate it. The graph will appear in the output viewer, where further customization can be done through the Chart Editor.

SPSS Chart Editor

The SPSS Chart Editor is a powerful tool used to refine and adjust graphs that have already been created. Once a graph is generated, it can be customized further using the Chart Editor. The following modifications are commonly made:

  • Changing Axis Scales: The Y-axis and X-axis scales can be adjusted by double-clicking on the axis in the Chart Editor. This opens a dialog box where you can set specific limits, increments, and display formats.
  • Adding Titles and Labels: Titles, axis labels, and legends can be edited to provide clarity. This is important for presenting graphs in a readable and professional manner.
  • Adjusting Colors and Styles: You can change the colors of bars, lines, or other graphical elements. This allows you to match the graph’s appearance to a specific theme or branding.
  • Incorporating Data Labels: Data labels can be added to graphs to display specific values on the chart. This can help the viewer better understand the exact values represented by the graph.
  • Annotations: The Chart Editor allows users to add annotations, such as arrows or text boxes, to emphasize certain parts of the graph.

The Chart Editor provides a flexible environment for refining the presentation of your data and ensuring that your graphs convey the right message.

Customizing SPSS Graphs and Charts

Customizing SPSS Graphs and Charts IBM

IBM’s version of SPSS provides advanced options for customizing graphs. These customizations are particularly important for tailoring visual representations to specific analytical needs. Here are a few techniques for customizing SPSS graphs:

  1. Multivariate Graphs: SPSS allows you to plot multiple variables on the same graph. For example, you can overlay multiple line graphs to compare trends across variables. To do this, choose the Line Chart type and then assign multiple variables to the y-axis.
  2. Layered Graphs: IBM SPSS supports the layering of different types of graphs on a single plot. For instance, you could overlay a scatter plot on top of a line graph to show how two variables relate over time.
  3. Use of Themes: SPSS allows you to apply predefined themes to your graphs, which can quickly give your charts a consistent and polished look. This is especially useful in professional reporting, where visual uniformity is key.
  4. Interactive Graphs: With SPSS, you can create interactive charts, particularly when exporting your graphs to web formats. These charts allow users to explore the data in real-time, zooming in and out, and examining different data points.

SPSS Line Graph Multiple Variables

A line graph is one of the most effective ways to represent continuous data and visualize trends over time. In SPSS, it is possible to create a line graph with multiple variables, which allows you to compare trends across several datasets simultaneously.

To create a line graph with multiple variables in SPSS, follow these steps:

  1. Open the Data File: Ensure that your dataset contains multiple continuous variables that you want to compare.
  2. Select Graph Type: Go to the Chart Builder and choose Line as the graph type.
  3. Assign Variables: Drag your primary variable to the x-axis and assign each of the variables you want to compare to the y-axis. You can either create multiple lines or use different line types for each variable.
  4. Customize the Graph: Use the Chart Editor to adjust line styles, add labels, and change axis scales to improve the clarity of the graph.

The result will be a multi-line graph where each line represents a variable, allowing you to compare trends across different variables over the same range of values.

Customizing SPSS Graphs and Charts

SPSS Graph Multiple Variables

When analyzing multiple variables simultaneously, it can be helpful to use different types of graphs to illustrate relationships between the variables. SPSS allows you to create multi-variable graphs in several ways:

  1. Bar Graphs with Multiple Variables: In the Bar Graph Chart Builder, you can create grouped or stacked bar charts to represent multiple variables. Grouped bar charts display the variables side by side, while stacked bar charts stack the values on top of one another.
  2. Scatter Plots for Multiple Variables: In scatter plots, you can represent multiple variables by plotting several series on the same graph. You can differentiate between series using different colors or shapes for each data set.
  3. Clustered Boxplots: Clustered boxplots allow you to compare the distributions of a continuous variable across several categorical variables. This is particularly useful for comparing subgroups within your data.

How to Change Y-Axis Scale in SPSS

Changing the Y-axis scale in SPSS is a straightforward task that can significantly affect the interpretability of your graph. In the Chart Editor, follow these steps:

  1. Select the Y-Axis: Double-click on the Y-axis of your graph to open the axis properties dialog.
  2. Adjust the Scale: In the properties window, you can set specific minimum and maximum values for the Y-axis, adjust the interval between ticks, and modify the axis labels. This is useful when you need to zoom in on a particular range of values or if you want to standardize the scale across multiple graphs.
  3. Logarithmic Scales: For data that spans several orders of magnitude, you might want to use a logarithmic scale. SPSS provides this option, and it can help make patterns in such data more visible.
  4. Reversing the Axis: In some cases, you may need to reverse the Y-axis (e.g., to show descending values). This can be done directly from the properties window in the Chart Editor.

Customizing SPSS Graphs and Charts Online

Customizing SPSS graphs and charts online refers to the ability to create, edit, and share SPSS graphs through online platforms or interfaces. While SPSS itself is primarily a desktop application, there are several ways to use SPSS outputs in an online context:

  1. Export to Online Formats: SPSS allows you to export graphs as image files (e.g., PNG, JPEG) or in vector formats (e.g., SVG) for use in online publications and presentations.
  2. Use of Online SPSS Tools: There are third-party platforms that allow you to import SPSS files for analysis and graph customization. These platforms can provide additional flexibility and features for presenting data online.
  3. Interactive Dashboards: For more advanced users, SPSS can be integrated with online data visualization tools, such as Tableau or Power BI, which allow users to create interactive dashboards with SPSS data.

Customizing SPSS Graphs and Charts

Conclusion

Customizing graphs and charts in SPSS is an essential skill for effective data presentation. SPSS provides a range of tools for creating and modifying different types of graphs, from bar charts to line graphs and scatter plots. The use of the Chart Editor, customizing axis scales, and handling multiple variables on a single graph are all vital steps for refining visualizations and ensuring clarity in analysis. Moreover, SPSS allows for advanced customization, such as adding interactive features and exporting graphs for online use, which can further enhance the usability and presentation of statistical findings.

By mastering these techniques, users can significantly improve the quality of their data presentations, making it easier for others to interpret complex statistical results.

GetSPSSHelp stands out as a premier choice for SPSS assignment assistance due to its team of highly qualified experts with extensive knowledge in statistical analysis and software usage. The platform is committed to ensuring timely delivery of assignments, even when deadlines are tight, without compromising on quality. By offering personalized solutions tailored to the specific requirements of each student, GetSPSSHelp guarantees accuracy and relevance in every assignment. The service is also highly affordable, combining competitive pricing with premium quality standards. Furthermore, its 24/7 customer support ensures that students receive prompt and reliable assistance, making it a dependable partner for all SPSS-related academic needs.

Needs help with similar assignment?

We are available 24x7 to deliver the best services and assignment ready within 3-4 hours? Order a custom-written, plagiarism-free paper

Get Answer Over WhatsApp Order Paper Now

Understanding SPSS Syntax Errors|2025

Understanding SPSS Syntax Errors is key to efficient data analysis. Learn how to identify, troubleshoot, and resolve common syntax issues to streamline your SPSS workflow and ensure accurate results!

SPSS (Statistical Package for the Social Sciences) is a widely used software for statistical analysis. While its graphical user interface (GUI) makes it accessible to many users, its syntax capabilities provide advanced functionality and reproducibility for those who prefer scripting their analyses. However, working with SPSS syntax can sometimes lead to errors that disrupt the analytical process. This paper explores various aspects of SPSS syntax errors, focusing on common issues, their causes, and potential resolutions. Key topics include an explanation of SPSS Syntax Error n° 10933, forcing errors conditionally in SPSS syntax, exiting with error codes, and resolving issues related to undefined or incorrect variable names.


Understanding SPSS Syntax Errors

What Does SPSS Syntax Error n° 10933 Mean and How to Resolve It?

SPSS Syntax Error n° 10933 typically indicates a structural issue within the syntax file, such as an unrecognized command or a missing delimiter. This error often occurs due to:

  1. Typing Mistakes: Misspelling of commands, variables, or file paths.
  2. Improper Syntax Structure: Missing keywords, unbalanced parentheses, or missing periods (.) that signify the end of a command.
  3. Incompatibility: Using commands or options not supported by the SPSS version being used.

Example of Syntax Leading to Error 10933

GET FILE = 'datafile.sav'
VARIABLE LABELS Var1 "Variable 1" Var2 "Variable 2"
FREQ Var1 Var2.

The above example would trigger Error 10933 because the GET FILE command is missing a period at the end. SPSS relies on periods to mark the end of statements.

Resolving Error 10933

To resolve this error:

  • Check Syntax Structure: Ensure every command ends with a period and follows SPSS syntax rules.
  • Review Documentation: Refer to SPSS command syntax reference guides to verify correct usage.
  • Use the GUI for Verification: Run the corresponding task through the GUI and paste the generated syntax to ensure correctness.

Corrected example:

GET FILE = 'datafile.sav'.
VARIABLE LABELS Var1 "Variable 1" Var2 "Variable 2".
FREQ Var1 Var2.

Understanding SPSS Syntax Errors

Forcing an Error in SPSS Syntax When a Condition Is Met

In some scenarios, you might want to intentionally trigger an error in SPSS syntax if a specific condition is met. This technique can be useful for debugging or enforcing data validation rules.

Example Scenario

Suppose you want to ensure that a particular variable contains only numeric values within a specified range. If the condition is violated, you want to stop the script execution.

Implementation

DO IF (MIN(Var1) < 0 OR MAX(Var1) > 100).
    COMPUTE _error = 1/0.  /* Deliberately divide by zero to trigger an error */
END IF.
EXECUTE.

In this example:

  • The condition checks whether any value in Var1 falls outside the range [0, 100].
  • If the condition is true, an intentional division by zero is performed to force an error.

Considerations

  • Use this approach cautiously, as forced errors can interrupt the workflow.
  • Ensure the conditions are well-defined to avoid unintentional disruptions.

Exiting with Error Codes in SPSS Syntax (Stack Overflow Reference)

Exiting SPSS syntax with an error code is another advanced technique often discussed in forums like Stack Overflow. This method can signal external systems or users about the success or failure of an SPSS script.

Example

To exit an SPSS script with an error code, you can utilize the following syntax:

BEGIN PROGRAM Python.
import sys
sys.exit(1)  # Exit with error code 1
END PROGRAM.

Explanation

  • The BEGIN PROGRAM Python block allows you to integrate Python code within SPSS.
  • The sys.exit(1) command exits the script with an error code of 1.
  • Error codes can be customized to represent different error types or statuses.

Practical Applications

  • Integration with External Systems: Use error codes to signal success or failure to automated systems.
  • Debugging: Exit with specific codes to identify problematic sections in complex scripts.

Understanding SPSS Syntax Errors

Error: Incorrect Variable Name or Not Defined by Previous Commands

Another frequent issue in SPSS syntax is the error related to incorrect or undefined variable names. This error arises when the script references a variable that:

  1. Does not exist in the active dataset.
  2. Has been misspelled in the syntax.
  3. Was not created or imported properly before being used.

Example of the Error

FREQ VARIABLES=NonExistentVar.

This would produce an error because NonExistentVar is not defined in the dataset.

Resolving the Issue

  1. Verify Variable Names: Use the DISPLAY VARIABLES command to list all variables in the dataset.
    DISPLAY VARIABLES.
  2. Check Spelling: Ensure the variable name in the syntax matches the one in the dataset, including case sensitivity.
  3. Define Variables Properly: Ensure variables are created or imported before referencing them. For example:
    COMPUTE NewVar = Var1 + Var2.
    EXECUTE.

    Here, NewVar is defined before any further use.


General Tips for Avoiding SPSS Syntax Errors

  1. Utilize the SPSS Syntax Checker: The built-in syntax checker highlights errors in real-time.
  2. Run Commands Incrementally: Execute small sections of syntax to identify errors early.
  3. Leverage GUI-Generated Syntax: Use SPSS’s GUI to generate accurate syntax, which can then be modified as needed.
  4. Consult Documentation: Familiarize yourself with SPSS’s syntax guide for proper command usage.
  5. Debugging Strategies: Use PRINT or WRITE commands to log intermediate results and identify issues.

Understanding SPSS Syntax Errors

Conclusion

SPSS syntax errors, while common, can be addressed effectively with a systematic approach. Understanding the causes and resolutions of errors like Syntax Error n° 10933, implementing conditional error forcing, utilizing exit codes, and resolving issues with variable names can significantly enhance your efficiency in using SPSS. By adopting best practices and leveraging the tools available, you can minimize disruptions and focus on deriving meaningful insights from your data.

This guide provides a foundation for identifying and resolving SPSS syntax errors, empowering users to navigate complex scripting challenges with confidence.

GetSPSSHelp stands out as a premier choice for SPSS assignment assistance due to its team of highly qualified experts with extensive knowledge in statistical analysis and software usage. The platform is committed to ensuring timely delivery of assignments, even when deadlines are tight, without compromising on quality. By offering personalized solutions tailored to the specific requirements of each student, GetSPSSHelp guarantees accuracy and relevance in every assignment. The service is also highly affordable, combining competitive pricing with premium quality standards. Furthermore, its 24/7 customer support ensures that students receive prompt and reliable assistance, making it a dependable partner for all SPSS-related academic needs.

Needs help with similar assignment?

We are available 24x7 to deliver the best services and assignment ready within 3-4 hours? Order a custom-written, plagiarism-free paper

Get Answer Over WhatsApp Order Paper Now

Choosing Appropriate Statistical Tests in SPSS|2025

Choosing Appropriate Statistical Tests in SPSS is essential for accurate data analysis. Learn how to select, run, and interpret the right tests with expert tips and step-by-step guidance!

When conducting research, selecting the appropriate statistical test is critical to ensure accurate analysis and valid conclusions. SPSS (Statistical Package for the Social Sciences) is a powerful tool for performing statistical analyses, but its effectiveness depends on the user’s ability to choose the correct tests for their data. This paper explores how to choose appropriate statistical tests in SPSS, offering examples, guidelines, and practical insights.

Choosing Appropriate Statistical Tests in SPSS

Understanding the Basics of Statistical Testing

Statistical testing involves evaluating hypotheses about data relationships or distributions. The choice of test depends on several factors, including:

  1. Type of Variables: Determine whether your variables are categorical, ordinal, or continuous.
  2. Number of Groups or Variables: Identify how many groups or variables are involved in your analysis.
  3. Research Questions: Clarify the hypotheses and what you aim to test.
  4. Distribution of Data: Assess whether your data follows a normal distribution.

SPSS Test List

SPSS provides a wide array of statistical tests, some of which are listed below:

Descriptive Statistics:

    • Frequencies, means, standard deviations.

Correlation Tests:

    • Pearson correlation, Spearman’s rho.

Comparison Tests:

    • Independent samples t-test, paired samples t-test, one-way ANOVA.

Regression Tests:

    • Simple linear regression, multiple regression.

Non-parametric Tests:

    • Chi-square test, Mann-Whitney U test, Kruskal-Wallis test.

Each test serves specific purposes depending on the nature of the data and the research question.

Choosing Appropriate Statistical Tests in SPSS

List of Statistical Tests and When to Use Them (PDF)

For a comprehensive understanding, it’s helpful to consult a reference such as a PDF guide that categorizes tests based on their purpose:

  • Correlation Tests: Use these when examining relationships between two variables.
  • Comparison Tests: Apply these when comparing means between groups.
  • Regression Tests: Use regression to predict outcomes based on independent variables.
  • Non-parametric Tests: Suitable for ordinal data or data that doesn’t meet parametric assumptions.

Choosing a Statistical Test: Examples

Here are common research scenarios and the statistical tests you might choose:

Statistical Test for Correlation Between Two Variables:

    • When exploring the relationship between two continuous variables, use Pearson’s correlation if the data is normally distributed. If the data is non-normal, opt for Spearman’s rho.
    • Example: Investigating whether there is a relationship between hours studied and exam scores.

What Statistical Test to Use When Comparing Two Groups:

    • Use an independent samples t-test when comparing the means of two unrelated groups with continuous data.
    • Example: Comparing test scores between male and female students.

Statistical Test for Continuous Independent Variable and Categorical Dependent Variable:

    • Logistic regression is suitable when predicting a categorical dependent variable from a continuous independent variable.
    • Example: Examining whether income level predicts the likelihood of owning a car.

Statistical Test for Two Independent Variables and One Dependent Variable:

    • Use a two-way ANOVA when investigating the effects of two independent variables on a continuous dependent variable.
    • Example: Studying the impact of teaching method and gender on test performance.

Choosing Appropriate Statistical Tests in SPSS

Developing a Workflow: Which Statistical Test Should I Use Flowchart

A flowchart is an excellent tool for navigating the decision-making process. For example:

Is the dependent variable categorical or continuous?

    • If categorical, consider Chi-square or logistic regression.
    • If continuous, proceed to the next step.

How many independent variables are there?

    • One variable: Use t-tests or simple regression.
    • Multiple variables: Use ANOVA or multiple regression.

Is the data normally distributed?

    • If yes, use parametric tests.
    • If no, opt for non-parametric alternatives.

Example Workflow

Consider a scenario where a researcher wants to determine whether exercise affects stress levels:

  1. Identify Variables:
    • Independent Variable: Exercise (categorical: yes or no).
    • Dependent Variable: Stress level (continuous).
  2. Choose the Test:
    • Use an independent samples t-test to compare the stress levels of those who exercise versus those who do not.

Practical Considerations

  1. Check Assumptions: Ensure data meets the test’s requirements (e.g., normality, homogeneity of variance).
  2. Visualize Data: Use graphs and descriptive statistics to understand data distribution.
  3. Interpret Results: Use SPSS output tables and charts to draw meaningful conclusions.

Conclusion

Selecting the right statistical test in SPSS is crucial for valid and meaningful results. By understanding your data, research questions, and test assumptions, you can confidently navigate SPSS’s extensive test options. Resources like statistical test lists, flowcharts, and guides help streamline the decision-making process. Whether analyzing correlations, comparing groups, or modeling relationships, SPSS equips researchers with the tools needed for robust statistical analysis.

GetSPSSHelp stands out as a premier choice for SPSS assignment assistance due to its team of highly qualified experts with extensive knowledge in statistical analysis and software usage. The platform is committed to ensuring timely delivery of assignments, even when deadlines are tight, without compromising on quality. By offering personalized solutions tailored to the specific requirements of each student, GetSPSSHelp guarantees accuracy and relevance in every assignment. The service is also highly affordable, combining competitive pricing with premium quality standards. Furthermore, its 24/7 customer support ensures that students receive prompt and reliable assistance, making it a dependable partner for all SPSS-related academic needs.

Needs help with similar assignment?

We are available 24x7 to deliver the best services and assignment ready within 3-4 hours? Order a custom-written, plagiarism-free paper

Get Answer Over WhatsApp Order Paper Now

Fear of Making Mistakes in SPSS|2025

Statistical Package for the Social Sciences (SPSS) is one of the most widely used software for statistical analysis in social sciences, business, health research, and other fields. While SPSS simplifies the process of data manipulation and statistical computation, it can evoke a significant fear of making mistakes, especially among beginners and non-technical users. This fear can arise from a lack of familiarity with statistical methods, the complexity of the software, or the high stakes associated with the interpretation of results.

This paper explores the phenomenon of fear of making mistakes in SPSS, examining its causes, implications, and strategies to mitigate its effects. We will also provide examples to illustrate common errors and their consequences, as well as offer practical advice for overcoming this fear.


Causes of Fear of Making Mistakes in SPSS

Lack of Familiarity with Statistical Concepts

SPSS is a powerful tool for performing complex statistical analyses, but it assumes a certain level of understanding of statistical methods. Users who are not well-versed in statistics may find themselves intimidated by terms like ANOVA, regression, or chi-square tests. The fear of misunderstanding these concepts can make users hesitant to engage with the software fully.

High Stakes of Data Analysis

In academic research, business decision-making, or healthcare studies, the results of statistical analyses can have significant consequences. Researchers often rely on SPSS to derive insights, validate hypotheses, or inform decisions. The fear of producing incorrect results due to errors in SPSS can be daunting.

Complexity of the Software

SPSS offers a broad range of features, from simple descriptive statistics to advanced modeling techniques. Navigating through its menus, dialog boxes, and syntax can be overwhelming for new users. Mistakes in selecting the correct procedure or interpreting outputs can lead to inaccurate results.

Past Experiences and Cognitive Biases

Past negative experiences, such as submitting flawed analyses or being criticized for statistical errors, can reinforce a fear of making mistakes in SPSS. Cognitive biases, such as perfectionism or overgeneralization, may also contribute to this fear.


Examples of Common Mistakes in SPSS and Their Consequences

Misinterpreting Variable Types

One of the most common errors in SPSS is misclassifying variable types. For example, treating a categorical variable as continuous or vice versa can lead to inappropriate statistical tests and misleading results.

Example: A researcher intends to run a chi-square test but mistakenly treats a nominal variable as continuous, leading to the application of a t-test instead. The resulting analysis becomes invalid, potentially undermining the study’s conclusions.

Incorrect Data Entry

Errors in data entry, such as missing values or duplicate entries, can significantly affect the outcome of an analysis. SPSS provides tools to clean and check data, but overlooking these features can result in skewed outputs.

Example: In a dataset of survey responses, a researcher forgets to handle missing data appropriately. Running a regression analysis without addressing these gaps may lead to biased parameter estimates.

Selecting the Wrong Statistical Test

Choosing an inappropriate test for the type of data or research question is a frequent issue among SPSS users.

Example: A student selects a parametric test like a t-test without checking if the data meets the assumptions of normality. This oversight can compromise the validity of the findings.

Misinterpreting Outputs

SPSS generates detailed outputs, including tables, charts, and p-values. Misinterpreting these outputs, such as confusing significance levels or effect sizes, is a common mistake.

Example: A user misinterprets a p-value of 0.05 as evidence of a strong effect size, leading to overstated claims about the study’s results.

Overlooking Assumptions

Statistical tests come with specific assumptions, such as normality, homogeneity of variance, or independence of observations. Ignoring these assumptions can render the analysis invalid.

Example: A researcher conducts an ANOVA without checking for homogeneity of variance, leading to unreliable conclusions about group differences.


Psychological Impacts of Fear of Making Mistakes in SPSS

Procrastination

The fear of errors can lead to procrastination, as users delay engaging with SPSS due to anxiety. This can result in missed deadlines and added stress.

Reduced Confidence

Repeated mistakes or the anticipation of making them can erode a user’s confidence in their ability to perform statistical analyses, creating a vicious cycle of avoidance and underperformance.

Impaired Learning

Fear can hinder the learning process, as users become overly cautious and avoid experimenting with the software. This limits their ability to explore its features and develop proficiency.

Perfectionism

Perfectionism can exacerbate the fear of making mistakes. Users may spend excessive time double-checking every step, which can be counterproductive and exhausting.


Strategies to Overcome Fear of Making Mistakes in SPSS

Building Statistical Literacy

Understanding the basics of statistics is crucial for using SPSS effectively. Online courses, textbooks, and workshops can provide foundational knowledge, reducing anxiety around statistical concepts.

Failiarizing Yourself with SPSS

Taking time to explore SPSS’s interface and features can help demystify the software. Tutorials, online videos, and practice datasets can aid in building confidence.

Starting with Simple Analyses

Beginners should start with simple analyses, such as descriptive statistics or frequency distributions, before progressing to more complex techniques. This gradual approach can help users build competence without feeling overwhelmed.

Seeking Guidance

Consulting with peers, mentors, or statisticians can provide valuable insights and feedback. Many universities and organizations offer statistical consulting services to support SPSS users.

Leveraging Resources

SPSS offers extensive documentation and help features. Online forums, such as IBM’s SPSS Community or platforms like Stack Overflow, can also provide solutions to common problems.

Practicing Error Management

Accepting that mistakes are a natural part of the learning process can reduce anxiety. Users should focus on identifying and correcting errors rather than fearing them. Practicing with dummy datasets can also provide a low-stakes environment for experimentation.

Utilizing Syntax

SPSS Syntax provides a reproducible way to document and review analyses. By saving and revisiting syntax files, users can identify and rectify mistakes more easily.


Fear of Making Mistakes in SPSS

Examples of Overcoming Fear of Mistakes in SPSS

Case 1: Overcoming Misclassification of Variables

A graduate student struggled with classifying variables in SPSS, leading to repeated errors in their analyses. By attending a workshop on data types and practicing with sample datasets, they became more confident in variable classification and reduced their fear of making mistakes.

Case 2: Navigating Complex Analyses

A market researcher found advanced features of SPSS intimidating. They enrolled in an online course focused on regression and multivariate techniques, gradually building their skills. This structured learning approach helped them overcome their apprehension and utilize SPSS more effectively.

Case 3: Leveraging Syntax for Accuracy

A healthcare analyst faced challenges with consistency in their analyses. They began using SPSS Syntax to document their steps and verify their procedures. This not only minimized errors but also enhanced their understanding of the software.


Conclusion

The fear of making mistakes in SPSS is a common but manageable challenge. By understanding its causes and adopting effective strategies, users can build confidence and proficiency in statistical analysis. Mistakes, while inevitable, are valuable learning opportunities that contribute to growth and mastery. With practice, support, and resources, users can overcome their fear and harness the full potential of SPSS for their research and professional endeavors.

GetSPSSHelp stands out as a premier choice for SPSS assignment assistance due to its team of highly qualified experts with extensive knowledge in statistical analysis and software usage. The platform is committed to ensuring timely delivery of assignments, even when deadlines are tight, without compromising on quality. By offering personalized solutions tailored to the specific requirements of each student, GetSPSSHelp guarantees accuracy and relevance in every assignment. The service is also highly affordable, combining competitive pricing with premium quality standards. Furthermore, its 24/7 customer support ensures that students receive prompt and reliable assistance, making it a dependable partner for all SPSS-related academic needs.

Needs help with similar assignment?

We are available 24x7 to deliver the best services and assignment ready within 3-4 hours? Order a custom-written, plagiarism-free paper

Get Answer Over WhatsApp Order Paper Now

Time Management for SPSS Projects|2025

Master Time Management for SPSS Projects with expert tips to plan, organize, and complete your data analysis efficiently. Learn strategies to meet deadlines and enhance project success.

Effective time management is crucial for the successful completion of SPSS (Statistical Package for the Social Sciences) projects. SPSS projects often involve complex data analysis, statistical computations, and the presentation of results, making it essential to optimize the use of time and resources. This paper explores strategies and tools for effective time management, offering practical guidance for individuals and teams working on SPSS projects. Key themes include planning, task prioritization, workflow organization, and the integration of time management tools. For readers seeking a detailed guide, resources such as “Time Management for SPSS Projects PDF Free Download” are also discussed.


Time Management for SPSS Projects

Understanding SPSS Projects

SPSS projects typically encompass various stages, including data collection, preparation, analysis, interpretation, and reporting. Each stage requires a specific set of skills and considerable time investment. Common tasks in SPSS projects include:

  1. Data Collection and Entry: Gathering raw data from surveys, experiments, or databases and entering it into SPSS.
  2. Data Cleaning: Identifying and addressing missing values, outliers, and inconsistencies in the dataset.
  3. Statistical Analysis: Conducting descriptive and inferential statistical tests to extract meaningful insights.
  4. Visualization: Creating charts, graphs, and tables to represent data.
  5. Reporting: Documenting findings and creating reports that communicate results effectively.

Without a structured approach to time management, it is easy to fall behind schedule or overlook critical project components.


The Importance of Time Management in SPSS Projects

Time management directly impacts the quality and efficiency of SPSS projects. Poor time management can result in:

  • Missed deadlines
  • Incomplete or inaccurate analysis
  • Increased stress levels
  • Reduced overall productivity

Conversely, effective time management ensures that:

  • Projects are completed on time and within scope.
  • Resources are utilized efficiently.
  • Work-life balance is maintained, reducing burnout.
  • The quality of analysis and reporting meets academic or professional standards.

For those seeking detailed guides, “Time Management for SPSS Projects PDF Free Download” is a valuable resource that provides structured methodologies for managing time effectively during SPSS projects.


Time Management for SPSS Projects

Key Strategies for Time Management in SPSS Projects

Set Clear Goals and Objectives

Before starting an SPSS project, define clear goals and objectives. Ask yourself:

  • What are the expected outcomes of this project?
  • What statistical techniques will be used?
  • Who are the stakeholders?

Setting clear objectives helps prioritize tasks and allocate time appropriately.

Develop a Project Plan

Create a detailed project plan that outlines:

  • Key milestones
  • Deadlines for each phase
  • Resources required

Use tools like Gantt charts or project management software to visualize timelines and track progress. Many free templates and resources, including “Time Management for SPSS Projects PDF,” can help with project planning.

Break Tasks into Smaller Units

Divide the project into smaller, manageable tasks. For example:

  • Instead of “clean data,” specify tasks such as “remove duplicates,” “address missing values,” and “normalize data.”

Breaking tasks into smaller units makes them less daunting and easier to track.

Prioritize Tasks

Use prioritization techniques like the Eisenhower Matrix to distinguish between urgent and important tasks. For SPSS projects, this could mean prioritizing data cleaning before running analyses or finalizing research questions before designing charts.

Time Management for SPSS Projects

Utilize Time Management Tools

Time management tools can streamline SPSS project workflows. Some popular tools include:

  • Trello or Asana: For task organization and collaboration.
  • Google Calendar: For scheduling and deadline reminders.
  • Pomodoro Timer: To maintain focus and avoid burnout.
  • Excel or SPSS Scripts: For automating repetitive tasks.

Resources like “Time Management for SPSS Projects Free Download” often include templates for time tracking and scheduling.

Automate Repetitive Tasks

Leverage SPSS’s scripting capabilities to automate repetitive tasks, such as data cleaning and generating descriptive statistics. Automation saves time and minimizes errors.

Monitor and Adjust

Regularly review your progress and adjust your plan as needed. Use weekly or bi-weekly reviews to:

  • Identify bottlenecks
  • Reallocate resources
  • Update deadlines

Maintain Work-Life Balance

Avoid overworking yourself or your team. Allocate time for breaks and ensure workloads are reasonable. Work-life balance enhances creativity and productivity.


Time Management for SPSS Projects

Challenges in Time Management for SPSS Projects

Several challenges can impede effective time management:

  1. Complexity of Data Analysis: Advanced statistical techniques often require significant time to understand and implement.
  2. Unpredictable Issues: Unexpected problems, such as corrupted data files or software errors, can disrupt timelines.
  3. Procrastination: Delaying critical tasks can lead to last-minute rushes and suboptimal outcomes.

To overcome these challenges, access resources like “Time Management for SPSS Projects PDF Free Download,” which provides actionable solutions.


Time-Saving Tips for SPSS Projects

  1. Leverage Built-In Functions: SPSS offers numerous built-in functions for statistical tests and data transformations. Familiarize yourself with these to save time.
  2. Use Predefined Templates: Many free SPSS templates are available online, which can accelerate report creation.
  3. Collaborate Effectively: Assign roles and responsibilities to team members to avoid duplication of efforts.
  4. Stay Updated: Regularly update your skills by accessing tutorials, webinars, or resources like “Time Management for SPSS Projects PDF.”

Free Resources for Time Management in SPSS Projects

Numerous free resources are available to aid time management in SPSS projects. These include:

  1. PDF Guides: Search for “Time Management for SPSS Projects PDF Free Download” to access detailed step-by-step guides.
  2. Templates: Use templates for Gantt charts, project plans, and SPSS syntax scripts.
  3. Online Tutorials: Platforms like YouTube and Coursera offer free tutorials on SPSS and time management.
  4. Community Forums: Engage with online communities such as Reddit or SPSS user groups for advice and support.

Time Management for SPSS Projects

Conclusion

Time management is a critical component of successful SPSS projects. By setting clear objectives, planning effectively, and leveraging tools and resources, individuals and teams can enhance productivity and achieve better outcomes. For those seeking additional guidance, resources such as “Time Management for SPSS Projects PDF Free Download” provide practical strategies and templates to streamline workflows. With the right approach, time management can transform the way SPSS projects are handled, ensuring timely and high-quality results.

GetSPSSHelp is the best website for “Time Management for SPSS Projects” because it provides expert guidance to help students efficiently plan and execute their data analysis tasks. The platform offers personalized tips and proven strategies for organizing projects, ensuring timely completion without compromising quality. With step-by-step support and clear instructions, GetSPSSHelp simplifies complex SPSS processes, saving users valuable time. Affordable pricing and high-quality resources make it accessible for students and professionals alike. Additionally, 24/7 customer support ensures that help is always available, making GetSPSSHelp the ultimate resource for managing SPSS projects effectively.

Needs help with similar assignment?

We are available 24x7 to deliver the best services and assignment ready within 3-4 hours? Order a custom-written, plagiarism-free paper

Get Answer Over WhatsApp Order Paper Now

Limited Experience with SPSS Software: Challenges and Opportunities|2025

Limited Experience with SPSS Software: Challenges and Opportunities explores common hurdles beginners face and offers solutions for overcoming them, turning challenges into valuable learning experiences.

The Statistical Package for the Social Sciences (SPSS) is a widely used software suite for statistical analysis in social science, business, health, and other fields. Despite its powerful features and user-friendly interface, many individuals have only limited experience with SPSS software. This paper explores the implications of limited experience with SPSS software, focusing on the challenges faced by beginners, the resources available to overcome these challenges, and strategies for building proficiency. Throughout, the discussion will incorporate terms such as “Limited experience with SPSS software PDF,” “Limited experience with SPSS software free download,” “Limited experience with SPSS software example,” “Limited experience with SPSS software Reddit,” and “Limited experience with SPSS software free.”

Limited Experience with SPSS Software

Introduction to SPSS Software

SPSS software has been a mainstay in data analysis since its introduction in 1968. Its capabilities include data management, statistical analysis, and graphical presentation. However, for those new to the software, its breadth of features can be intimidating. Limited experience with SPSS software is common among students, researchers, and professionals encountering it for the first time. This limited exposure often stems from the lack of formal training, the perceived complexity of statistical concepts, or limited access to resources.

Challenges of Limited Experience with SPSS Software

Steep Learning Curve

One of the primary challenges associated with limited experience with SPSS software is the steep learning curve. Beginners often find it difficult to navigate the software’s interface, interpret output, and apply statistical techniques correctly. For example, creating a data file, entering variables, and selecting appropriate statistical tests can be overwhelming without prior guidance. Searching for “Limited experience with SPSS software example” often leads to tutorials and case studies that demonstrate practical applications, but without foundational knowledge, these examples can still seem confusing.

Lack of Access to Comprehensive Resources

Many individuals struggle with limited experience due to inadequate access to learning materials. Although SPSS tutorials and guides are available, finding high-quality resources can be a challenge. Keywords like “Limited experience with SPSS software PDF” and “Limited experience with SPSS software free download” often lead users to search for accessible documents that outline the basics of SPSS usage. However, such resources are often fragmented, outdated, or require a financial investment that not everyone can afford.

Financial Barriers

SPSS is a commercial product, and the cost of obtaining a license can be prohibitive for students and small organizations. While some universities and institutions provide free access to SPSS software for their students and staff, others do not. This limitation often compels users to seek alternative solutions, such as trial versions or open-source alternatives. Phrases like “Limited experience with SPSS software free” reflect a demand for cost-effective ways to gain proficiency in the software.

Limited Peer Support

Communities such as Reddit often serve as informal learning hubs where users can discuss their challenges and share tips. Searching for “Limited experience with SPSS software Reddit” reveals numerous threads where beginners seek advice on common problems. However, the quality of support varies, and users with limited experience may find it challenging to articulate their questions effectively, further hindering their learning process.

Limited Experience with SPSS Software

Opportunities for Overcoming Limited Experience with SPSS Software

Utilizing Free Resources

For those with limited experience, leveraging free resources can be an effective starting point. Websites offering “Limited experience with SPSS software free download” often provide access to trial versions of the software or free guides and tutorials. In addition, platforms like YouTube host video tutorials that cover everything from basic navigation to advanced statistical analysis.

Learning Through Examples

One of the most effective ways to build proficiency is by studying “Limited experience with SPSS software example” use cases. These examples demonstrate real-world applications of SPSS in fields such as psychology, sociology, and business. By replicating these examples step-by-step, users can gain hands-on experience and build confidence in their abilities.

Engaging with Online Communities

Reddit and other online forums provide opportunities for users to ask questions, share experiences, and learn from others. Searching for “Limited experience with SPSS software Reddit” connects users with communities where they can discuss common challenges and find solutions. These platforms often include detailed responses, links to additional resources, and guidance from experienced users.

Structured Training Programs

For users seeking a more formal learning path, structured training programs offer a comprehensive approach to mastering SPSS. Many universities and online platforms provide courses tailored to beginners. These courses often include downloadable “Limited experience with SPSS software PDF” materials, which serve as valuable references during and after the training.

Strategies for Building Proficiency in SPSS Software

Start with the Basics

Beginners should focus on understanding the fundamental features of SPSS, such as data entry, variable definition, and basic statistical analysis. Free tutorials and “Limited experience with SPSS software free” resources can provide a solid foundation for further learning.

Practice Regularly

Regular practice is essential for building confidence and proficiency. Users can create their own datasets or use publicly available datasets to experiment with various features of SPSS. Practicing with “Limited experience with SPSS software example” scenarios can help reinforce learning.

Seek Feedback

Collaborating with peers or mentors can provide valuable feedback and insights. Sharing work in forums like “Limited experience with SPSS software Reddit” allows users to learn from others’ experiences and gain new perspectives on problem-solving.

Explore Advanced Features Gradually

Once users are comfortable with the basics, they can explore advanced features such as regression analysis, factor analysis, and custom scripting. Advanced resources, including “Limited experience with SPSS software PDF” guides, can help users tackle these topics systematically.

Limited Experience with SPSS Software

Case Study: Overcoming Limited Experience with SPSS Software

A common example of overcoming limited experience involves a graduate student conducting a research project. Initially intimidated by SPSS, the student began by downloading a trial version (“Limited experience with SPSS software free download”) and studying online tutorials. By following “Limited experience with SPSS software example” guides, they gradually learned to input data, run descriptive statistics, and interpret results. Engaging with a Reddit community provided additional support and troubleshooting tips. Over time, the student gained sufficient confidence to complete their analysis and present their findings effectively.

Conclusion

Limited experience with SPSS software is a common hurdle for students and professionals alike. However, with the right resources, strategies, and support, it is possible to overcome these challenges and develop proficiency. By leveraging free resources, studying examples, engaging with online communities, and seeking structured training, users can build the skills necessary to harness the full potential of SPSS software. Whether through a “Limited experience with SPSS software PDF” guide, a “Limited experience with SPSS software Reddit” thread, or hands-on practice, the journey from novice to expert is both achievable and rewarding.

GetSPSSHelp stands out as a premier choice for SPSS assignment assistance due to its team of highly qualified experts with extensive knowledge in statistical analysis and software usage. The platform is committed to ensuring timely delivery of assignments, even when deadlines are tight, without compromising on quality. By offering personalized solutions tailored to the specific requirements of each student, GetSPSSHelp guarantees accuracy and relevance in every assignment. The service is also highly affordable, combining competitive pricing with premium quality standards. Furthermore, its 24/7 customer support ensures that students receive prompt and reliable assistance, making it a dependable partner for all SPSS-related academic needs.

Needs help with similar assignment?

We are available 24x7 to deliver the best services and assignment ready within 3-4 hours? Order a custom-written, plagiarism-free paper

Get Answer Over WhatsApp Order Paper Now

Data Entry Errors in SPSS|2025

Data entry errors in SPSS are a significant concern in data analysis as they can compromise the validity and reliability of research findings. Statistical Package for the Social Sciences (SPSS) is a widely used software for data analysis, but like any tool, it relies on accurate data input. This paper explores common data entry errors in SPSS, methods for data cleaning, and specific techniques for handling missing data, outliers, and univariate analysis. Additionally, we discuss the role of Excel in preliminary data cleaning before importing data into SPSS.


Data Entry Errors in SPSS

Understanding Data Entry Errors in SPSS

Data entry errors occur when incorrect data is entered into the dataset. These errors can result from human mistakes, software glitches, or issues during data transfer from other formats like Excel. Common types of data entry errors include:

  • Typographical errors: Incorrectly typed values, such as entering “550” instead of “50.”
  • Duplicate entries: Repeated rows of data.
  • Out-of-range values: Values that exceed logical or predefined boundaries.
  • Missing data: Blank cells where values should exist.
  • Misaligned data: Errors in column or variable alignment, often caused during data import.

Proper identification and correction of these errors are essential for accurate statistical analysis.


Data Cleaning in SPSS: An Overview

Data cleaning involves detecting and correcting errors or inconsistencies in datasets to ensure the quality and accuracy of the analysis. SPSS provides various tools and methods to assist with this process. The steps include:

Inspecting Data

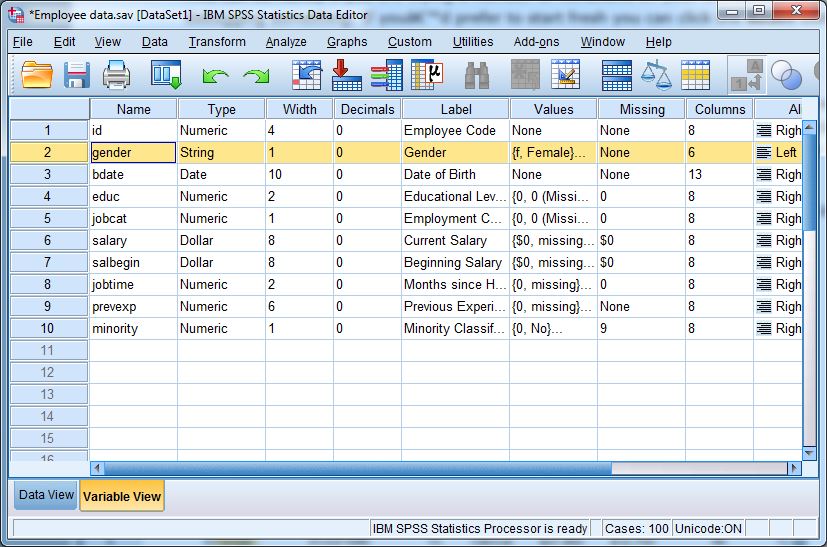
    • Use the Data View and Variable View tabs in SPSS to manually inspect the dataset for visible errors.
    • Generate a Frequency Table to identify outliers, missing data, or unusual distributions.

Handling Missing Data

    • Missing data is a common issue and requires careful handling to avoid bias in the analysis.
    • How to clean missing data in SPSS:
      • Navigate to Analyze > Descriptive Statistics > Frequencies to identify variables with missing values.
      • Use the Missing Values Analysis feature in SPSS for an in-depth examination.
      • Replace missing values with calculated means, medians, or other imputed values using Transform > Replace Missing Values.

Identifying and Correcting Outliers

    • Outliers can distort results and may need to be addressed.
    • Generate Boxplots (via Graphs > Chart Builder) or Descriptive Statistics to detect extreme values.
    • Winsorization is one method to handle outliers, as explained below.

How to Winsorize Data in SPSS

    • Winsorization involves capping extreme values to reduce their impact on the dataset.
    • Use the Compute Variable feature to replace values beyond a certain threshold with the nearest acceptable value.
    • Example steps:
      • Identify the 5th and 95th percentiles using Analyze > Descriptive Statistics > Explore.
      • Apply the computed limits using Transform > Compute Variable.

Data Entry Errors in SPSS

Steps to Clean Data in SPSS

SPSS simplifies data cleaning with its built-in tools. Below is a systematic guide to cleaning data in SPSS:

Import and Review Data

    • Import data from Excel or other sources via File > Open > Data.
    • Use the Variable View to define variable properties such as type, width, and missing values.

Check for Duplicates

    • Use Data > Identify Duplicate Cases to flag duplicate entries.
    • Manually verify flagged cases and remove duplicates if necessary.

Validate Data

    • Set rules for variable values using Data > Validate Data to detect out-of-range or inconsistent entries.

Recode Variables

    • Recode incorrect or inconsistent values using Transform > Recode into Same Variables or Recode into Different Variables.

Save Cleaned Data

    • Save the cleaned dataset as a new file to preserve the original data.

Univariate Analysis in SPSS

Univariate analysis focuses on analyzing individual variables to summarize and understand their characteristics. In SPSS, univariate analysis involves descriptive statistics, graphical analysis, and hypothesis testing.

How to do univariate analysis in SPSS:

Descriptive Statistics

    • Navigate to Analyze > Descriptive Statistics > Frequencies or Descriptives.
    • Generate measures such as mean, median, standard deviation, and range.

Visualizations

    • Create histograms, boxplots, or bar charts using Graphs > Chart Builder to visualize the distribution of a variable.

Outlier Detection

Hypothesis Testing

    • Perform tests such as the one-sample t-test using Analyze > Compare Means > One-Sample T Test to examine specific hypotheses related to the variable.

Data Cleaning in Excel

Before importing data into SPSS, initial cleaning in Excel can save time and effort. Data cleaning in Excel typically involves:

Removing Duplicate Entries

    • Use the Remove Duplicates feature in the Data tab.

Checking for Missing Data

    • Highlight blank cells using conditional formatting to identify gaps.

Standardizing Formats

    • Ensure consistent formats for dates, numbers, and text using Excel’s formatting tools.

Validation Rules

    • Apply data validation to restrict input values to predefined ranges or categories.

Saving for SPSS

    • Save the cleaned dataset in a compatible format, such as .csv or .xls, before importing into SPSS.

Data Entry Errors in SPSS

Automating Data Cleaning in SPSS

SPSS allows automation of repetitive tasks, making data cleaning more efficient. Use syntax commands or the SPSS Syntax Editor for batch processing. Example commands include:

  • Identify Missing Values:
    FREQUENCIES VARIABLES=var1 var2 /MISSING=INCLUDE.
  • Replace Missing Values:
    RECODE var1 (SYSMIS=999).
  • Compute Winsorized Values:
    COMPUTE var1_winsor=MIN(var1, 95th_percentile_value).
    EXECUTE.

Benefits of Proper Data Cleaning

Effective data cleaning ensures:

  • Accuracy: Eliminates errors that can skew analysis results.
  • Consistency: Standardizes data formats and values.
  • Efficiency: Saves time during analysis by reducing the need for rework.
  • Credibility: Increases trust in research findings by ensuring robust data handling.

Data Entry Errors in SPSS

Challenges in Data Cleaning

Despite its importance, data cleaning can be time-consuming and prone to human error. Common challenges include:

  • Handling large datasets: Cleaning extensive datasets requires careful planning and efficient tools.
  • Balancing data integrity and modifications: Over-cleaning can unintentionally remove valuable data.
  • Addressing complex data issues: Identifying and correcting nuanced errors often requires domain expertise.

Conclusion

Data entry errors in SPSS can have significant implications for research outcomes, but with proper data cleaning practices, these issues can be mitigated. Techniques such as missing data handling, winsorization, and univariate analysis help enhance data quality. Combining SPSS with Excel for preliminary cleaning ensures a streamlined workflow. By adopting systematic approaches and leveraging SPSS’s tools, researchers can ensure data integrity and achieve reliable results. For more detailed guidance, refer to resources such as “Data Cleaning SPSS PDF” or explore SPSS tutorials to refine your data management skills.

GetSPSSHelp is the best website for addressing data entry errors in SPSS due to its team of skilled experts who specialize in identifying and correcting common mistakes in datasets. The platform offers thorough and precise error-checking services, ensuring that data integrity is maintained for accurate analysis. GetSPSSHelp’s personalized approach tailors solutions to each student’s specific assignment, providing clear instructions for preventing future errors. With affordable pricing and a focus on quality, students receive expert assistance without breaking their budget. Furthermore, GetSPSSHelp’s 24/7 customer support guarantees immediate help for any SPSS-related concerns, making it the go-to resource for resolving data entry issues.

Needs help with similar assignment?

We are available 24x7 to deliver the best services and assignment ready within 3-4 hours? Order a custom-written, plagiarism-free paper

Get Answer Over WhatsApp Order Paper Now

Interpreting SPSS Output: A Comprehensive Guide|2025

Interpreting SPSS Output: A Comprehensive Guide provides step-by-step instructions on how to analyze and understand SPSS results. Master key concepts and improve your data interpretation skills for accurate research findings.

Statistical Package for the Social Sciences (SPSS) is a powerful tool for data analysis that provides researchers with a wealth of information. However, interpreting SPSS output can be challenging for those unfamiliar with its layout and terminology. This paper provides an in-depth guide to interpreting SPSS output, with examples and insights into its application in research. Topics covered include regression analysis, descriptive statistics, and the use of SPSS in various research scenarios. Additionally, references to PDFs and online resources are provided for further understanding.


Interpreting SPSS Output

Importance of Interpreting SPSS Output in Research

SPSS is widely used in academic, social, and business research. The ability to interpret SPSS output effectively is crucial for:

  1. Understanding Research Results: SPSS output helps researchers derive meaningful insights from raw data.
  2. Supporting Decision-Making: In business, SPSS analyses can guide strategic decisions.
  3. Ensuring Accurate Reporting: Proper interpretation ensures accurate representation of findings in publications.

Components of SPSS Output

SPSS generates various tables and charts as part of its output. Below are key components commonly encountered in SPSS analyses:

Descriptive Statistics

Descriptive statistics provide a summary of the dataset, including measures like mean, median, standard deviation, and range. Here’s how to interpret these elements:

  • Mean: The average value of the dataset.
  • Standard Deviation: Indicates the spread of data around the mean. A smaller standard deviation suggests less variability.
  • Range: The difference between the maximum and minimum values.

Example: A table showing descriptive statistics might display the mean income of respondents as $50,000, with a standard deviation of $10,000, indicating moderate variability.

Frequency Tables

Frequency tables summarize categorical data, showing the count and percentage of each category.

Example: A frequency table for gender might display:

Gender Frequency Percentage
Male 150 60%
Female 100 40%

Cross-Tabulation

Cross-tabulation tables examine relationships between two categorical variables. The chi-square statistic often accompanies these tables to test for significance.

Example: A cross-tabulation might reveal the relationship between gender and preference for a product, with a chi-square value indicating whether the association is statistically significant.


Interpreting SPSS Output

How to Interpret Regression Results in SPSS

Regression analysis is one of the most commonly used statistical methods in SPSS. Understanding how to interpret regression output is critical for explaining relationships between variables.

Key Elements of Regression Output

Model Summary Table

    • R: Correlation coefficient indicating the strength of the relationship.
    • R Square: Proportion of variance in the dependent variable explained by the independent variables.
    • Adjusted R Square: Adjusted for the number of predictors; more reliable for small samples.

Example: An R Square value of 0.65 suggests that 65% of the variance in the dependent variable is explained by the model.

ANOVA Table

    • Tests the overall significance of the model.
    • The F-statistic and its p-value indicate whether the model significantly predicts the dependent variable.

Example: An F-statistic of 12.34 with a p-value of 0.001 implies the model is significant.

Coefficients Table

    • Provides estimates for each predictor variable.
    • Unstandardized Coefficients (B): Show the effect of each predictor in its original units.
    • Standardized Coefficients (Beta): Allow comparison of the relative importance of predictors.
    • p-value: Indicates whether the predictor is statistically significant.

Example: If the unstandardized coefficient for education level is 0.5 and its p-value is 0.03, a one-unit increase in education level is associated with a 0.5-unit increase in income, assuming other variables are constant.

Multiple Regression SPSS Output Interpretation

Multiple regression involves more than one independent variable. The interpretation process is similar but focuses on:

  • Multicollinearity: Ensure predictors are not highly correlated (check Variance Inflation Factor, VIF).
  • Interaction Terms: Investigate if predictors interact to affect the dependent variable.

Example: A multiple regression model predicting job satisfaction might include predictors like salary, work environment, and tenure, with coefficients showing their individual contributions.


SPSS Analysis and Interpretation in Research

SPSS output is central to presenting research findings. Below are some key areas where SPSS analysis is commonly applied:

Survey Analysis

Survey data often involve frequencies, descriptive statistics, and cross-tabulations. Interpreting these outputs ensures that trends and patterns are accurately reported.

Example: Analyzing a survey on consumer preferences might involve comparing mean satisfaction scores across different demographics.

Experimental Research

SPSS output in experiments often includes ANOVA or t-tests to compare group means.

Example: A study comparing test scores across teaching methods might use SPSS to determine if differences are statistically significant.

Predictive Modeling

Regression analysis in SPSS helps predict outcomes based on independent variables.

Example: Predicting employee turnover based on factors like workload and job satisfaction.


Online Resources and PDFs for SPSS Output Interpretation

Numerous online resources and downloadable PDFs are available to aid in understanding SPSS output. These include tutorials, guides, and examples:

  1. Interpreting SPSS Output PDF: Comprehensive documents that explain each component of SPSS output.
    • Example: A downloadable guide detailing how to interpret regression and ANOVA results.
  2. Interpreting SPSS Output Example: Online examples of SPSS outputs with step-by-step interpretations.
    • Example: A blog post demonstrating how to interpret cross-tabulation results.
  3. SPSS Output Interpretation Online: Websites offering interactive tools and forums for discussing SPSS output.
    • Example: Communities like ResearchGate where researchers share insights.
  4. SPSS Analysis and Interpretation PDF: Step-by-step instructions for conducting and interpreting specific analyses.
    • Example: A tutorial on logistic regression available as a PDF.

Interpreting SPSS Output

Common Challenges in Interpreting SPSS Output

Despite its user-friendly interface, interpreting SPSS output can be daunting. Below are some common challenges and tips to overcome them:

Misinterpreting Significance

  • Challenge: Confusing statistical significance with practical significance.
  • Solution: Always consider effect sizes alongside p-values.

Overlooking Assumptions

  • Challenge: Ignoring assumptions like normality or homoscedasticity.
  • Solution: Use diagnostic tests (e.g., residual plots) to validate assumptions.

Complex Output

  • Challenge: Large datasets generate extensive output, making it hard to focus.
  • Solution: Filter output to show only relevant tables and charts.

Conclusion

Interpreting SPSS output is a vital skill for researchers across disciplines. By understanding descriptive statistics, regression results, and other key components, researchers can derive meaningful insights and support their findings. Resources such as online tutorials and PDFs provide valuable support for mastering SPSS interpretation. Whether analyzing survey data or conducting predictive modeling, a systematic approach ensures accurate and impactful results.

GetSPSSHelp is the best website for interpreting SPSS output because it offers expert guidance tailored to help students understand and analyze SPSS results with ease. The platform’s experienced professionals break down complex statistical outputs into simple, actionable insights, ensuring clarity in interpretation. GetSPSSHelp provides step-by-step explanations and practical tips to help students grasp the significance of their findings, improving their data analysis skills. With affordable rates and a commitment to quality, students can rely on GetSPSSHelp for comprehensive support. The platform’s 24/7 customer service ensures that students can receive assistance whenever needed, making it a go-to resource for mastering SPSS output interpretation.

Needs help with similar assignment?

We are available 24x7 to deliver the best services and assignment ready within 3-4 hours? Order a custom-written, plagiarism-free paper

Get Answer Over WhatsApp Order Paper Now

Examples of SPSS Assignments for College Students|2025

Explore examples of SPSS assignments for college students, with detailed solutions and step-by-step guidance. Learn how to approach various types of SPSS tasks to enhance your understanding and improve academic performance.

SPSS (Statistical Package for the Social Sciences) is a powerful statistical software used for data analysis in various academic fields, including social sciences, psychology, health sciences, business, and more. College students often encounter assignments that require them to apply SPSS for data analysis, interpretation, and reporting. This paper explores examples of SPSS assignments for college students and offers insights into the types of tasks that are commonly assigned, the benefits of using SPSS in academic work, and how students can excel in SPSS-based assignments.

Introduction

SPSS is one of the most widely used statistical tools in both educational and professional settings. It is particularly popular in higher education due to its user-friendly interface and robust analytical capabilities. As students progress through their college courses, they are often required to complete assignments that involve data analysis using SPSS. These assignments can range from basic descriptive statistics to more complex inferential tests and regression analyses. The goal of these assignments is not only to enhance students’ understanding of statistical concepts but also to improve their ability to use statistical software for real-world data analysis.

This paper will discuss various types of SPSS assignments, including descriptive and inferential statistical tasks, the preparation of reports, and data analysis for questionnaires. Additionally, the paper will provide resources and examples that can guide students in completing SPSS assignments, such as Examples of SPSS assignments for college students PDF, Examples of SPSS assignments for college students PPT, and SPSS assignment PDF.

Types of SPSS Assignments for College Students

Descriptive Statistics Assignments

Descriptive statistics are often the first step in data analysis. These assignments help students summarize and describe the features of a data set. Common descriptive statistics include measures such as the mean, median, mode, range, and standard deviation. SPSS provides an intuitive interface for computing these statistics.

Example Assignment:

  • A common assignment might ask students to collect data on a particular topic (e.g., survey data on student satisfaction) and compute the descriptive statistics for various variables.
  • The assignment could require students to generate frequency tables, bar charts, histograms, and descriptive statistics such as mean and standard deviation for the dataset.
  • The assignment might also ask students to interpret the results, for example, identifying trends or patterns within the data.

Example of SPSS Assignment for College Students PDF: A PDF resource may be provided by the instructor to guide students through the process of entering data into SPSS, computing descriptive statistics, and interpreting the results. Such documents can also include step-by-step instructions, screenshots, and sample output.

Inferential Statistics Assignments

Inferential statistics involve drawing conclusions about a population based on a sample. Students often perform hypothesis testing, t-tests, ANOVA (analysis of variance), and chi-square tests in their assignments. These tasks help students understand how to test research hypotheses and make inferences from sample data.

Example Assignment:

  • A typical inferential statistics assignment might involve testing whether there is a significant difference in test scores between two groups of students (e.g., students who received tutoring vs. those who did not).
  • The student would conduct an independent t-test in SPSS, report the test statistics, and interpret the results, discussing whether the null hypothesis is rejected or not.
  • Alternatively, an assignment might ask students to perform a one-way ANOVA to compare the means of more than two groups, such as comparing the effectiveness of different teaching methods on student performance.

SPSS Data Analysis Examples PDF Free Download: These downloadable resources might provide sample datasets and detailed instructions for performing hypothesis testing using SPSS. Students can practice by following the examples and using the provided data files.

Examples of SPSS Assignments for College Students

Regression Analysis Assignments

Regression analysis is used to model the relationship between one or more independent variables and a dependent variable. SPSS offers tools for both simple and multiple regression analysis, allowing students to explore how different factors influence outcomes.

Example Assignment:

  • An assignment could ask students to perform a multiple regression analysis to predict a student’s academic performance based on factors such as study hours, participation in extracurricular activities, and socioeconomic status.
  • The student would need to enter the data into SPSS, run the regression analysis, and interpret the regression coefficients, R-squared value, and p-values to determine the strength and significance of the predictors.

SPSS Assignment PDF: A typical SPSS assignment PDF for regression analysis would outline how to perform the analysis, interpret the output, and report the findings. The document would include a sample dataset and guide students through the process of entering data, checking assumptions (e.g., linearity, homoscedasticity), and making predictions.

SPSS Report Writing Assignments

In many cases, students are required not only to perform statistical analyses but also to write a report summarizing their findings. SPSS report writing assignments help students develop their ability to communicate statistical results effectively, which is an essential skill in both academic and professional contexts.

Example Assignment:

  • A report writing assignment might ask students to analyze survey data and write a comprehensive report that includes an introduction, methodology, results, and discussion sections.
  • Students would need to summarize their data analysis in a clear and concise manner, presenting tables, figures, and statistical results to support their conclusions.
  • The assignment could require students to use proper APA formatting for reporting statistical results and citations.

SPSS Report Writing Sample: A sample report would show students how to format and present their findings, including how to report statistical tests, effect sizes, and confidence intervals. It might also offer advice on how to discuss the implications of the results and how to relate the findings back to the research question.

  1. Data Analysis for Questionnaire AssignmentsCollege students frequently use SPSS to analyze data from surveys or questionnaires. These assignments are designed to help students understand how to analyze responses to various types of questions, including multiple-choice, Likert scale, and open-ended questions.

    Example Assignment:

    • Students may be asked to design a questionnaire, collect data from respondents, and then use SPSS to analyze the responses.
    • Tasks might include computing descriptive statistics for each item on the questionnaire, performing reliability analysis (e.g., Cronbach’s alpha) to assess internal consistency, and conducting factor analysis to identify underlying constructs.

    SPSS Analysis for Questionnaire PDF: A PDF resource might be provided with detailed instructions for setting up and analyzing questionnaire data in SPSS. The guide would explain how to clean and preprocess the data, handle missing values, and perform various analyses based on the type of questions included in the questionnaire.

Examples of SPSS Assignments for College Students

Resources for SPSS Assignments

Students looking for additional resources to help them complete SPSS assignments can benefit from a variety of free materials available online. Here are some helpful resources:

  1. Examples of SPSS Assignments for College Students PDF: Many universities and online platforms offer downloadable PDFs with SPSS exercises and sample assignments. These documents often include step-by-step instructions and datasets to help students learn how to use SPSS effectively.
  2. Examples of SPSS Assignments for College Students PPT: PowerPoint presentations are often used to teach SPSS concepts in a classroom setting. These presentations may include examples of SPSS outputs, visualizations, and explanations of how to interpret results. Students can use these presentations as reference material when completing their assignments.
  3. SPSS Data Analysis Examples PDF: This resource typically provides detailed explanations of various SPSS analyses, such as t-tests, ANOVA, regression, and chi-square tests, with examples of how to perform these analyses using SPSS. Such documents are useful for students who want to practice and understand different types of analyses.
  4. SPSS Assignment PDF Free: Several websites offer free downloadable assignments and datasets that allow students to practice their SPSS skills. These assignments typically come with instructions, data files, and questions that require students to perform specific analyses using SPSS.

Conclusion

SPSS assignments for college students are an essential part of learning how to apply statistical methods to real-world data. Whether students are working on descriptive statistics, hypothesis testing, regression analysis, report writing, or questionnaire analysis, SPSS provides the tools necessary to complete these tasks efficiently. By using resources such as Examples of SPSS assignments for college students PDF, Examples of SPSS assignments for college students PPT, and SPSS data analysis examples PDF, students can gain a deeper understanding of statistical analysis and improve their proficiency with SPSS.

Successful completion of SPSS assignments not only helps students develop technical skills in data analysis but also prepares them for future careers in research, data science, business, and other fields that rely on data-driven decision-making. The ability to use SPSS effectively is a valuable asset in the academic and professional worlds, and students who excel in SPSS assignments will be well-prepared for the challenges of data analysis in their future endeavors.

Needs help with similar assignment?

We are available 24x7 to deliver the best services and assignment ready within 3-4 hours? Order a custom-written, plagiarism-free paper

Get Answer Over WhatsApp Order Paper Now

Custom SPSS Assignment Help for Research Projects|2025

Get custom SPSS assignment help for research projects with tailored solutions from expert statisticians. Ensure accurate data analysis and high-quality results to meet the specific needs of your research assignments.

When engaging in research projects, particularly in fields like social sciences, psychology, business, and health studies, data analysis plays a crucial role. One of the most popular and versatile tools used for statistical analysis is SPSS (Statistical Package for the Social Sciences). SPSS provides researchers with powerful features to analyze data, produce graphs, and interpret statistical results, all of which are essential components of the research methodology. However, not every researcher is well-versed in the intricacies of SPSS or may lack the time to complete the analysis for a particular project. This leads to the growing demand for SPSS assignment help, where researchers seek guidance and support from professionals to perform complex SPSS analyses or even complete assignments on their behalf.

In this paper, we will explore how to get custom SPSS assignment help, the benefits of seeking such help, and the impact it has on research projects. We will also discuss the process of using SPSS in research methodology and how researchers can navigate the challenges of working with SPSS for data analysis.

Custom SPSS Assignment Help for Research Projects

SPSS: A Powerful Tool for Research Methodology

SPSS is widely recognized as one of the most robust statistical software tools available for researchers. It is particularly useful for data management, data analysis, and the creation of visual representations of the results. SPSS can handle various types of data, including qualitative and quantitative data, and supports an array of statistical tests such as descriptive statistics, regression analysis, t-tests, ANOVA, and chi-square tests, among others.

Research methodology typically involves several steps, including data collection, data analysis, and interpretation. The use of SPSS in research methodology allows researchers to streamline these processes by providing the tools needed for accurate analysis. From cleaning raw data to producing reliable statistical results, SPSS can significantly enhance the overall research process.

For instance, in a research project involving survey data, SPSS can assist researchers in organizing and analyzing the responses, while also offering graphical representations of the findings. Additionally, SPSS offers various techniques for hypothesis testing, ensuring that researchers can draw valid conclusions based on their data.

Common Challenges in Using SPSS for Research

While SPSS is a powerful tool, it is not without its challenges. Many researchers, particularly those new to statistical analysis or unfamiliar with SPSS, may find it difficult to navigate the software and fully understand how to interpret the results. Some common challenges that researchers face when using SPSS for research include:

  1. Understanding the Interface: The SPSS interface can be intimidating to beginners. While the software offers a range of features, understanding where to find the appropriate tools and how to use them effectively can be overwhelming.
  2. Data Preparation: Before analysis can begin, researchers need to prepare their data in a way that SPSS can process effectively. This involves tasks such as cleaning the data, handling missing values, and formatting variables correctly. Incorrect data preparation can lead to inaccurate results.
  3. Selecting the Right Statistical Test: SPSS offers a wide variety of statistical tests, and choosing the right one for a particular research project is not always straightforward. Incorrectly selecting a test can lead to invalid conclusions.
  4. Interpreting Output: SPSS generates detailed output, but interpreting the results can be challenging for researchers who lack statistical expertise. Without proper guidance, it can be difficult to determine whether the results are significant or how they should be presented in the research.
  5. Time Constraints: Research projects often come with tight deadlines, and researchers may not have sufficient time to learn how to use SPSS effectively or to perform the necessary analysis.

Custom SPSS Assignment Help for Research Projects

Can I Pay Someone to Do an SPSS Analysis?

Given the challenges researchers face when using SPSS, many opt to seek external help to ensure that their analysis is done correctly and on time. The question often arises: Can I pay someone to do an SPSS analysis?” The answer is yes, and this has become a common practice among students and researchers who need professional assistance with SPSS data analysis.

There are several advantages to paying someone for SPSS analysis:

  • Expert Guidance: Professional SPSS analysts have extensive experience with the software and statistical techniques. By hiring an expert, researchers can ensure that the analysis is conducted correctly, avoiding the pitfalls that come with a lack of experience.
  • Time-Saving: Research projects can be time-consuming, and performing an SPSS analysis can take hours or even days, especially for complex datasets. Outsourcing the task allows researchers to focus on other aspects of their project, such as writing the research paper or interpreting the findings.
  • Accuracy and Reliability: Professionals who specialize in SPSS analysis are adept at handling large datasets and ensuring that the statistical tests are applied correctly. This leads to more accurate and reliable results.
  • Tailored Support: Some services offer custom SPSS assignment help, where the analysis is tailored to the specific needs of the research project. This ensures that the results align with the research objectives and methodology.

Do My SPSS Homework for Me?

For students who are taking courses that require proficiency in SPSS, the demand for Do my SPSS homework for me?” is growing. Many students struggle to keep up with coursework due to the complexity of SPSS, especially when they lack prior experience or when the coursework involves advanced statistical techniques.

There are several reasons why students may seek assistance with their SPSS homework:

  1. Lack of Understanding: Some students may not fully grasp the concepts behind statistical analysis and are unsure how to apply SPSS to real-world data.
  2. Time Constraints: Students often juggle multiple assignments and deadlines. Paying someone to complete their SPSS homework can help them manage their workload more effectively.
  3. Desire for Better Grades: Students aiming for higher grades may seek professional help to ensure that their SPSS assignments are completed accurately and meet the required standards.
  4. Complexity of the Assignment: Some SPSS assignments involve advanced statistical techniques, such as multivariate analysis, regression models, or factor analysis. These can be difficult to execute without expertise.

Benefits of Professional Homework Assistance:

  • High-Quality Work: By hiring experts, students can receive high-quality work that adheres to the assignment requirements and academic standards.
  • Timely Delivery: With tight deadlines in many academic settings, professional services ensure that assignments are completed and delivered on time, eliminating the stress of last-minute submissions.
  • Step-by-Step Explanations: Many services provide students with step-by-step guides to help them understand the analysis process, thus enhancing their learning experience.
  • Customized Solutions: Custom help means the SPSS homework is tailored to the specific needs of the assignment, ensuring that the student receives a personalized and relevant solution.

Custom SPSS Assignment Help for Research Projects

How to Get Help with SPSS?

For those who need help with SPSS, whether it be for research projects, coursework, or other types of analysis, several options are available:

  1. Online Tutoring Services: Many online platforms offer tutoring services for SPSS, where experts provide one-on-one support to help with data analysis, interpretation, and report writing. These services are typically flexible and can be tailored to the student’s needs.
  2. Academic Writing Services: Some academic writing services specialize in SPSS analysis. These services may offer comprehensive help, from data collection and analysis to writing the results and conclusions. Among the leading SPSS Help Writing Services is GetSPSSHelp.com.
  3. Freelancers: Freelancers who specialize in data analysis and SPSS are another option. Websites like Upwork or Fiverr allow researchers to find experienced analysts who can perform specific tasks for their project, such as conducting statistical tests or creating reports.
  4. Peer Support: Some researchers or students may seek help from their peers, professors, or colleagues who are familiar with SPSS. While this option may not always be as professional as others, it can be helpful in providing guidance and insights.
  5. Online Forums and Communities: Online forums and communities, such as Stack Overflow or Reddit, can also provide valuable help with SPSS. Users often share tips, solutions, and insights on common issues faced during data analysis.

Using SPSS in Research Methodology

In the context of research methodology, SPSS plays a pivotal role in several stages of the research process. Researchers can use SPSS to:

1. Data Cleaning and Preparation: SPSS offers a range of tools for organizing and cleaning data, ensuring that it is ready for analysis. This includes identifying and handling missing values, correcting errors, and transforming variables.

2. Descriptive Statistics: SPSS can generate descriptive statistics, such as mean, median, standard deviation, and frequency distributions. These statistics help researchers summarize and understand the key characteristics of their data.

3. Hypothesis Testing: SPSS makes it easy for researchers to perform hypothesis testing using various statistical tests, including t-tests, ANOVA, and chi-square tests. These tests help researchers determine whether their hypotheses are supported by the data.

4. Regression and Correlation Analysis: Researchers can use SPSS for regression analysis to explore relationships between variables. This is particularly useful in fields like psychology, economics, and business.

5. Data Visualization: SPSS allows researchers to create graphs and charts that visually represent the data and the results of statistical analyses. Visualizations help communicate findings more effectively.

6. Reporting and Interpretation: The output generated by SPSS can be used in research reports to support findings and conclusions. Researchers must learn how to interpret the results accurately to ensure valid conclusions.

Custom SPSS Assignment Help for Research Projects

Conclusion

Custom SPSS assignment help is an invaluable resource for researchers, students, and professionals who face challenges in data analysis and need assistance with SPSS. Whether you’re asking Can I pay someone to do an SPSS analysis? or seeking answers to How to get help with SPSS?, there are many avenues available to get the support you need.

SPSS is a powerful tool in research methodology, but its complexity can pose a challenge for many. By leveraging professional assistance, researchers can save time, improve the accuracy of their results, and ensure that their data analysis meets the highest standards. The ability to use SPSS effectively is essential for producing high-quality research that can make a significant contribution to the field. Whether through expert help, online services, or peer support, there are many ways to access the guidance needed to navigate the world of SPSS analysis.

Needs help with similar assignment?

We are available 24x7 to deliver the best services and assignment ready within 3-4 hours? Order a custom-written, plagiarism-free paper

Get Answer Over WhatsApp Order Paper Now