Time Management for SPSS Projects|2025
Master Time Management for SPSS Projects with expert tips to plan, organize, and complete your data analysis efficiently. Learn strategies to meet deadlines and enhance project success.
Effective time management is crucial for the successful completion of SPSS (Statistical Package for the Social Sciences) projects. SPSS projects often involve complex data analysis, statistical computations, and the presentation of results, making it essential to optimize the use of time and resources. This paper explores strategies and tools for effective time management, offering practical guidance for individuals and teams working on SPSS projects. Key themes include planning, task prioritization, workflow organization, and the integration of time management tools. For readers seeking a detailed guide, resources such as “Time Management for SPSS Projects PDF Free Download” are also discussed.
Understanding SPSS Projects
SPSS projects typically encompass various stages, including data collection, preparation, analysis, interpretation, and reporting. Each stage requires a specific set of skills and considerable time investment. Common tasks in SPSS projects include:
- Data Collection and Entry: Gathering raw data from surveys, experiments, or databases and entering it into SPSS.
- Data Cleaning: Identifying and addressing missing values, outliers, and inconsistencies in the dataset.
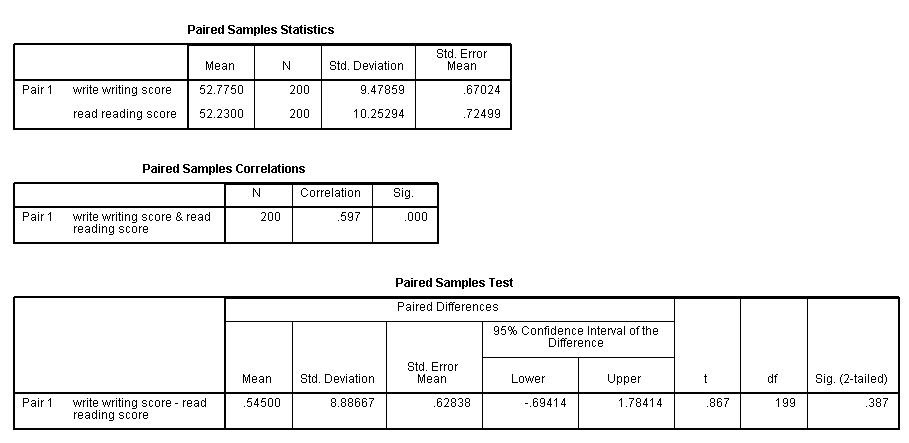
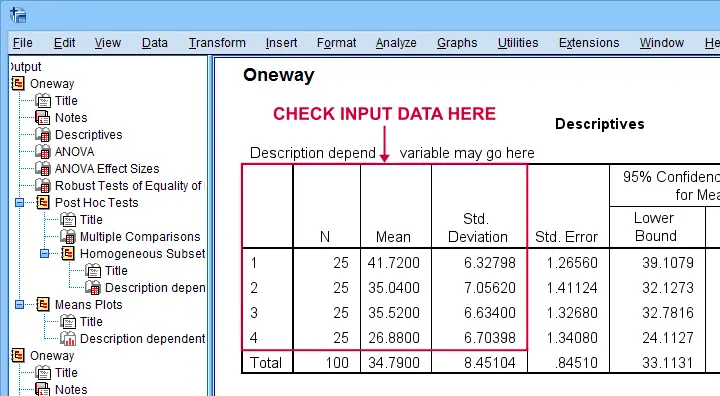
- Statistical Analysis: Conducting descriptive and inferential statistical tests to extract meaningful insights.
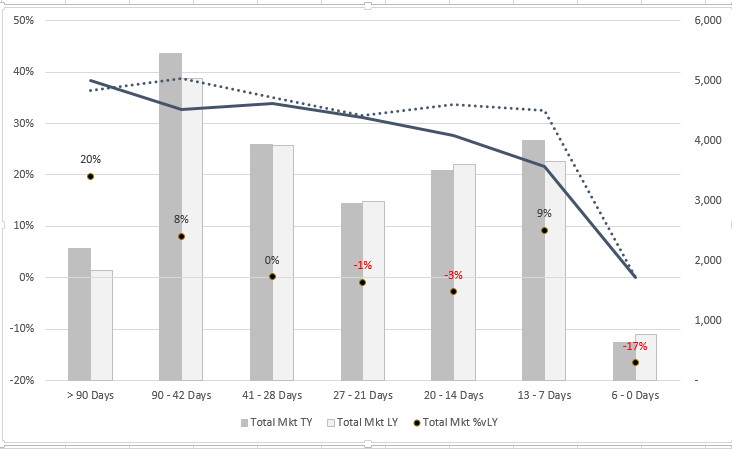
- Visualization: Creating charts, graphs, and tables to represent data.
- Reporting: Documenting findings and creating reports that communicate results effectively.
Without a structured approach to time management, it is easy to fall behind schedule or overlook critical project components.
The Importance of Time Management in SPSS Projects
Time management directly impacts the quality and efficiency of SPSS projects. Poor time management can result in:
- Missed deadlines
- Incomplete or inaccurate analysis
- Increased stress levels
- Reduced overall productivity
Conversely, effective time management ensures that:
- Projects are completed on time and within scope.
- Resources are utilized efficiently.
- Work-life balance is maintained, reducing burnout.
- The quality of analysis and reporting meets academic or professional standards.
For those seeking detailed guides, “Time Management for SPSS Projects PDF Free Download” is a valuable resource that provides structured methodologies for managing time effectively during SPSS projects.
Key Strategies for Time Management in SPSS Projects
Set Clear Goals and Objectives
Before starting an SPSS project, define clear goals and objectives. Ask yourself:
- What are the expected outcomes of this project?
- What statistical techniques will be used?
- Who are the stakeholders?
Setting clear objectives helps prioritize tasks and allocate time appropriately.
Develop a Project Plan
Create a detailed project plan that outlines:
- Key milestones
- Deadlines for each phase
- Resources required
Use tools like Gantt charts or project management software to visualize timelines and track progress. Many free templates and resources, including “Time Management for SPSS Projects PDF,” can help with project planning.
Break Tasks into Smaller Units
Divide the project into smaller, manageable tasks. For example:
- Instead of “clean data,” specify tasks such as “remove duplicates,” “address missing values,” and “normalize data.”
Breaking tasks into smaller units makes them less daunting and easier to track.
Prioritize Tasks
Use prioritization techniques like the Eisenhower Matrix to distinguish between urgent and important tasks. For SPSS projects, this could mean prioritizing data cleaning before running analyses or finalizing research questions before designing charts.

Utilize Time Management Tools
Time management tools can streamline SPSS project workflows. Some popular tools include:
- Trello or Asana: For task organization and collaboration.
- Google Calendar: For scheduling and deadline reminders.
- Pomodoro Timer: To maintain focus and avoid burnout.
- Excel or SPSS Scripts: For automating repetitive tasks.
Resources like “Time Management for SPSS Projects Free Download” often include templates for time tracking and scheduling.
Automate Repetitive Tasks
Leverage SPSS’s scripting capabilities to automate repetitive tasks, such as data cleaning and generating descriptive statistics. Automation saves time and minimizes errors.
Monitor and Adjust
Regularly review your progress and adjust your plan as needed. Use weekly or bi-weekly reviews to:
- Identify bottlenecks
- Reallocate resources
- Update deadlines
Maintain Work-Life Balance
Avoid overworking yourself or your team. Allocate time for breaks and ensure workloads are reasonable. Work-life balance enhances creativity and productivity.
Challenges in Time Management for SPSS Projects
Several challenges can impede effective time management:
- Complexity of Data Analysis: Advanced statistical techniques often require significant time to understand and implement.
- Unpredictable Issues: Unexpected problems, such as corrupted data files or software errors, can disrupt timelines.
- Procrastination: Delaying critical tasks can lead to last-minute rushes and suboptimal outcomes.
To overcome these challenges, access resources like “Time Management for SPSS Projects PDF Free Download,” which provides actionable solutions.
Time-Saving Tips for SPSS Projects
- Leverage Built-In Functions: SPSS offers numerous built-in functions for statistical tests and data transformations. Familiarize yourself with these to save time.
- Use Predefined Templates: Many free SPSS templates are available online, which can accelerate report creation.
- Collaborate Effectively: Assign roles and responsibilities to team members to avoid duplication of efforts.
- Stay Updated: Regularly update your skills by accessing tutorials, webinars, or resources like “Time Management for SPSS Projects PDF.”
Free Resources for Time Management in SPSS Projects
Numerous free resources are available to aid time management in SPSS projects. These include:
- PDF Guides: Search for “Time Management for SPSS Projects PDF Free Download” to access detailed step-by-step guides.
- Templates: Use templates for Gantt charts, project plans, and SPSS syntax scripts.
- Online Tutorials: Platforms like YouTube and Coursera offer free tutorials on SPSS and time management.
- Community Forums: Engage with online communities such as Reddit or SPSS user groups for advice and support.
Conclusion
Time management is a critical component of successful SPSS projects. By setting clear objectives, planning effectively, and leveraging tools and resources, individuals and teams can enhance productivity and achieve better outcomes. For those seeking additional guidance, resources such as “Time Management for SPSS Projects PDF Free Download” provide practical strategies and templates to streamline workflows. With the right approach, time management can transform the way SPSS projects are handled, ensuring timely and high-quality results.
Needs help with similar assignment?
We are available 24x7 to deliver the best services and assignment ready within 3-4 hours? Order a custom-written, plagiarism-free paper