SPSS Assignment Help: Hypothesis Testing and Regression Analysis|2025
Statistical analysis is at the heart of modern research, enabling analysts, researchers, and students to make informed decisions based on data. Among the tools available for statistical analysis, IBM SPSS (Statistical Package for the Social Sciences) stands out as one of the most widely used and robust software solutions. Its ease of use, combined with powerful capabilities, makes it a preferred choice for hypothesis testing and regression analysis. This article provides comprehensive SPSS assignment help for hypothesis testing and regression analysis, focusing on commonly searched topics and practical applications.
What is SPSS?
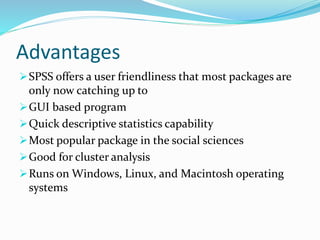
SPSS is a statistical software package designed for data management, statistical analysis, and graphical presentation. Originally developed for social sciences research, SPSS is now extensively used across various disciplines, including psychology, business, healthcare, and education. Its user-friendly interface and versatility make it an invaluable tool for both beginners and advanced users.
Understanding Hypothesis Testing in SPSS

What is Hypothesis Testing?
Hypothesis testing is a statistical method used to determine whether there is enough evidence to support a specific claim or hypothesis about a dataset. It involves:
- Null Hypothesis (H0): A statement suggesting no effect or no difference.
- Alternative Hypothesis (H1): A statement suggesting an effect or a difference.
- Significance Level (α): A threshold (commonly 0.05) used to decide whether to reject the null hypothesis.
- P-Value: The probability of observing the data given that the null hypothesis is true.
Steps for Hypothesis Testing in SPSS
- Input Your Data: Start by entering your dataset into SPSS or importing it from formats like Excel, CSV, or SQL.
- Select the Appropriate Test: Choose the statistical test based on your research question and data type. Common tests include:
- T-tests (Independent, Paired, or One-sample)
- ANOVA (Analysis of Variance)
- Chi-square tests
- Correlation tests
- Run the Test: Navigate to the appropriate menu in SPSS, input test parameters, and execute the test.
- Interpret Results: Examine output tables to interpret the p-value and test statistics.
Commonly Used Hypothesis Tests in SPSS
T-tests
T-tests are used to compare the means of two groups. They are ideal for determining whether a significant difference exists between group means.
How to Perform a T-test in SPSS:
- Go to “Analyze” > “Compare Means” > “Independent-Samples T Test.”
- Select the test variable (dependent) and grouping variable (independent).
- Define groups and run the analysis.
ANOVA (Analysis of Variance)
ANOVA is used to compare means across multiple groups. One-way ANOVA tests the effect of a single factor, while two-way ANOVA evaluates two factors simultaneously.
Steps in SPSS:
- Navigate to “Analyze” > “Compare Means” > “One-Way ANOVA.”
- Specify the dependent variable and factor(s).
- Run the analysis and interpret the F-statistic and p-value.
Chi-square Test
The Chi-square test assesses relationships between categorical variables.
Steps in SPSS:
- Go to “Analyze” > “Descriptive Statistics” > “Crosstabs.”
- Check the Chi-square box under “Statistics.”
- Run and interpret results.
Correlation Tests
Correlation tests measure the strength and direction of relationships between variables.
Steps in SPSS:
- Select “Analyze” > “Correlate” > “Bivariate.”
- Choose variables and run the test.
Interpreting SPSS Outputs
SPSS outputs tables with critical information:
- Test Statistic: Value of the test (e.g., t, F, Chi-square).
- P-value: If p < α, reject H0; otherwise, fail to reject H0.
- Confidence Intervals: Range within which the true parameter likely lies.
Regression Analysis in SPSS
What is Regression Analysis?
Regression analysis is a statistical technique used to model relationships between dependent and independent variables. It helps predict outcomes and understand variable influences.
Types of Regression Analysis in SPSS
Simple Linear Regression
Simple linear regression examines the relationship between one dependent variable and one independent variable.
Steps in SPSS:
- Go to “Analyze” > “Regression” > “Linear.”
- Specify the dependent and independent variables.
- Interpret the R-squared value, coefficients, and significance levels.
Multiple Linear Regression
Multiple linear regression models relationships between one dependent variable and two or more independent variables.
Steps in SPSS:
- Navigate to “Analyze” > “Regression” > “Linear.”
- Input dependent and independent variables.
- Assess multicollinearity using VIF (Variance Inflation Factor).
Logistic Regression
Logistic regression predicts binary outcomes (e.g., success/failure, yes/no).
Steps in SPSS:
- Select “Analyze” > “Regression” > “Binary Logistic.”
- Specify the dependent and independent variables.
- Evaluate the model fit using pseudo R-squared values.
Hierarchical Regression
Hierarchical regression evaluates the contribution of variables added in blocks to the model.
Steps in SPSS:
- Use “Linear Regression” and input variables in blocks.
- Compare R-squared changes across models.
Interpreting Regression Outputs in SPSS
SPSS provides detailed outputs for regression models:
- Model Summary: Includes R, R-squared, and adjusted R-squared values.
- ANOVA Table: Tests the overall model significance.
- Coefficients Table: Provides estimates for each predictor, their standard errors, and p-values.
Practical Applications of Hypothesis Testing and Regression Analysis
Business Analytics
- Hypothesis Testing: Assess whether promotional campaigns significantly impact sales.
- Regression Analysis: Predict future revenue based on advertising expenditure.
Healthcare Research
- Hypothesis Testing: Determine if a new drug reduces symptoms compared to a placebo.
- Regression Analysis: Model patient outcomes based on age, treatment type, and lifestyle factors.
Educational Studies
- Hypothesis Testing: Investigate whether teaching methods influence test scores.
- Regression Analysis: Predict academic performance based on study hours and socioeconomic status.
Social Sciences
- Hypothesis Testing: Examine if gender influences political affiliation.
- Regression Analysis: Explore the relationship between income and happiness.

Tips for SPSS Assignments
- Understand Your Dataset: Familiarize yourself with the variables, types, and scales of measurement.
- Choose the Right Test: Match the statistical test with your research question and data type.
- Check Assumptions: Verify assumptions like normality, linearity, and homoscedasticity before running tests.
- Interpret Results Carefully: Focus on key metrics like p-values, confidence intervals, and effect sizes.
- Practice Regularly: Gain proficiency by practicing on sample datasets.
Conclusion
SPSS simplifies complex statistical analyses, making it an essential tool for hypothesis testing and regression analysis. Whether you are a student working on assignments or a researcher analyzing data, understanding how to use SPSS effectively can enhance your analytical skills and boost your confidence. By following this guide and leveraging SPSS’s powerful features, you can master hypothesis testing and regression analysis, producing reliable and insightful results for your projects.
Needs help with similar assignment?
We are available 24x7 to deliver the best services and assignment ready within 3-4 hours? Order a custom-written, plagiarism-free paper