Solving SPSS Assignments for Social Science Students|2025
In this guide, we’ll explore the importance of SPSS in social science education, common challenges students face, and practical strategies for solving SPSS assignments effectively. We’ll also highlight essential tips and resources to help students succeed in their SPSS-related tasks.

Importance of SPSS for Social Science Students
1. Comprehensive Data Analysis
SPSS allows social science students to perform a wide range of statistical analyses, such as:
- Descriptive statistics (mean, median, standard deviation).
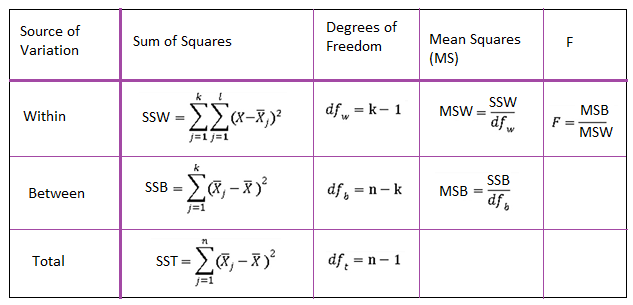
- Inferential statistics (t-tests, ANOVA, regression).
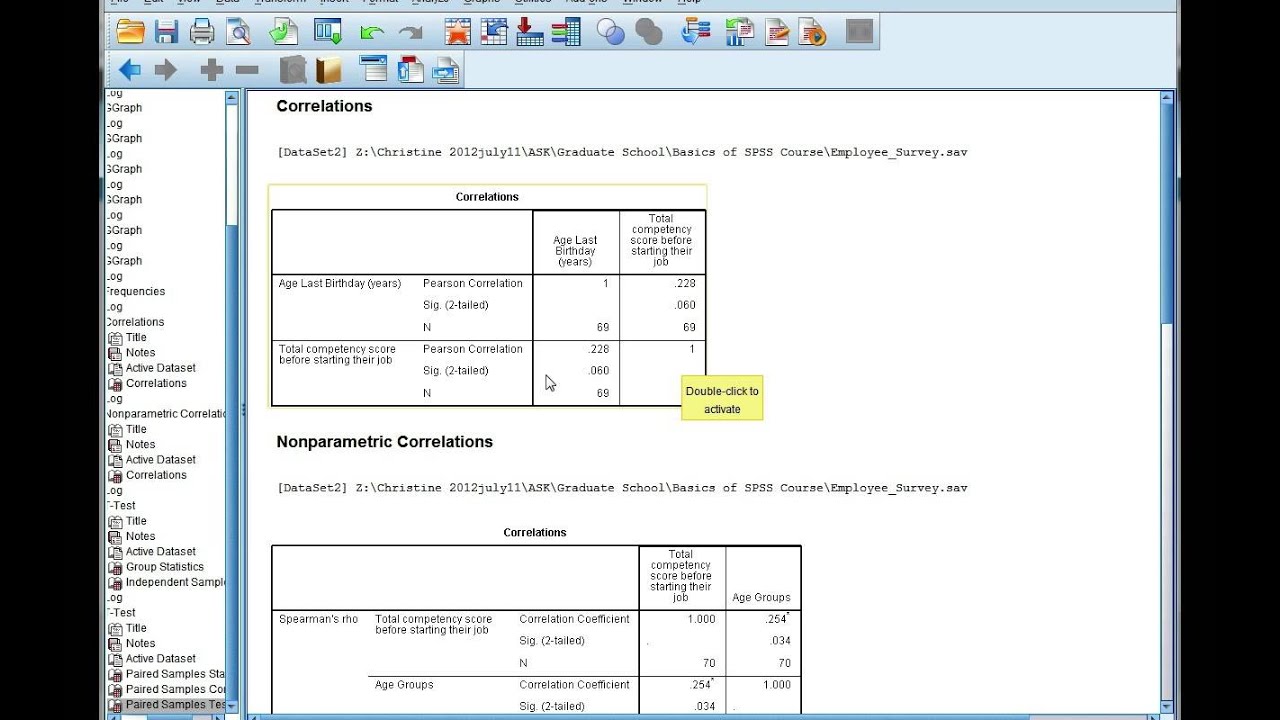
- Non-parametric tests (chi-square, Mann-Whitney U).
2. Simplified Data Management
The software provides robust tools for importing, cleaning, and organizing datasets, enabling students to focus on analysis rather than manual data handling.
3. Visualization and Reporting
SPSS helps students create detailed charts, graphs, and tables, making it easier to communicate findings effectively in assignments and research papers.
4. Real-World Applications
Skills in SPSS prepare students for careers in academia, market research, public policy, and various other fields where data analysis is crucial.
Challenges in Solving SPSS Assignments
Despite its benefits, many students encounter difficulties while working on SPSS assignments. Common challenges include:
1. Understanding Statistical Concepts
- Students may struggle to choose appropriate tests or interpret results correctly.
2. Data Preparation
- Cleaning and transforming raw data can be time-consuming and confusing for beginners.
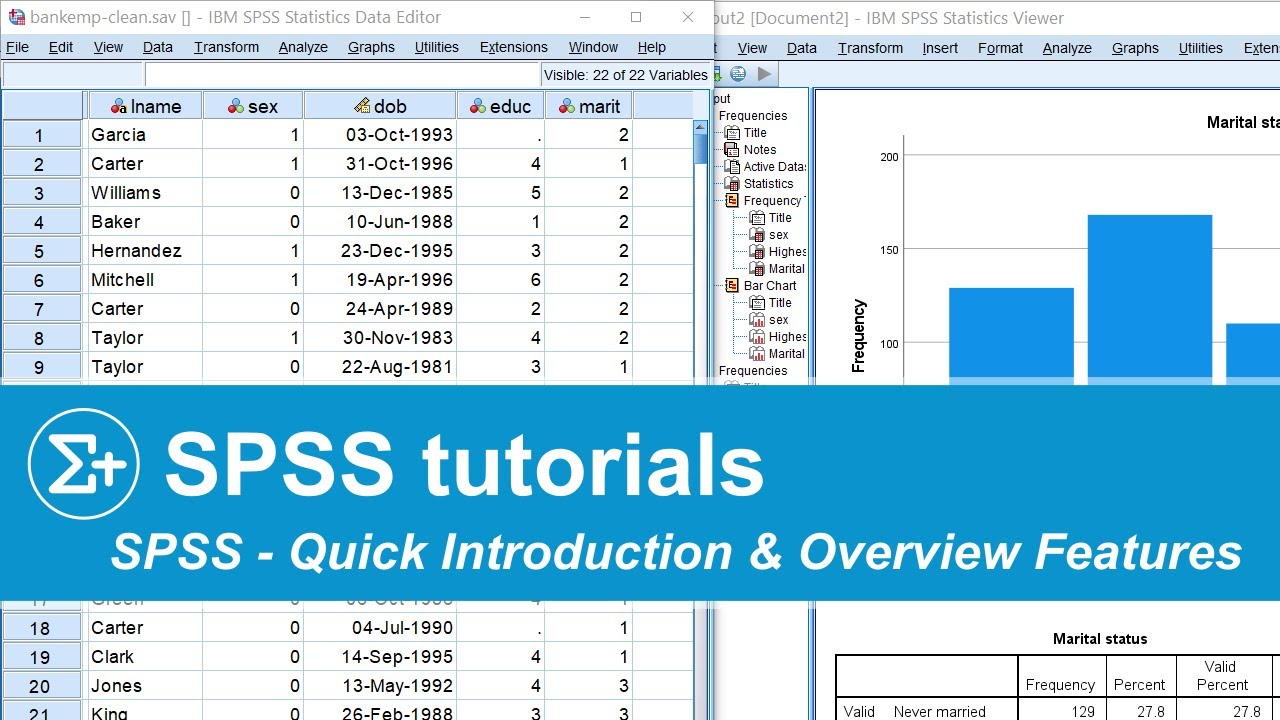
3. SPSS Interface Familiarity
- Navigating the SPSS interface and using its features effectively require practice and guidance.
4. Time Constraints
- Managing complex assignments alongside other coursework can be overwhelming.
5. Technical Issues
- Errors in coding, syntax, or data input can lead to incorrect results.

Strategies for Solving SPSS Assignments Effectively
To overcome these challenges and excel in SPSS assignments, students can adopt the following strategies:
1. Understand the Assignment Requirements
- Read the instructions carefully to identify the objectives, datasets, and statistical tests required.
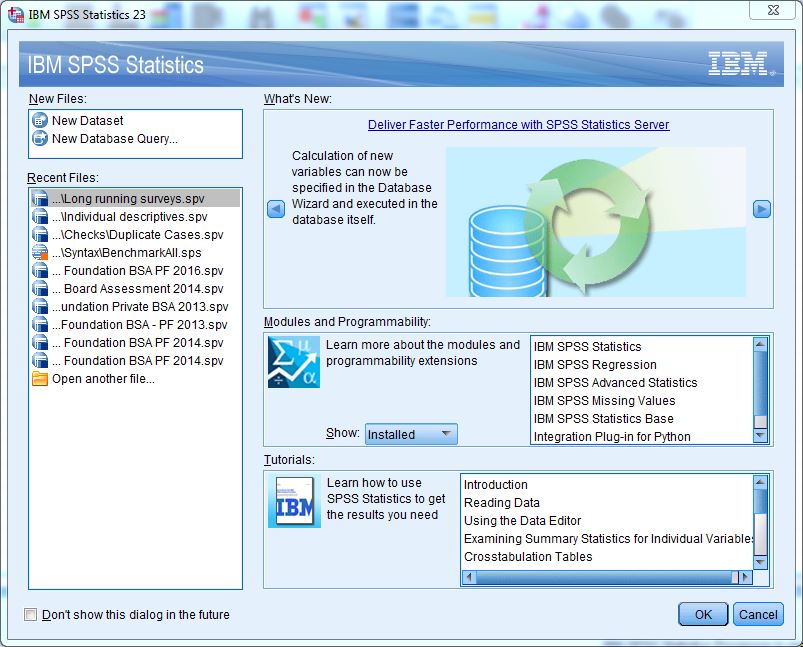
2. Familiarize Yourself with SPSS
- Explore the software’s menus, tools, and features to build confidence in using SPSS.
- Practice importing data, creating variables, and running basic analyses.
3. Break Down the Task
- Divide the assignment into smaller steps, such as:
- Data preparation.
- Choosing the appropriate statistical test.
- Running the analysis.
- Interpreting results.
- Presenting findings.
4. Leverage Syntax Commands
- Use SPSS syntax for advanced customization and to document your analysis steps for future reference.
5. Seek Resources and Guidance
- Utilize online tutorials, textbooks, and academic support services for help with specific SPSS tasks.
Step-by-Step Guide to Solving SPSS Assignments
Here is a structured approach to solving SPSS assignments for social science students:
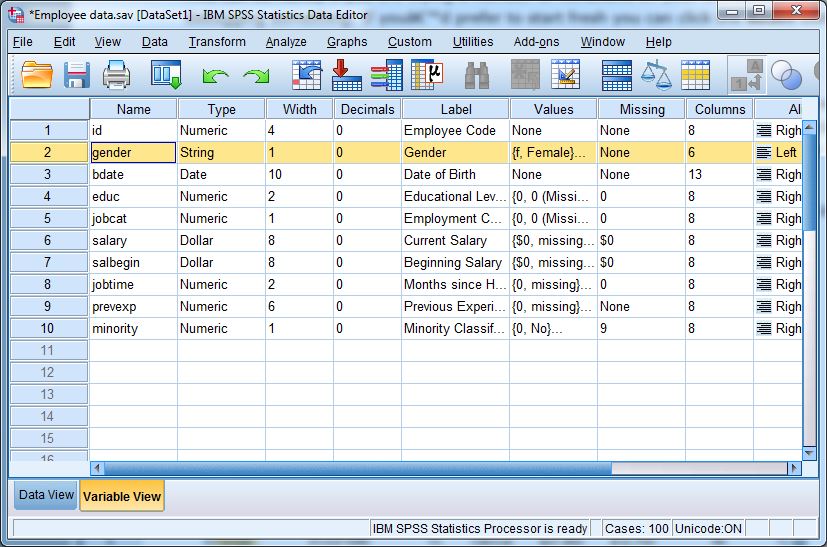
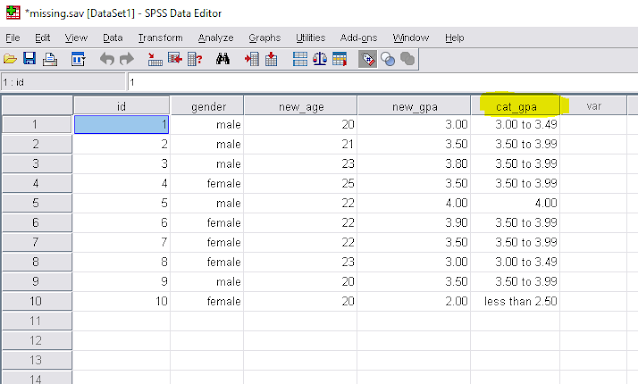
Step 1: Understand the Dataset
- Familiarize yourself with the variables and their types (e.g., nominal, ordinal, scale).
- Check for missing or inconsistent data and clean the dataset as needed.
Step 2: Define Your Objectives
- Determine the research question or hypothesis you aim to address.
- Example: “Does socioeconomic status influence academic performance?”
Step 3: Choose the Right Statistical Test
- Match the test to your data and objectives:
- Use t-tests for comparing means between two groups.
- Apply ANOVA for comparing means across multiple groups.
- Employ chi-square tests for categorical data relationships.
Step 4: Run the Analysis in SPSS
- Navigate to the appropriate menu (e.g., Analyze > Compare Means).
- Input variables and specify parameters.
- Review the output for key statistics (e.g., p-values, effect sizes).
Step 5: Interpret Results
- Summarize findings in plain language, linking them to your research question.
- Example: “The t-test revealed a significant difference in test scores between urban and rural students (p < 0.05).”
Step 6: Present Findings
- Create visual aids (e.g., bar graphs, pie charts) to enhance your report.
- Ensure clarity and professionalism in your presentation.

Tips for Excelling in SPSS Assignments
- Practice Regularly:
- Consistent practice is key to mastering SPSS.
- Use Online Tutorials:
- Platforms like YouTube, Coursera, and Udemy offer free and paid SPSS tutorials.
- Join Study Groups:
- Collaborate with peers to exchange knowledge and troubleshoot challenges.
- Consult Professors and Mentors:
- Seek guidance from instructors for complex analyses or theoretical doubts.
- Refer to Academic Journals:
- Study published research papers to understand how SPSS is applied in social science studies.
- Utilize SPSS Help Communities:
- Engage with forums like IBM’s SPSS Community, ResearchGate, or Reddit for expert advice.
Common SPSS Assignments for Social Science Students
1. Survey Data Analysis
- Analyze survey responses to identify trends and correlations.
- Example: Examining the relationship between social media usage and mental health.
2. Experimental Research
- Test hypotheses using experimental data.
- Example: Assessing the impact of a new teaching method on student performance.
3. Case Studies
- Perform descriptive statistics to summarize case study data.
- Example: Analyzing demographic profiles of a target population.
4. Predictive Modeling
- Use regression analysis to predict outcomes.
- Example: Forecasting job satisfaction based on workplace factors.
5. Policy Analysis
- Evaluate the effectiveness of policies using inferential statistics.
- Example: Measuring the impact of a minimum wage increase on employment rates.

Resources for Solving SPSS Assignments
1. Books:
- “SPSS Survival Manual” by Julie Pallant.
- “Discovering Statistics Using IBM SPSS Statistics” by Andy Field.
2. Online Courses:
- Coursera: “Introduction to SPSS” by Wesleyan University.
- Udemy: “SPSS for Beginners”.
3. YouTube Channels:
- Statistics How To.
- Research By Design.
4. Software Documentation:
- IBM’s official SPSS user guides and tutorials.
5. Academic Support Services:
- University writing centers and tutoring programs often provide SPSS assistance.
Conclusion
Solving SPSS Assignments for Social Science Students requires a combination of statistical knowledge, technical skills, and strategic planning. By mastering SPSS, students can enhance their research capabilities, improve their academic performance, and prepare for data-driven careers. Leveraging resources like tutorials, books, and professional help can make the process more manageable and rewarding. Ultimately, proficiency in SPSS is a valuable asset that empowers social science students to excel in their academic and professional journeys.
Needs help with similar assignment?
We are available 24x7 to deliver the best services and assignment ready within 3-4 hours? Order a custom-written, plagiarism-free paper


:max_bytes(150000):strip_icc()/168116621SoloStudierInLibrary-56a18fe63df78cf7726c087e.jpg)