SPSS Assignment Help for T-Test, ANOVA, and Chi-Square Analysis|2025
SPSS (Statistical Package for the Social Sciences) is one of the most widely used tools for statistical analysis in research, education, and professional environments. Among the many statistical methods it supports, the t-test, ANOVA (Analysis of Variance), and Chi-Square test are particularly important. These tests help analyze relationships, compare group means, and test hypotheses across various data sets. This comprehensive guide will explore SPSS assignment help for T-Test, ANOVA, and Chi-Square Analysis, providing insights and tips to excel in these analyses.
Introduction to SPSS and Its Importance in Statistical Analysis
SPSS is designed to simplify complex data analysis processes. Its user-friendly interface and robust functionalities make it an essential tool for:
- Hypothesis Testing: Understanding relationships and differences between variables.
- Descriptive and Inferential Statistics: Summarizing data and making predictions.
- Data Visualization: Creating charts and graphs for better understanding.
For students and professionals working on assignments involving T-Test, ANOVA, and Chi-Square Analysis, SPSS offers an intuitive platform to perform these analyses efficiently.
Understanding T-Test in SPSS
A T-Test is used to compare the means of two groups to determine if they are statistically different from each other. SPSS makes it easy to perform various types of T-Tests:
1. Types of T-Tests
- Independent Samples T-Test: Compares means between two unrelated groups.
- Paired Samples T-Test: Compares means from the same group at two different times.
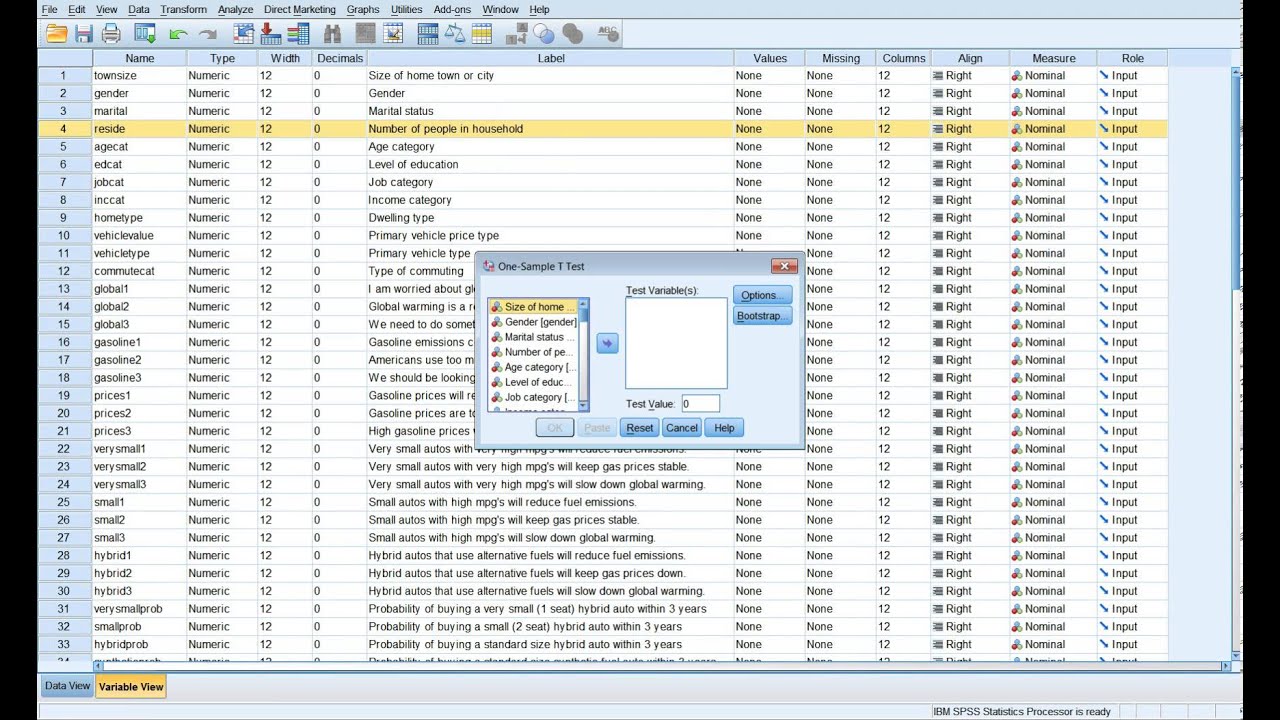
- One-Sample T-Test: Compares the mean of a single sample to a known value.
2. Steps to Perform a T-Test in SPSS
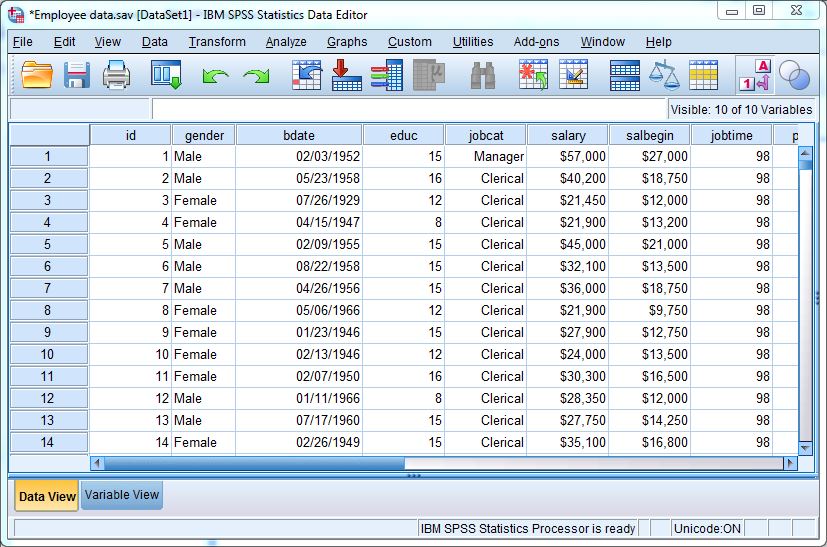
- Input Data: Enter the data in SPSS in two columns: one for the variable and another for the group identifier.
- Select Analyze > Compare Means > T-Test: Choose the type of T-Test.
- Define Groups: Specify the group variables.
- Interpret Outputs: Analyze key metrics like mean differences, t-values, and p-values.
3. Key Interpretation Tips
- A p-value less than 0.05 indicates a significant difference between groups.
- Check for Levene’s Test to ensure equal variances.
Common Challenges and Solutions
- Unequal Sample Sizes: Use the Welch T-Test.
- Assumption Violations: Transform data or use non-parametric alternatives.
Mastering ANOVA in SPSS
ANOVA is used to compare means among three or more groups. SPSS supports various types of ANOVA, making it versatile for complex data analysis.
1. Types of ANOVA
- One-Way ANOVA: Tests differences between groups based on one independent variable.
- Two-Way ANOVA: Examines the effect of two independent variables.
- Repeated Measures ANOVA: Tests differences within the same group over time or conditions.
2. Steps to Perform ANOVA in SPSS
- Input Data: Organize data with variables for dependent and independent factors.
- Select Analyze > General Linear Model > Univariate: For One-Way ANOVA, or Repeated Measures for repeated measures ANOVA.
- Define Factors: Specify the dependent and independent variables.
- Review Outputs: Focus on F-values, p-values, and post hoc test results.
3. Key Interpretation Tips
- A significant F-value (p < 0.05) suggests group differences.
- Use post hoc tests (e.g., Tukey’s HSD) to identify specific group differences.
Common Challenges and Solutions
- Homogeneity of Variance Violation: Use Welch ANOVA or transform data.
- Interaction Effects: Pay attention to interaction terms in Two-Way ANOVA.

Excelling in Chi-Square Analysis in SPSS
The Chi-Square test is used to examine relationships between categorical variables. It is a non-parametric test that determines if observed frequencies differ from expected frequencies.
1. Types of Chi-Square Tests
- Chi-Square Test of Independence: Checks if two variables are independent.
- Chi-Square Goodness-of-Fit Test: Compares observed data with a theoretical distribution.
2. Steps to Perform Chi-Square Analysis in SPSS
- Input Data: Organize data into a contingency table with frequencies.
- Select Analyze > Descriptive Statistics > Crosstabs: Choose the variables.
- Request Chi-Square: Tick the Chi-Square option in the Crosstabs dialog.
- Interpret Outputs: Focus on the Chi-Square statistic, degrees of freedom, and p-value.
3. Key Interpretation Tips
- A p-value less than 0.05 indicates a significant association.
- Review the Cramér’s V value for the strength of association.
Common Challenges and Solutions
- Small Expected Frequencies: Use Fisher’s Exact Test as an alternative.
- Multiple Comparisons: Adjust significance levels to avoid Type I errors.
Practical Tips for SPSS Assignments
1. Use Templates for Analysis
- Save time by creating SPSS templates for common analyses.
- Reuse variable labels and output formats to maintain consistency.
2. Leverage Visualization Tools
- Create bar charts, box plots, or scatter plots to supplement your statistical results.
- Annotate visuals with clear labels and titles.
3. Report Results Effectively
- Always include the test statistic, degrees of freedom, and p-value.
- Interpret findings in plain language for non-technical audiences.
4. Avoid Common Pitfalls
- Ensure assumptions are met before conducting tests.
- Cross-check SPSS outputs for accuracy.
- Provide context for all findings to enhance comprehension.
SPSS Assignment Help Services
If you find yourself struggling with T-Test, ANOVA, or Chi-Square Analysis, professional SPSS assignment help services can provide invaluable support. These services often include:
- One-on-One Tutoring: Personalized guidance to understand concepts and tools.
- Assignment Reviews: Feedback on your work to improve accuracy and presentation.
- Custom Solutions: Tailored analysis and reports to meet specific requirements.
- 24/7 Support: Assistance whenever you encounter challenges.
Choosing the Right SPSS Help Service
Look for services with:
- Experienced Experts: Ensure they have advanced knowledge of SPSS and statistics.
- Quick Turnaround: Timely delivery of assignments.
- Affordable Pricing: Competitive rates without compromising quality.
Conclusion
Mastering T-Test, ANOVA, and Chi-Square Analysis in SPSS is essential for academic and professional success. By following the steps outlined above and seeking SPSS assignment help when needed, you can confidently tackle these statistical tests. With a combination of practice, resources, and expert guidance, you’ll excel in using SPSS for data analysis. Leverage this guide on SPSS Assignment Help for T-Test, ANOVA, and Chi-Square Analysis to achieve top grades and develop your statistical expertise.
Needs help with similar assignment?
We are available 24x7 to deliver the best services and assignment ready within 3-4 hours? Order a custom-written, plagiarism-free paper