Step-by-Step Tutorial on SPSS Data Analysis for Beginners|2025
1. Understanding SPSS Basics
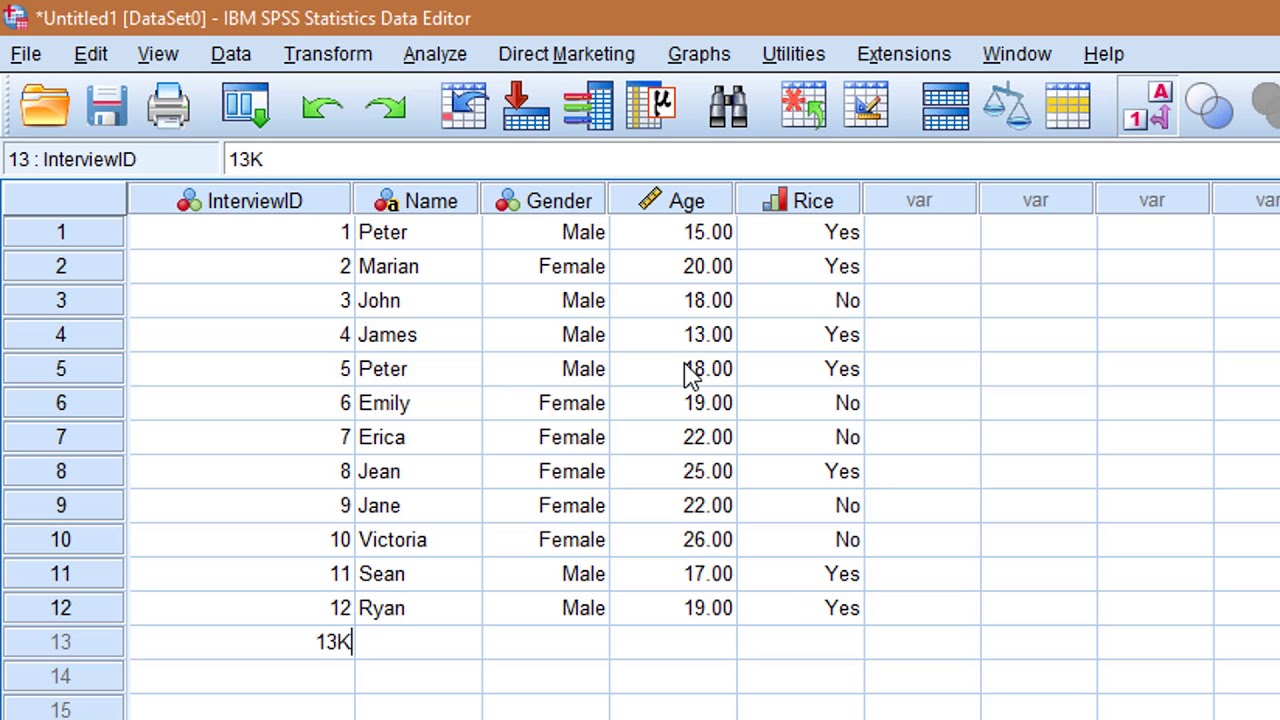
Before diving into analysis, familiarize yourself with SPSS’s interface. It consists of two main views:
- Data View: Displays the dataset where rows represent cases, and columns represent variables.
- Variable View: Allows you to define and manage your variables, including names, types, and labels.
2. Importing Data into SPSS
SPSS supports multiple data formats, such as Excel, CSV, and TXT files. Here’s how to import your data:
- Open SPSS and click on File > Open > Data.
- Select the file format and locate your dataset.
- Ensure variables are assigned correctly during import.
3. Defining Variables in SPSS
Proper variable definition ensures accurate analysis. Use the Variable View to:
- Name each variable (avoid spaces and special characters).
- Set the variable type (e.g., numeric, string).
- Assign variable labels and value labels for clarity.
4. Data Cleaning and Preparation
Clean data is crucial for reliable results. Perform these steps:
- Identify Missing Data: Use Analyze > Descriptive Statistics > Frequencies to detect blanks.
- Handle Outliers: Visualize data using boxplots (via Graphs > Chart Builder).
- Transform Variables: Use Transform > Compute Variable to create new variables or recode existing ones.
5. Descriptive Statistics in SPSS
Descriptive statistics summarize your dataset. To calculate:
- Navigate to Analyze > Descriptive Statistics > Descriptives.
- Select the variables and review the mean, median, standard deviation, and range in the output.
6. Conducting Inferential Statistics
SPSS simplifies various statistical tests. Here’s how to perform common analyses:
a) T-Test
- Go to Analyze > Compare Means > Independent-Samples T-Test.
- Define grouping variables and test variables.
- Review the p-value in the output to determine significance.
b) ANOVA (Analysis of Variance)
- Click on Analyze > Compare Means > One-Way ANOVA.
- Specify the dependent variable and factor.
- Use post-hoc tests to identify group differences if p < 0.05.
c) Chi-Square Test
- Navigate to Analyze > Descriptive Statistics > Crosstabs.
- Define rows, columns, and enable the “Chi-square” option.
- Check the significance level in the results.
d) Correlation Analysis
- Go to Analyze > Correlate > Bivariate.
- Select variables and choose the correlation type (e.g., Pearson).
- Interpret the correlation coefficient (r) and significance level.

7. Creating Visualizations in SPSS
Graphs and charts enhance the presentation of your findings. To create visualizations:
- Open Graphs > Chart Builder.
- Choose chart types like histograms, bar charts, or scatterplots.
- Customize titles, labels, and color schemes for clarity.
8. Using SPSS Syntax for Efficiency
SPSS Syntax allows you to automate repetitive tasks and ensure consistency:
- Paste commands from dialog boxes using the “Paste” button.
- Modify and run syntax in the Syntax Editor.
- Save syntax files for future use, ensuring reproducibility.
9. Interpreting SPSS Output
SPSS generates detailed output files. Focus on:
- Key metrics like p-values, confidence intervals, and effect sizes.
- Tables and charts that summarize your results.
- Use APA formatting for academic reports.
10. Saving and Exporting SPSS Results
To save your work:
- Save datasets as .sav files using File > Save As.
- Export outputs to Word or PDF via File > Export.
- Always back up your files to prevent data loss.
Additional Tips for SPSS Beginners
- Practice Regularly: Familiarity with SPSS comes from hands-on experience. Use sample datasets to practice.
- Use SPSS Tutorials and Help: Access built-in tutorials or online resources for guidance.
- Seek Professional Help: If stuck, consider SPSS assignment help services for expert support.
- Consult Your Instructor: For academic assignments, clarify any doubts with your professor.
Conclusion
SPSS is a versatile tool that simplifies data analysis for students and professionals alike. By following this step-by-step tutorial, beginners can confidently navigate its features and perform accurate statistical analyses. Regular practice and attention to detail will ensure success in your SPSS assignments. Remember, if you encounter challenges, professional SPSS assignment help is always available to guide you.
Needs help with similar assignment?
We are available 24x7 to deliver the best services and assignment ready within 3-4 hours? Order a custom-written, plagiarism-free paper