Step-by-Step Guide to Mastering Excel Lookup Functions for Assignments|2025

Mastering Excel lookup functions is essential for handling complex data and completing assignments efficiently. Lookup functions allow users to search for and retrieve data from a table or range by matching specific criteria. This guide will walk you through the different types of lookup functions, their applications, and practical examples. Additionally, we will explain why Getspsshelp.com is the best resource for learning and mastering Excel lookup functions.

Mastering Excel Lookup Functions

Understanding Lookup Functions in Excel

Excel provides powerful lookup functions that help in data retrieval tasks. The most commonly used lookup functions are VLOOKUP, HLOOKUP, INDEX, and MATCH.

3 Types of Lookup in Excel

  1. Vertical Lookup (VLOOKUP): Searches for a value in the first column of a range and returns a value in the same row from another column.
  2. Horizontal Lookup (HLOOKUP): Searches for a value in the first row of a range and returns a value in the same column from another row.
  3. Dynamic Lookup (INDEX and MATCH): Combines the flexibility of INDEX and MATCH functions to perform more complex lookups.

VLOOKUP Formula in Excel with Example

VLOOKUP is one of the most popular lookup functions in Excel.

Syntax:

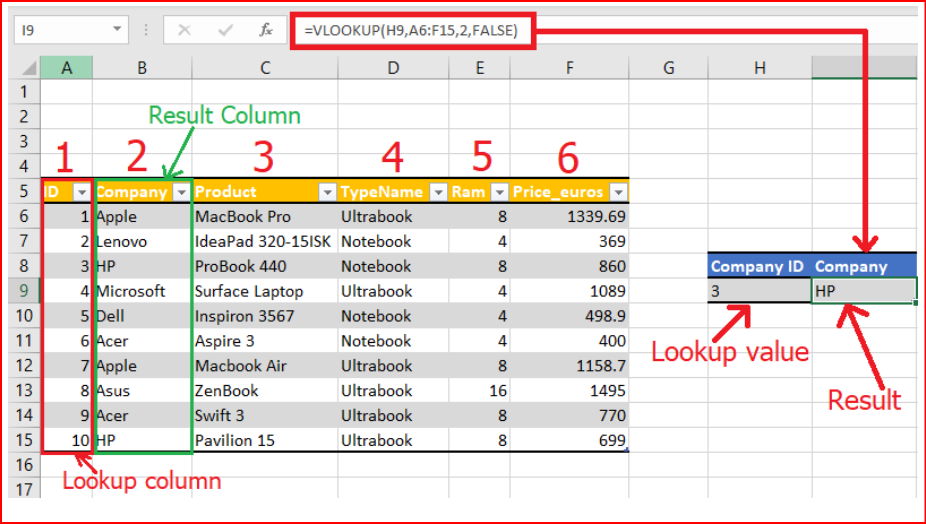
=VLOOKUP(lookup_value, table_array, col_index_num, [range_lookup])

Example: You have a table of student scores, and you want to find the score of a student named “John”.

=VLOOKUP("John", A2:C10, 2, FALSE)
  • lookup_value: “John”
  • table_array: A2:C10
  • col_index_num: 2 (The column containing the scores)
  • range_lookup: FALSE (Exact match)

Advanced Excel Lookup Functions

HLOOKUP Function

HLOOKUP works similarly to VLOOKUP but searches horizontally.

Syntax:

=HLOOKUP(lookup_value, table_array, row_index_num, [range_lookup])

Example: Find the sales figure for “Q2” in a horizontal table.

=HLOOKUP("Q2", A1:D3, 2, FALSE)

INDEX Function

INDEX returns the value of a cell in a specified row and column.

Syntax:

=INDEX(array, row_num, [column_num])

Example: Retrieve the value from the second row and third column of a table.

=INDEX(A2:C10, 2, 3)

MATCH Function

MATCH returns the relative position of a value in a range.

Syntax:

=MATCH(lookup_value, lookup_array, [match_type])

Example: Find the position of the value “500” in a list.

=MATCH(500, A1:A10, 0)

Combining INDEX and MATCH

Combining INDEX and MATCH allows for more flexible lookups.

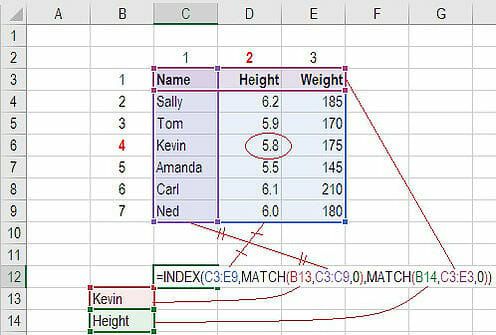
Example: Find the score of “John” in a dynamic table.

=INDEX(B2:B10, MATCH("John", A2:A10, 0))

Mastering Excel Lookup Functions

How to Do VLOOKUP in Excel with Two Spreadsheets

VLOOKUP can be used across different spreadsheets by specifying the workbook and sheet names.

Example: Retrieve data from a different workbook.

=VLOOKUP("John", '[WorkbookName.xlsx]Sheet1'!A2:C10, 2, FALSE)

Lookup and Reference Functions in Excel PDF

For detailed explanations and examples, you can download lookup and reference functions guides in PDF format. These guides provide comprehensive insights into using these functions effectively.

Where is Lookup and Reference in Excel?

Lookup and reference functions can be found under the “Formulas” tab in Excel. Click on “Lookup & Reference” to access functions like VLOOKUP, HLOOKUP, INDEX, MATCH, and more.

Practical Applications of Lookup Functions

Data Retrieval

Lookup functions are invaluable for retrieving data from large datasets quickly.

Dynamic Reporting

Create dynamic reports by combining lookup functions with other Excel features like PivotTables and charts.

Data Analysis Assignments

Use lookup functions to streamline data analysis tasks, such as matching data from different sources or summarizing key metrics.

How Many Types of Lookup in Excel?

Excel primarily supports three types of lookup:

  1. VLOOKUP
  2. HLOOKUP
  3. INDEX and MATCH

These functions cater to various data retrieval needs and can be used in combination for more complex scenarios.

Mastering Excel Lookup Functions

Call to Action: Why Getspsshelp.com is the Best Website for Learning Excel Lookup Functions

Getspsshelp.com is the ultimate resource for mastering Excel lookup functions. Here’s why:

  • Expert Guidance: Our experts provide step-by-step tutorials and personalized assistance.
  • Comprehensive Resources: Access detailed guides, examples, and downloadable materials to enhance your learning.
  • User-Friendly Platform: Navigate easily through our well-organized content to find exactly what you need.
  • Proven Success: Join thousands of students who have improved their Excel skills with our support.

Conclusion

Understanding and mastering Excel’s lookup functions is crucial for efficient data analysis and assignment success. This guide has provided a comprehensive overview of the key lookup functions, practical examples, and advanced techniques.

Getspsshelp.com is the best website for mastering Excel Lookup functions for assignments due to its clear, step-by-step guides that simplify complex formulas. The platform offers detailed tutorials on using VLOOKUP, HLOOKUP, INDEX, and MATCH functions, making it easy for students to grasp their application. With real-life examples and interactive exercises, users can practice and solidify their skills for accurate data retrieval. Personalized support from expert instructors ensures you receive tailored assistance for your specific assignment needs. Whether you’re working on a small dataset or a large-scale analysis, getspsshelp.com equips you with the expertise to excel in your assignments.

Needs help with similar assignment?

We are available 24x7 to deliver the best services and assignment ready within 3-4 hours? Order a custom-written, plagiarism-free paper

Get Answer Over WhatsApp Order Paper Now

Excel for Data Science: Key Features for Your Advanced Assignment|2025

Discover how to use Excel for Data Science with expert tips on data analysis, visualization, and advanced functions. Learn techniques like PivotTables, Power Query, and statistical tools to transform raw data into actionable insights! Excel is a powerful tool that continues to be a cornerstone in data science, offering numerous features for advanced data analysis and visualization. This guide explores how Excel’s capabilities can be harnessed for data science assignments, while highlighting why GetSPSSHelp.com is the ultimate destination for professional Excel assignment assistance.


Excel for Data Science

Why Use Excel for Data Science?

Excel’s versatility and user-friendly interface make it an essential tool for data scientists. Key benefits include:

  • Accessibility: Available on most devices with minimal setup.
  • Integration: Easily integrates with other tools and platforms like Python, R, and Power BI.
  • Advanced Features: Tools like PivotTables, Power Query, and Data Analysis Toolpak simplify complex analyses.

Key Features of Excel for Data Science

Data Organization

Proper data organization is the foundation of data analysis:

  • Steps to Organize Data:
    • Use structured tables with clear headers.
    • Apply filters and sort options to explore data efficiently.
    • Leverage “Remove Duplicates” to clean data.

Advanced Excel Functions

Excel offers functions that are indispensable for data science:

  • Statistical Functions:
    • =AVERAGE, =STDEV, =CORREL for basic statistical analysis.
  • Lookup Functions:
    • VLOOKUP, INDEX-MATCH for dynamic data retrieval.
  • Array Formulas:
    • Multi-cell calculations using =MMULT and =TRANSPOSE.

Data Visualization

Excel simplifies data visualization with:

  • Charts and Graphs:
    • Scatter plots, histograms, and dynamic dashboards.
  • Conditional Formatting:
    • Highlight trends and outliers visually.

Power Query

Automate data preparation and transformation:

  • Features:
    • Merge queries, pivot data, and clean datasets effortlessly.
  • Steps to Access:
    • Navigate to Data → Get & Transform.

Excel for Data Science

Advanced Excel for Data Analysis

Data Analysis Toolpak

Install this add-in to access tools for:

  • Regression analysis.
  • ANOVA tests.
  • Descriptive statistics.

Solver for Optimization

Use Solver for constraint-based optimization problems:

  • Examples:
    • Resource allocation.
    • Portfolio optimization.

Scenario Manager

Conduct what-if analysis using:

  • Steps:
    • Go to Data → Forecast → What-If Analysis.

Advanced Dashboard Design

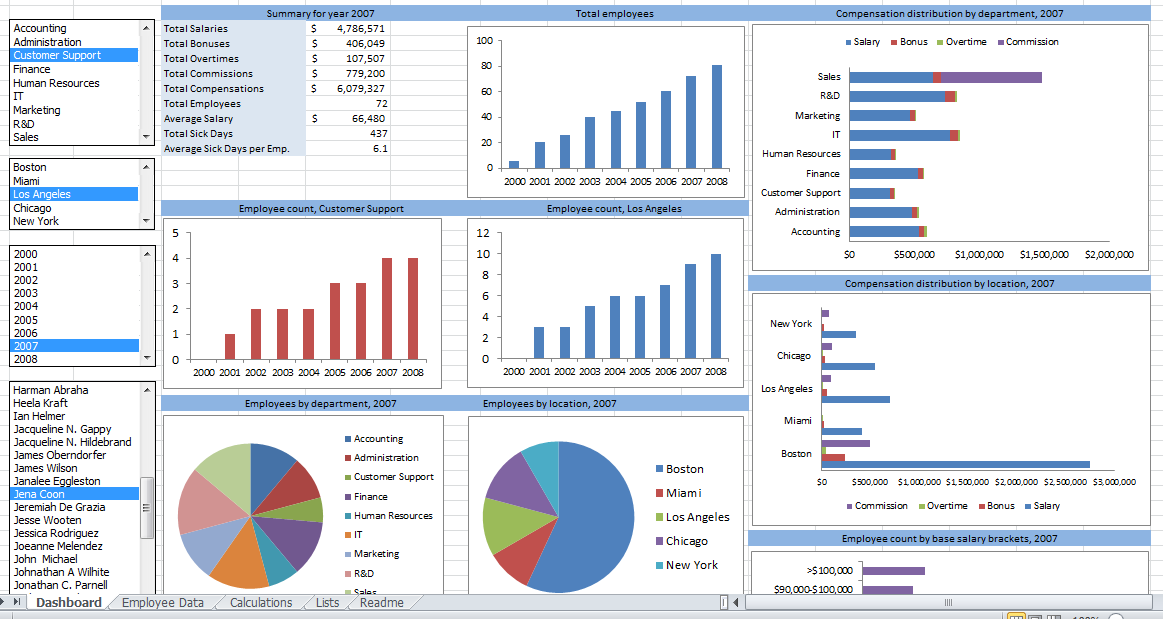
Create interactive dashboards:

  • Tools:
    • Slicers for dynamic filtering.
    • PivotCharts for summarization.

Most Useful Excel Functions for Data Analysis

Regression Analysis in Excel

Perform regression to predict trends:

  • Steps:
    • Enable Data Analysis Toolpak.
    • Choose “Regression” and configure inputs.

Forecasting with Excel

Use functions like =FORECAST.ETS to predict future values.

Statistical Analysis

Advanced statistical calculations with:

  • =T.TEST, =F.TEST for hypothesis testing.
  • =NORM.DIST for distribution analysis.

Excel for Data Science


Data Analysis Using Excel Case Study

Example: Sales Performance Analysis

  • Objective: Analyze quarterly sales trends for a retail company.
  • Steps:
    1. Import data using Power Query.
    2. Clean data (e.g., remove duplicates).
    3. Use PivotTables to summarize sales by region.
    4. Create a dynamic dashboard with slicers and conditional formatting.

Excel Skills for Data Analyst Resume

Highlighting Your Skills

Showcase advanced Excel expertise on your resume:

  • Key Skills:
    • Proficiency in Power Query and PivotTables.
    • Automation using Macros and VBA.
    • Data visualization and dashboard design.

Sample Resume Line

  • “Skilled in data analysis using advanced Excel tools, including regression analysis, Solver, and Power Query.”

Excel Resources for Learning

Free Downloads and PDFs

  • Advanced Excel for Data Analysis PDF: Comprehensive guides available online.
  • Most Useful Excel Functions for Data Analysis PDF: Download lists of essential functions with examples.

Online Courses

  • Platforms like Coursera, Udemy, and Khan Academy offer specialized Excel courses.
  • Microsoft’s official training modules provide step-by-step tutorials.

Combining PDFs and Courses

Integrate downloaded materials with online courses for a hands-on approach.


How to Organize Data in Excel for Analysis

Best Practices

  • Data Cleaning:
    • Remove errors and inconsistencies.
    • Use =TRIM, =CLEAN to sanitize text.
  • Data Structuring:
    • Convert raw data into structured tables.
    • Use Power Query for transformations.

Tools for Data Organization

  • Named Ranges: Simplify formulas with descriptive names.
  • Table Styles: Apply consistent formatting for clarity.

Excel for Data Science

Why Choose GetSPSSHelp.com for Excel Assignments?

When tackling advanced Excel assignments, expert guidance can save time and effort. Here’s why GetSPSSHelp.com is your go-to resource:

Professional Expertise

  • Our team includes Excel specialists proficient in data science techniques.
  • We handle complex assignments, from data cleaning to regression analysis.

Comprehensive Resources

  • Access exclusive templates, guides, and cheat sheets.
  • Get step-by-step solutions tailored to your needs.

Affordable and Reliable

  • Competitive pricing ensures value for your money.
  • 24/7 customer support for immediate assistance.

Proven Success

  • Thousands of satisfied students trust us for timely and accurate help.
  • High-quality solutions designed to meet academic standards.

Final Thoughts

Excel is a versatile tool with immense potential for data science. Mastering its advanced features can transform how you approach assignments. If you’re facing challenges, visit GetSPSSHelp.com for professional assistance and resources tailored to your needs. Let us help you excel in Excel!

Needs help with similar assignment?

We are available 24x7 to deliver the best services and assignment ready within 3-4 hours? Order a custom-written, plagiarism-free paper

Get Answer Over WhatsApp Order Paper Now

Understanding Array Formulas in Excel for Data Analysis Assignments|2025

Understanding array formulas in Excel for data analysis assignments. Learn how to perform complex calculations, automate tasks, and improve the efficiency of your data analysis with powerful array formulas.

Array formulas in Excel are powerful tools that allow users to perform multiple calculations on a set of values simultaneously. They can simplify complex data analysis tasks, making them an essential feature for anyone tackling data analysis assignments. This guide will explore the fundamentals of array formulas, provide practical examples, and discuss advanced techniques. Additionally, we will explain why Getspsshelp.com is your best resource for mastering Excel array formulas.

Understanding Array Formulas in Excel for Data Analysis Assignments

What are Array Formulas?

Array formulas operate on multiple values rather than a single value. They can return either a single result or multiple results. These formulas are useful for performing complex calculations that would otherwise require multiple steps.

Benefits of Using Array Formulas

  • Efficiency: Perform multiple calculations with a single formula.
  • Consistency: Reduce errors by using a single formula across a range of cells.
  • Dynamic Updates: Automatically update results when the source data changes.

How to Use Array Formulas in Excel

Entering an Array Formula

To enter an array formula, follow these steps:

  1. Select the cell or range of cells where you want the result.
  2. Type the formula.
  3. Press Ctrl + Shift + Enter instead of just Enter. Excel will automatically enclose the formula in curly braces {}.

Excel Array Formula Examples

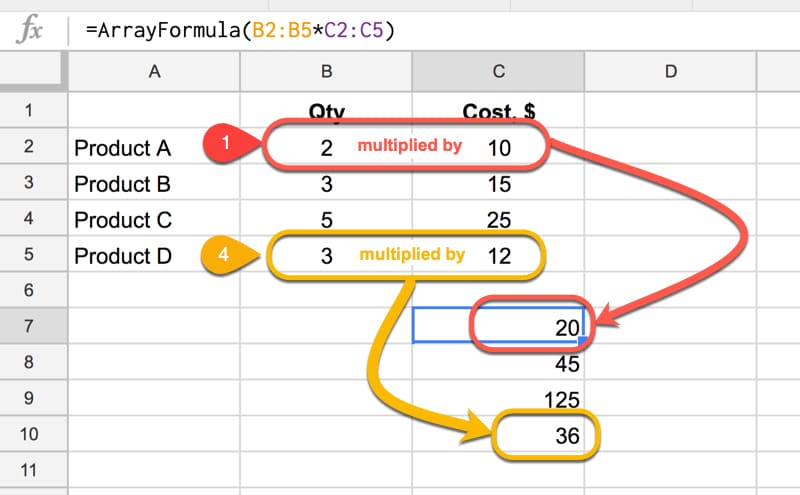
Example 1: Sum of Products Calculate the total revenue by multiplying the quantity of items sold by the price per item and summing the results.

=SUM(A1:A10 * B1:B10)

Example 2: Average with Multiple Conditions Find the average sales for a specific region and product.

=AVERAGE(IF((RegionRange="North")*(ProductRange="Widget"), SalesRange))

Example 3: Count Unique Values Count the number of unique values in a range.

=SUM(IF(FREQUENCY(DataRange, DataRange)>0,1))

Advanced Array Formula Techniques

Array Formula in Excel with Multiple Conditions

Array formulas can handle multiple conditions using logical operators.

Example: Sum of sales for a specific region and product category.

=SUM((RegionRange="North")*(CategoryRange="Electronics")*SalesRange)

Excel Dynamic Array Formulas

Dynamic array formulas automatically expand to fit the size of the result set.

Example: List unique values from a range.

=UNIQUE(DataRange)

IF Condition with Array in Excel

Using IF conditions within array formulas allows for complex conditional calculations.

Example: Calculate total sales for products exceeding a certain threshold.

=SUM(IF(SalesRange>1000, SalesRange, 0))

How to Create an Array in Excel

To create an array, simply input your data into a range of cells and use it within an array formula.

Example: Creating an array for product prices.

{100, 200, 300, 400, 500}

Understanding Array Formulas in Excel for Data Analysis Assignments

Excel Array Functions List

Here are some commonly used array functions in Excel:

  • SUM: Adds all numbers in a range.
  • AVERAGE: Calculates the average of numbers.
  • MIN: Finds the minimum value in a range.
  • MAX: Finds the maximum value in a range.
  • IF: Returns one value if a condition is TRUE and another if FALSE.
  • UNIQUE: Returns unique values from a range.
  • SORT: Sorts a range of values.
  • FILTER: Filters a range of data based on criteria.

Practical Applications of Array Formulas

Data Analysis Assignments Online

Array formulas are crucial for online data analysis assignments where complex data sets require efficient and accurate analysis.

Case Study: Sales Performance Analysis

Use array formulas to analyze sales performance across multiple regions and products, identifying trends and insights.

Steps:

  1. Import data into Excel.
  2. Use array formulas to calculate key metrics (e.g., total sales, average sales per region).
  3. Visualize the results using charts and graphs.

Resources for Learning Array Formulas

Excel Array Formula Examples: Download comprehensive examples to practice and understand array formulas.

Dynamic Dashboard Template in Excel Free Download: Utilize pre-designed templates that incorporate array formulas for dynamic reporting.

Excel Array Functions List: Access a detailed list of array functions for quick reference.

Excel Data Analysis Course: Enroll in courses that cover array formulas and other advanced Excel techniques.

Understanding Array Formulas in Excel for Data Analysis Assignments

Why Getspsshelp.com is the Best Resource

At Getspsshelp.com, we provide unparalleled support for mastering array formulas in Excel. Here’s why we’re the best choice:

  • Expert Guidance: Our team of experts offers personalized assistance to help you understand and apply array formulas effectively.
  • Comprehensive Resources: Access a wide range of tutorials, case studies, and downloadable materials.
  • User-Friendly Platform: Our website is designed for ease of use, with clear instructions and step-by-step guides.
  • Proven Success: Thousands of students have benefited from our services, achieving excellence in their data analysis assignments.

Conclusion

Understanding and using array formulas in Excel can significantly enhance your data analysis capabilities. This guide has covered essential techniques, practical applications, and resources to help you master array formulas. For expert help and further learning, visit Getspsshelp.com—your ultimate resource for academic success in data analysis.

Getspsshelp.com is the best website for understanding array formulas in Excel for data analysis assignments due to its expert-led, easy-to-follow tutorials. The site breaks down complex concepts into simple steps, helping you grasp the power of array formulas for efficient data analysis. With practical examples and real-life applications, you’ll learn how to use array formulas to streamline calculations and enhance your analysis. The platform also offers personalized support, ensuring you can overcome any challenges when applying array formulas to your assignments. Whether you are analyzing large datasets or solving intricate problems, getspsshelp.com equips you with the skills needed to master array formulas in Excel.

Needs help with similar assignment?

We are available 24x7 to deliver the best services and assignment ready within 3-4 hours? Order a custom-written, plagiarism-free paper

Get Answer Over WhatsApp Order Paper Now

Advanced Excel Assignment Help Now|2025

Get Advanced Excel Assignment Help: how to tackle complex data entry challenges. Master advanced techniques to efficiently manage, analyze, and process data for better assignment results. Excel is a cornerstone tool in data management, analysis, and visualization. For students and professionals alike, advanced Excel skills are essential for tackling complex data entry challenges. This guide delves into effective techniques and tools to simplify advanced Excel assignments while highlighting how GetSPSSHelp.com can provide expert assistance.


Advanced Excel Assignment Help: How to Tackle Complex Data Entry Challenges

What is Advanced Excel?

Advanced Excel goes beyond basic functionalities like data entry and arithmetic operations. It involves mastering complex formulas, automation tools, and data visualization techniques:

  • Key Features:
    • Advanced formulas like INDEX-MATCH and array formulas.
    • Tools like PivotTables, Power Query, and Macros.
    • Data visualization features such as conditional formatting and interactive dashboards.
  • Why It Matters: Advanced Excel streamlines data analysis and decision-making processes, making it a crucial skill for academic and professional assignments.

Common Challenges in Advanced Excel Assignments

Managing Large Data Sets

Handling massive data sets can overwhelm Excel’s default capabilities. Common challenges include:

  • Slow Performance: Large files may slow down.
  • Data Cleaning: Identifying duplicates and inconsistencies.

Complex Data Entry Tasks

Advanced assignments often require:

  • Automating repetitive tasks using Macros.
  • Setting up validation rules to ensure accuracy.
  • Using advanced tools like Power Query for transformations.

Lack of Knowledge in Advanced Formulas

Understanding advanced Excel formulas is crucial for tackling:

  • Multi-variable data analysis.
  • Statistical calculations and regressions.

Inefficient Workflow Management

Without mastery over shortcuts and tools, assignments can become time-intensive.


Advanced Excel Formulas with Examples

INDEX-MATCH for Dynamic Lookups

Unlike VLOOKUP, INDEX-MATCH allows for flexible, non-linear searches:

  • Formula:
    =INDEX(Result_Range, MATCH(Lookup_Value, Lookup_Range, 0))
  • Example: Retrieve sales data for a specific region dynamically.

Array Formulas for Multi-Cell Calculations

Array formulas handle calculations across multiple cells:

  • Example:
    {=SUM(A1:A10*B1:B10)}

    Calculates the sum of the product of two arrays.

TEXT Functions for Formatting

The TEXT formula customizes data displays:

  • Example:
    =TEXT(A1, "dd-mm-yyyy")

    Converts a date into the specified format.

Advanced Conditional Logic with IF-AND-OR

Combine conditions for complex logic:

  • Formula:
    =IF(AND(A1>10, B1<5), "Yes", "No")
  • Use Case: Automating decision rules.

Advanced Excel Assignment Help: How to Tackle Complex Data Entry Challenges

How to Tackle Complex Data Entry Challenges

Use Data Validation for Accuracy

Data validation ensures input accuracy:

  • Steps:
    • Go to Data → Data Validation.
    • Set rules, e.g., “Allow only whole numbers.”
  • Pro Tip: Use custom formulas like =ISNUMBER(A1) for specific validations.

Leverage Power Query for Data Transformation

Power Query simplifies importing, cleaning, and reshaping data:

  • Steps:
    • Go to Data → Get & Transform.
    • Load data and apply transformations (e.g., pivoting).
  • Example: Removing duplicates and splitting text columns.

Automate Tasks with Macros

Macros save time by automating repetitive tasks:

  • Steps:
    • Go to Developer → Record Macro.
    • Perform actions and stop recording.
  • Pro Tip: Use VBA for advanced automation.

Advanced Excel Skills Checklist

Ensure you master the following to excel in assignments:

  1. Mastering formulas (e.g., VLOOKUP, INDEX-MATCH).
  2. Creating and managing PivotTables.
  3. Using Power Query for transformations.
  4. Designing interactive dashboards.
  5. Writing and editing Macros.
  6. Utilizing conditional formatting for visualization.
  7. Implementing What-If Analysis tools.
  8. Applying statistical functions like =STDEV and =CORREL.

Advanced Excel Skills for Resumes

Highlighting Excel skills on your resume can make a significant impact:

  • Key Skills to Include:
    • Proficiency in PivotTables, Macros, and Power Query.
    • Experience with advanced formulas.
    • Ability to handle large datasets and automate workflows.
  • Sample Line:
    • “Expert in data analysis using advanced Excel tools, including Power Query and VBA.”

Advanced Excel Assignment Help: How to Tackle Complex Data Entry Challenges

Advanced Excel Formulas PDF and Online Courses

Finding Useful PDFs

Free PDFs like “Advanced Excel Formulas with Examples in Excel Sheet Free Download” can provide a structured approach:

  • Sources:
    • Microsoft’s official resources.
    • Educational websites and forums.

Online Courses for Advanced Excel

Enhance your skills with free courses:

  • Popular Platforms:
    • Coursera, Udemy, and Khan Academy.
    • Microsoft’s Excel Training.

Combining PDFs and Courses

Download materials and enroll in courses to get hands-on practice.


Why Choose GetSPSSHelp.com for Advanced Excel Assignments?

Excel assignments require time, precision, and expertise. Here’s why GetSPSSHelp.com is the best choice for Excel-related tasks:

Expertise in Advanced Excel

  • Our team includes Excel professionals proficient in advanced formulas, data analysis, and automation tools.

Tailored Assistance

  • Get personalized solutions designed to meet your assignment requirements.
  • Assistance spans from basic queries to complex case studies.

High-Quality Resources

  • Access exclusive cheat sheets, templates, and guides.
  • Learn advanced techniques with step-by-step tutorials.

Affordable and Reliable

  • Competitive pricing ensures value for your money.
  • 24/7 support to address urgent queries.

Proven Results

  • Thousands of satisfied clients trust us for timely and accurate assignment help.

Final Thoughts

Advanced Excel assignments often present challenging scenarios requiring in-depth knowledge of tools, formulas, and best practices. By mastering key techniques and leveraging expert resources, you can handle complex data entry challenges efficiently. If you need professional guidance, visit GetSPSSHelp.com to ensure success in your assignments and enhance your Excel expertise.

Getspsshelp.com is the best website for advanced Excel assignment help, offering in-depth guidance on tackling complex data entry challenges. The platform provides expert strategies to handle large datasets, ensuring accuracy and efficiency in data input and analysis. With step-by-step tutorials and real-world examples, users can easily master advanced Excel functions like VLOOKUP, INDEX-MATCH, and array formulas. Personalized support from experienced instructors ensures you get tailored help for your unique assignment challenges. Whether it’s organizing, cleaning, or analyzing data, getspsshelp.com equips you with the skills needed to excel in complex data entry tasks and ace your assignments.

Needs help with similar assignment?

We are available 24x7 to deliver the best services and assignment ready within 3-4 hours? Order a custom-written, plagiarism-free paper

Get Answer Over WhatsApp Order Paper Now

How to Create Dynamic Dashboards in Excel for Business Assignments|2025

Learn how to create dynamic dashboards in Excel for business assignments. Master the tools and techniques to visualize data, track key metrics, and present insights effectively in your reports. Creating dynamic dashboards in Excel is a powerful way to visualize and interact with data for business assignments. This comprehensive guide will walk you through the process of designing dynamic dashboards, integrating essential features, and using advanced techniques. Whether you’re a student or a professional, mastering these skills will enhance your data presentation and decision-making capabilities. We’ll also highlight why Getspsshelp.com is the best resource for your Excel dashboard needs.

How to Create Dynamic Dashboards in Excel for Business Assignments

Why Use Excel for Dynamic Dashboards?

Excel is a versatile tool that allows users to create interactive dashboards with minimal effort. Its extensive features, including data visualization, automation, and interactivity, make it an ideal platform for business assignments.

Step-by-Step Guide to Creating Dynamic Dashboards in Excel

Step 1: Preparing Your Data

Organize Your Data Proper data organization is the foundation of a dynamic dashboard.

  • Use Tables: Convert your data into tables (Ctrl + T) to make it more manageable and to allow for dynamic referencing.
  • Clean Data: Remove duplicates, handle missing data, and ensure consistency.

Define Named Ranges Named ranges simplify formula references and improve readability.

  • Go to “Formulas” > “Define Name” and set your ranges.

Step 2: Designing the Dashboard Layout

Sketch the Layout Plan the layout of your dashboard on paper or using a simple Excel worksheet. Decide where to place key components like charts, tables, and filters.

Set Up the Dashboard Sheet

  • Create a new worksheet dedicated to the dashboard.
  • Use cell merging and borders to define sections for different components.

Step 3: Creating Dynamic Charts

Use Dynamic Ranges Dynamic ranges ensure that charts update automatically when data changes.

  • Use OFFSET and COUNTA functions to create dynamic ranges.
=OFFSET(Sheet1!$A$1, 0, 0, COUNTA(Sheet1!$A:$A), 1)

Insert Charts

  • Select your dynamic range and go to “Insert” > “Charts” to create the desired chart type (e.g., bar, line, pie).
  • Customize chart elements like titles, legends, and data labels.

Step 4: Adding Interactivity with Slicers and Dropdowns

Slicers for Tables and PivotTables Slicers provide an easy way to filter data visually.

  • Select your table or PivotTable, go to “Insert” > “Slicer,” and choose the fields to filter.

Dropdown Lists Dropdowns enable users to select criteria dynamically.

  • Go to “Data” > “Data Validation” and choose “List.”
  • Reference a range containing the dropdown options.

Step 5: Automating Data Updates

Using Power Query Power Query simplifies data import and transformation.

  • Go to “Data” > “Get Data” and choose your data source.
  • Apply necessary transformations and load the data into Excel.

Setting Up Automatic Refresh

  • Right-click on your query in the Queries pane and select “Properties.”
  • Enable the “Refresh data when opening the file” option.

Step 6: Creating a Dashboard Without Pivot Tables

Use Formulas and Tables You can create dynamic dashboards without PivotTables by relying on formulas and structured references.

  • Use SUMIFS, AVERAGEIFS, and COUNTIFS to aggregate data.
  • Create dynamic charts and tables based on these formulas.

Step 7: Enhancing Dashboard Aesthetics

Use Conditional Formatting Highlight key metrics using conditional formatting.

  • Select your data range, go to “Home” > “Conditional Formatting,” and apply rules.

Customize Themes and Colors Consistent themes and colors improve readability.

  • Go to “Page Layout” > “Themes” to choose or customize a theme.

How to Create Dynamic Dashboards in Excel for Business Assignments

Step 8: Using Dynamic Dashboard Templates

Download Free Templates

  • Search for “Dynamic Dashboard template in Excel free download” to find ready-to-use templates.
  • Customize the templates to fit your data and requirements.

Modify Templates

  • Update data connections, formulas, and visual elements to reflect your dataset.

Step 9: Sharing and Publishing the Dashboard

Save as Excel Workbook

  • Save your dashboard as an Excel workbook (.xlsx) for sharing.

Export as PDF

  • Go to “File” > “Export” > “Create PDF/XPS” to share a static version of the dashboard.

Share Online

  • Use Excel Online or OneDrive to share interactive dashboards.

Benefits of Using Dynamic Dashboards in Business Assignments

  • Real-Time Data Updates: Automatically refresh data for up-to-date insights.
  • Improved Decision Making: Interactive elements allow for in-depth analysis.
  • Enhanced Data Visualization: Charts and graphs make complex data more understandable.

How to Create Dynamic Dashboards in Excel for Business Assignments

Why Getspsshelp.com is the Best for This Task

At Getspsshelp.com, we provide unparalleled support for creating dynamic dashboards in Excel for business assignments. Here’s why we stand out:

  • Expert Guidance: Our team of experts offers personalized assistance tailored to your specific needs.
  • Comprehensive Resources: Access a wide range of tutorials, templates, and case studies to enhance your learning experience.
  • User-Friendly Platform: Our website is designed for easy navigation, ensuring a smooth learning journey.
  • Proven Track Record: Thousands of students and professionals trust Getspsshelp.com for their academic and professional success.

Conclusion

Creating dynamic dashboards in Excel is an essential skill for business assignments. This guide has provided a step-by-step approach to designing and implementing dynamic dashboards, from data preparation to sharing the final product. For further assistance and expert guidance, visit Getspsshelp.com—your ultimate resource for mastering Excel dashboards and achieving academic excellence.

Getspsshelp.com is the best website for learning how to create dynamic dashboards in Excel for business assignments due to its comprehensive, step-by-step guides. The platform offers expert advice on using advanced Excel features such as Power Query, PivotTables, and interactive charts to build dynamic dashboards. With real-world business examples, users can see how these techniques apply to real-world scenarios. Personalized support from experienced instructors ensures you can overcome any challenges while building your dashboards. Whether you’re working on financial reports or performance tracking, getspsshelp.com equips you with the skills to present business data effectively and impress your professors.

Needs help with similar assignment?

We are available 24x7 to deliver the best services and assignment ready within 3-4 hours? Order a custom-written, plagiarism-free paper

Get Answer Over WhatsApp Order Paper Now

Advanced Excel Tips and Tricks for Faster Assignment Completion|2025

Unlock advanced Excel tips and tricks for faster assignment completion. Master time-saving techniques, automate tasks, and boost your efficiency for quicker and more accurate results. Excel is a powerful tool that can streamline tasks and enhance productivity for students and professionals alike. With its wide array of features, learning advanced tips and tricks can significantly reduce the time required to complete assignments. In this guide, we delve into advanced Excel tips and tricks to supercharge your efficiency and master the art of data handling.


Advanced Excel Tips and Tricks for Faster Assignment Completion

Top Advanced Excel Tricks

Conditional Formatting for Dynamic Data Visualization

Conditional formatting is an advanced feature to highlight data trends and anomalies:

  • Steps to Use:
    • Select your dataset.
    • Go to Home → Conditional Formatting.
    • Choose rules like “Greater Than,” “Data Bars,” or “Color Scales.”
  • Example: Highlight cells with sales greater than $10,000 using a green fill.

Data Validation for Error-Free Input

Data validation ensures that only valid data is entered into your spreadsheet:

  • Steps to Use:
    • Select cells.
    • Go to Data → Data Validation.
    • Define criteria, e.g., “Whole Numbers” between 1 and 100.
  • Pro Tip: Use custom formulas like =ISNUMBER(A1) to validate specific formats.

Using Named Ranges for Complex Formulas

Named ranges simplify formulas and improve spreadsheet readability:

  • Steps to Use:
    • Select the range of cells.
    • Go to Formulas → Define Name.
    • Use names in formulas, e.g., =SUM(SalesData).

Excel Tricks and Formulas

The Power of Array Formulas

Array formulas perform multiple calculations simultaneously:

  • Example: To calculate total sales, use =SUM(A1:A10*B1:B10) and press Ctrl + Shift + Enter.

Advanced Lookup with INDEX-MATCH

INDEX-MATCH is a robust alternative to VLOOKUP:

  • Formula: =INDEX(Return_Range, MATCH(Lookup_Value, Lookup_Range, 0))
  • Benefits:
    • Works with data arranged horizontally or vertically.
    • Avoids issues with column rearrangement.

TEXT Functions for Custom Formatting

The TEXT function customizes the display of numbers and dates:

  • Formula: =TEXT(A1, "dd-mm-yyyy") converts dates to the specified format.
  • Pro Tip: Combine with & to create dynamic labels, e.g., "Total: "&TEXT(SUM(A1:A10),"$#,##0.00").

Advanced Excel Tips and Tricks for Faster Assignment Completion

Excel Tips and Tricks for Beginners

Quick Data Sorting and Filtering

  • Use Alt + D + S to access sorting options instantly.
  • Filter data with Ctrl + Shift + L for efficient navigation.

Flash Fill for Automated Data Entry

Flash Fill identifies patterns in your data and auto-completes entries:

  • Steps:
    • Start typing the desired pattern in an adjacent column.
    • Press Ctrl + E to activate Flash Fill.
  • Example: Extract first names from full names, e.g., “John Smith” to “John.”

AutoSum for Quick Calculations

  • Use Alt + = to quickly sum up a column or row of numbers.
  • Extend this to average, count, and more by using the drop-down menu in the AutoSum button.

Top 30 Advanced Excel Tips and Tricks

Here’s a curated list of the most impactful tips:

  1. PivotTables for dynamic summaries.
  2. Power Query for automated data transformation.
  3. Slicers for interactive dashboards.
  4. Remove duplicates under Data → Remove Duplicates.
  5. Use =OFFSET for dynamic ranges.
  6. Enable macros for automation.
  7. Protect sheets with Review → Protect Sheet.
  8. Use keyboard shortcuts like Ctrl + T for creating tables.
  9. Apply =RAND() for random number generation.
  10. Combine data with =CONCATENATE or =TEXTJOIN.
  11. Explore What-If Analysis under Data → Forecast.
  12. Use Sparklines for trend visualization.
  13. Automate tasks with VBA.
  14. Use =NETWORKDAYS to calculate workdays.
  15. Apply =IFERROR for cleaner outputs.
  16. Use Power Pivot for enhanced data modeling.
  17. Create drop-down lists with Data Validation.
  18. Use dynamic charts for real-time updates.
  19. Apply =SUBTOTAL for filtered data calculations.
  20. Use =HLOOKUP for horizontal data searches.
  21. Enable iterative calculations for circular references.
  22. Explore Goal Seek for target-based solutions.
  23. Link Excel with other tools like Power BI.
  24. Visualize timelines with Gantt charts.
  25. Export data to PDF directly.
  26. Apply =PMT for financial calculations.
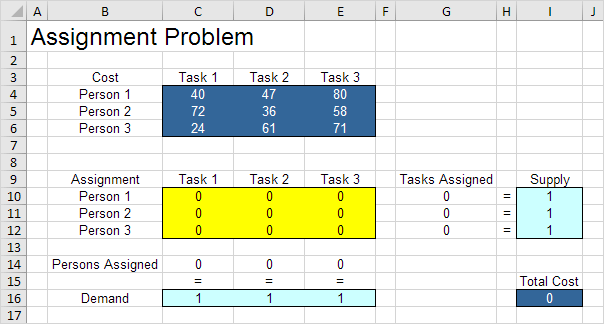
  27. Use Solver for optimization problems.
  28. Explore 3D maps for geographical data.
  29. Add custom functions with VBA.
  30. Use templates for specific assignments.

Excel Tips and Tricks PDF

Having a cheat sheet can save time during assignments. PDFs like “101 Best Excel Tips and Tricks” or “Advanced Excel Tricks PDF” offer step-by-step guides for:

  • Mastering formulas and shortcuts.
  • Leveraging advanced features like Power Query and Power Pivot.
  • Visualizing data effectively.

Where to Find PDFs:

  • Microsoft’s official website.
  • Educational portals like Coursera or Udemy.
  • GetSPSSHelp.com provides exclusive resources for subscribers.

Excel Tips and Tricks Cheat Sheet

A cheat sheet can simplify complex workflows. Include:

  • Common formulas like =VLOOKUP, =SUMIF, and =COUNTIF.
  • Keyboard shortcuts for navigation and formatting.
  • Advanced tips like using =INDIRECT for flexible references.

Advanced Excel Tips and Tricks for Faster Assignment Completion

Excel Tricks and Formulas for Faster Assignments

Shortcut Mastery

  • Use Ctrl + ; for the current date and Ctrl + Shift + ; for the current time.
  • Quickly duplicate data with Ctrl + D or fill right with Ctrl + R.

Efficient Data Cleaning

  • Split data using Text to Columns under the Data tab.
  • Trim extra spaces with =TRIM(A1).
  • Combine with Flash Fill for faster results.

Advanced Sorting Techniques

  • Sort by custom order (e.g., months) under Sort Options.
  • Use conditional sorting with helper columns.

Why Choose GetSPSSHelp.com for Excel Assignments?

Excel assignments can be daunting, especially when dealing with advanced techniques. Here’s why GetSPSSHelp.com stands out:

Expert Guidance

  • Our professionals are well-versed in Excel, from beginner to advanced levels.
  • Get personalized assistance tailored to your assignment needs.

Exclusive Resources

  • Access cheat sheets, PDF guides, and templates for free.
  • Learn with step-by-step tutorials on advanced Excel features.

Comprehensive Support

  • Available 24/7 for queries.
  • Specialized help in complex tasks like regression analysis, Power Query, and more.

Proven Track Record

  • Trusted by thousands of students for timely, high-quality solutions.
  • Affordable pricing ensures value for your money.

Final Thoughts

Mastering advanced Excel tips and tricks is crucial for faster assignment completion. With features like PivotTables, Power Query, and INDEX-MATCH, you can efficiently handle complex datasets and create impactful solutions. Need expert help? Visit GetSPSSHelp.com for personalized assistance and resources tailored to your academic success.

Getspsshelp.com is the best website for mastering advanced Excel tips and tricks to speed up assignment completion because of its detailed, easy-to-follow tutorials. The site offers expert advice on time-saving techniques, such as automation, shortcuts, and formula optimization, to make your workflow more efficient. With practical examples and real-life applications, you can quickly apply these methods to your assignments. Personalized support from experienced instructors ensures you can tackle even the most complex Excel tasks with confidence. Whether you’re working on data analysis or complex calculations, getspsshelp.com helps you complete assignments faster without sacrificing accuracy.

Needs help with similar assignment?

We are available 24x7 to deliver the best services and assignment ready within 3-4 hours? Order a custom-written, plagiarism-free paper

Get Answer Over WhatsApp Order Paper Now

The Best Advanced Excel Techniques for Statistical Analysis Assignments|2025

Master the best advanced Excel techniques for statistical analysis assignments. Discover powerful tools and methods to perform complex calculations, visualize data, and elevate your assignment results. Excel is a powerful tool for statistical analysis, offering numerous advanced features and techniques that can simplify complex data tasks. Whether you’re a student or a professional, mastering these techniques can significantly enhance your data analysis skills. This guide will delve into the best advanced Excel techniques for statistical analysis assignments, providing practical insights and examples. Additionally, we’ll explain why Getspsshelp.com is the best resource for your data analysis needs.

The Best Advanced Excel Techniques for Statistical Analysis Assignments

Why Use Excel for Statistical Analysis?

Excel’s versatility and extensive range of functions make it an ideal tool for statistical analysis. It allows users to handle large datasets, apply complex formulas, and visualize data effectively. With the right techniques, Excel can become your go-to platform for all your statistical analysis assignments.

Advanced Excel Techniques for Statistical Analysis

Data Cleaning and Preparation

Importance: Before any analysis, data must be cleaned and organized. Excel offers several tools to help with this process.

Techniques:

  • Remove Duplicates: Use “Remove Duplicates” under the “Data” tab to eliminate duplicate entries.
  • Text to Columns: Split data into multiple columns using the “Text to Columns” feature.
  • Data Validation: Ensure data accuracy by setting validation rules.

PivotTables and PivotCharts

Importance: PivotTables and PivotCharts allow you to summarize and visualize large datasets efficiently.

Techniques:

  • Create a PivotTable: Highlight your dataset, go to “Insert” > “PivotTable,” and select your fields.
  • Use Slicers: Add slicers to filter data interactively.
  • Create PivotCharts: Visualize PivotTable data with charts by selecting “Insert” > “PivotChart.”

Advanced Formulas for Statistical Analysis

Importance: Advanced formulas help in performing complex statistical calculations easily.

Techniques:

  • AVERAGEIFS: Calculate the average of a range based on multiple criteria.
=AVERAGEIFS(AverageRange, CriteriaRange1, Criteria1, CriteriaRange2, Criteria2)
  • STDEV.P and STDEV.S: Calculate the standard deviation for a population or sample.
=STDEV.P(DataRange)
=STDEV.S(DataRange)
  • CORREL: Find the correlation coefficient between two datasets.
=CORREL(Array1, Array2)

Data Analysis Toolpak

Importance: The Data Analysis Toolpak provides a range of statistical tools, including regression analysis, ANOVA, and descriptive statistics.

Techniques:

  • Enable the Toolpak: Go to “File” > “Options” > “Add-ins” > “Excel Add-ins” > Check “Analysis ToolPak.”
  • Use the tools: Access via “Data” > “Data Analysis” and choose the desired analysis tool.

Solver for Optimization

Importance: Solver helps in finding optimal solutions for linear programming and other optimization problems.

Techniques:

  • Enable Solver: Go to “File” > “Options” > “Add-ins” > “Excel Add-ins” > Check “Solver Add-in.”
  • Define the problem: Set your objective, variables, and constraints in the Solver parameters.
  • Solve: Click “Solve” to find the optimal solution.

Conditional Formatting for Data Visualization

Importance: Highlighting data patterns and trends can be achieved through conditional formatting.

Techniques:

  • Apply Conditional Formatting: Select your data, go to “Home” > “Conditional Formatting,” and choose a rule.
  • Custom Rules: Create custom formulas for more advanced formatting.

Using Array Formulas

Importance: Array formulas allow you to perform multiple calculations on one or more sets of values.

Techniques:

  • Entering Array Formulas: Press Ctrl + Shift + Enter to input an array formula.
  • Example: Sum of products across arrays.
=SUM(A1:A10*B1:B10)

The Best Advanced Excel Techniques for Statistical Analysis Assignments

Power Query for Data Transformation

Importance: Power Query simplifies the process of cleaning and transforming data from multiple sources.

Techniques:

  • Import Data: Go to “Data” > “Get Data” > Choose your data source.
  • Apply Transformations: Use the Power Query editor to filter, sort, and transform your data.
  • Load to Excel: Once transformed, load the data back into Excel for analysis.

Power Pivot for Data Modeling

Importance: Power Pivot allows for creating complex data models and performing advanced calculations.

Techniques:

  • Enable Power Pivot: Go to “File” > “Options” > “Add-ins” > “COM Add-ins” > Check “Microsoft Power Pivot for Excel.”
  • Create Relationships: Link tables to create a relational data model.
  • Use DAX Functions: Perform advanced calculations using Data Analysis Expressions (DAX).

VBA for Automation

Importance: VBA (Visual Basic for Applications) allows you to automate repetitive tasks and create custom functions.

Techniques:

  • Record a Macro: Go to “Developer” > “Record Macro” to automate tasks.
  • Write VBA Code: Use the VBA editor (Alt + F11) to write custom scripts.
  • Example VBA Code:
Sub AnalyzeData()
    ' Custom VBA code for statistical analysis
End Sub

Practical Applications and Case Studies

Data Analysis Using Excel Case Study

Case Study: Analyzing sales data to identify trends and forecast future performance.

  • Use PivotTables to summarize sales by region.
  • Apply advanced formulas like FORECAST and TREND for predictive analysis.
  • Visualize findings using PivotCharts and conditional formatting.

Resources for Learning and Improvement

Advanced Excel for Data Analysis PDF: Download our comprehensive PDF guide for a detailed understanding of advanced Excel techniques.

Most Useful Excel Functions for Data Analysis PDF: Access our curated list of essential Excel functions for data analysis.

Data Analytics Excel Course Free: Enroll in our free online course to enhance your data analytics skills.

Excel for Data Analysis Book: Get our recommended book for mastering Excel data analysis.

Excel Data Analysis Course: Join our specialized courses for hands-on learning.

Excel Tricks for Data Analysis: Explore tips and tricks to streamline your data analysis process.

The Best Advanced Excel Techniques for Statistical Analysis Assignments

Why Getspsshelp.com is Your Best Resource

At Getspsshelp.com, we provide unparalleled support for students and professionals tackling statistical analysis assignments using Excel. Here’s why we’re the best choice:

  • Expert Guidance: Our team of experts offers personalized help to ensure you master advanced Excel techniques.
  • Comprehensive Resources: Access a wide range of tutorials, case studies, and downloadable materials.
  • User-Friendly Platform: Our website is designed for ease of use, with clear instructions and step-by-step guides.
  • Proven Success: Thousands of students have benefited from our services, achieving excellence in their data analysis assignments.

Conclusion

Mastering advanced Excel techniques is crucial for effectively handling statistical analysis assignments. This guide has covered essential techniques, practical applications, and resources to enhance your skills. For expert help and further learning, visit Getspsshelp.com—your ultimate resource for academic success in data analysis.

Getspsshelp.com stands out as the best website for advanced Excel techniques for statistical analysis assignments due to its comprehensive and expertly crafted tutorials. The platform covers a wide range of statistical functions and techniques, making complex data analysis accessible to students at all levels. With detailed explanations, practical examples, and step-by-step guidance, users can confidently apply advanced Excel functions like regression, pivot tables, and statistical tests. The website also offers personalized support, ensuring that students get tailored help for their unique assignment challenges. Whether you’re analyzing large datasets or creating sophisticated models, getspsshelp.com equips you with the skills needed to excel in your statistical analysis assignments.

Needs help with similar assignment?

We are available 24x7 to deliver the best services and assignment ready within 3-4 hours? Order a custom-written, plagiarism-free paper

Get Answer Over WhatsApp Order Paper Now

How to Solve Regression Problems Using Excel for Your Assignment|2025

Learn how to solve regression problems using Excel with step-by-step guidance. Master data input, trendline analysis, and Excel’s built-in regression tools to perform accurate predictions and analyses for your assignments and projects Regression analysis is a cornerstone statistical technique widely used in assignments, research, and business to identify relationships between variables. Excel offers powerful built-in tools for conducting regression analysis, making it accessible and efficient for students and professionals alike. In this guide, we will explore how to perform regression analysis in Excel, including multiple variable regression, interpreting results, and utilizing templates. Along the way, we’ll highlight why GetSPSSHelp.com is your go-to platform for assistance with these tasks.


How to Solve Regression Problems Using Excel

Understanding Regression Analysis

Regression analysis examines the relationship between dependent and independent variables to predict outcomes or understand correlations. Excel’s versatility makes it a great tool for this purpose.

Types of Regression in Excel

  • Linear Regression: Models a linear relationship between two variables.
  • Multiple Regression: Incorporates two or more independent variables to explain variations in a dependent variable.

How to Do Regression Analysis in Excel with Multiple Variables

Multiple regression involves analyzing how two or more independent variables influence a dependent variable.

Steps:

  1. Prepare Your Data:
    • Organize your data in columns: one for the dependent variable and others for independent variables.
    • Ensure no missing values; replace or impute as needed.
  2. Enable the Analysis ToolPak:
    • Go to File → Options → Add-ins.
    • Select “Analysis ToolPak” under Excel Add-ins and click OK.
  3. Access Regression Analysis:
    • Navigate to the Data tab.
    • Click on Data Analysis and select Regression.
  4. Input Variables:
    • Define the dependent variable (Y Range) and independent variables (X Range).
    • Check the “Labels” box if your data includes headers.
  5. Customize Output:
    • Select an output range or new worksheet for results.
    • Enable residual plots and confidence levels for deeper insights.
  6. Run the Analysis:
    • Click OK to generate the results.

Excel Linear Regression Formula

Excel offers formulas for manual regression calculations:

Linear Regression Formula in Excel:

  • Slope: =SLOPE(Y_range, X_range)
  • Intercept: =INTERCEPT(Y_range, X_range)
  • R-squared: =RSQ(Y_range, X_range)

Example:

To predict sales based on advertising spend:

  1. Input advertising data in Column A and sales in Column B.
  2. Use formulas in separate cells:
    • =SLOPE(B2:B10, A2:A10) for slope.
    • =INTERCEPT(B2:B10, A2:A10) for intercept.

How to Solve Regression Problems Using Excel

Excel Regression Formula

While the formulas mentioned above are useful, Excel’s built-in functions in the Data Analysis ToolPak streamline the process.

Steps:

  1. Use the Regression feature under the Data Analysis ToolPak.
  2. Define input ranges for dependent and independent variables.
  3. Analyze outputs, including coefficients, standard errors, and R-squared values.

How to Interpret Regression Results in Excel

The output of regression analysis can be overwhelming at first glance. Here’s how to break it down:

Key Components:

  • Coefficients: Indicate the relationship strength and direction between variables.
  • R-squared: Explains the proportion of variance in the dependent variable accounted for by the independent variables.
    • R-squared close to 1 indicates a strong fit.
  • P-values: Show statistical significance. P-values less than 0.05 suggest a significant relationship.
  • Residuals: Indicate the differences between observed and predicted values.

Example:

For a sales regression analysis:

  • A coefficient of 2.5 for advertising suggests each $1 spent on advertising increases sales by $2.50.
  • R-squared of 0.85 means 85% of sales variation is explained by advertising spend.

Regression Analysis Excel Template

Using pre-built templates can save time and improve accuracy. Many templates are available online to guide you through:

  • Data organization.
  • Input and output ranges.
  • Visualization of regression results.

Where to Find Templates:

  • Microsoft Office Template Gallery.
  • Specialized educational websites.
  • Custom templates from GetSPSSHelp.com.

Excel Regression Analysis Examples

Example 1: Predicting Housing Prices

  1. Data: Input features like square footage, number of bedrooms, and location.
  2. Analysis: Use multiple regression to predict prices based on these variables.
  3. Output: Interpret coefficients to determine the impact of each feature.

Example 2: Analyzing Marketing ROI

  1. Data: Organize spending across channels (e.g., social media, email, PPC).
  2. Analysis: Perform regression to identify which channel yields the highest ROI.
  3. Output: Focus efforts on channels with significant positive coefficients.

How to Solve Regression Problems Using Excel

Regression Analysis Excel (2022)

The 2022 updates to Excel have made regression analysis more user-friendly, with enhanced features such as:

  • Improved visualization tools.
  • Streamlined interface for Data Analysis ToolPak.
  • Compatibility with AI-driven insights for regression predictions.

Linear Regression Excel

Linear regression in Excel is ideal for simple relationships. For instance:

  • Use =TREND or =FORECAST.LINEAR functions for predictions.
  • Visualize the relationship with scatter plots and trendlines.

Adding a Trendline:

  1. Create a scatter plot of your data.
  2. Right-click on the data points and select Add Trendline.
  3. Enable the “Display Equation on Chart” option for easy reference.

Why Choose GetSPSSHelp.com?

Excel regression analysis can be intricate, especially for beginners. At GetSPSSHelp.com, we provide:

Expert Assistance

  • Step-by-step guidance for assignments involving Excel regression.
  • Custom solutions tailored to your dataset.

Resources

  • Ready-to-use regression templates.
  • Access to exclusive PDFs like “How to Do Regression Analysis in Excel with Multiple Variables” and “Regression Analysis Excel Template.”

Personalized Support

  • Clarification of regression concepts.
  • Detailed explanations of regression results and their implications.

Final Thoughts

Regression analysis in Excel is an essential skill for students and professionals. By mastering techniques like multiple regression, using built-in formulas, and interpreting outputs, you can unlock valuable insights from your data. Need assistance? Visit GetSPSSHelp.com for expert guidance and resources tailored to your needs.


Needs help with similar assignment?

We are available 24x7 to deliver the best services and assignment ready within 3-4 hours? Order a custom-written, plagiarism-free paper
Get Answer Over WhatsApp Order Paper Now

How to Prepare Financial Reports Using Excel Advanced Features|2025

Learn how to prepare financial reports using Excel advanced features. Master tools like PivotTables, advanced formulas, and data visualization to create accurate, professional financial reports for your assignments and projects!

Financial reporting is a critical aspect of business operations, and mastering Excel’s advanced features can greatly enhance the accuracy and efficiency of these reports. This comprehensive guide will walk you through the process of preparing financial reports using advanced Excel functions, formulas, and features. We’ll also discuss why getspsshelp.com is the best resource for academic help on this topic.

How to Prepare Financial Reports Using Excel Advanced Features

Step 1: Organizing Your Data

Structure Your Data

Proper data organization is essential for creating accurate financial reports.

  • Use Tables: Convert your data into tables (Ctrl + T) for easier management and analysis.
  • Use Named Ranges: Define named ranges for key data sets to simplify formulas and improve readability.

Clean Your Data

  • Remove Duplicates: Use the “Remove Duplicates” feature in the “Data” tab.
  • Handle Missing Data: Identify and address missing data points through filtering and conditional formatting.

Step 2: Using Advanced Excel Functions

Advanced Excel Formulas PDF

For a comprehensive list of advanced formulas, download our “Advanced Excel Formulas PDF.”

Key Functions for Financial Reports

SUMIFS: Summarize data based on multiple criteria.

=SUMIFS(SumRange, CriteriaRange1, Criteria1, CriteriaRange2, Criteria2)

VLOOKUP and HLOOKUP: Retrieve data from specific columns or rows.

=VLOOKUP(LookupValue, TableArray, ColIndexNum, [RangeLookup])

INDEX and MATCH: More flexible alternatives to VLOOKUP.

=INDEX(Array, MATCH(LookupValue, LookupArray, MatchType))

IF and IFERROR: Perform logical tests and handle errors gracefully.

=IF(Condition, ValueIfTrue, ValueIfFalse)
=IFERROR(Value, ValueIfError)

TEXT Functions: Format financial data for reports.

=TEXT(Value, FormatText)

Step 3: Advanced Excel Features

PivotTables

PivotTables allow you to summarize and analyze large datasets effectively.

Steps to Create a PivotTable:

  1. Select your dataset.
  2. Go to “Insert” > “PivotTable.”
  3. Place fields in “Rows,” “Columns,” “Values,” and “Filters” areas.

Power Query

Power Query simplifies data transformation and cleaning.

Steps to Use Power Query:

  1. Go to “Data” > “Get Data.”
  2. Choose your data source and load it into Power Query.
  3. Apply transformations like filtering, merging, and appending.
  4. Load the cleaned data back into Excel.

Data Validation

Ensure data accuracy by setting validation rules.

Steps to Apply Data Validation:

  1. Select the data range.
  2. Go to “Data” > “Data Validation.”
  3. Set the criteria for data entry.

How to Prepare Financial Reports Using Excel Advanced Features

Step 4: Visualizing Financial Data

Charts and Graphs

Use Excel charts to visually represent financial data.

Steps to Create Charts:

  1. Select your data.
  2. Go to “Insert” and choose a chart type (e.g., bar, line, pie).
  3. Customize the chart using “Chart Tools.”

Conditional Formatting

Highlight critical financial metrics using conditional formatting.

Steps to Apply Conditional Formatting:

  1. Select the data range.
  2. Go to “Home” > “Conditional Formatting.”
  3. Choose from pre-defined rules or create custom rules.

Step 5: Automating Financial Reports

Using Macros

Macros can automate repetitive tasks in financial reporting.

Steps to Create a Macro:

  1. Go to “Developer” > “Record Macro.”
  2. Perform the tasks you want to automate.
  3. Stop recording and assign the macro to a button or shortcut.

Using VBA

VBA (Visual Basic for Applications) allows for advanced automation and customization.

Basic VBA Code Example:

Sub GenerateReport()
    ' Code to automate financial report generation
    MsgBox "Report Generated Successfully!"
End Sub

Step 6: Case Study – Preparing a Financial Report

Case Study: Monthly Financial Summary

Objective: Create a monthly financial summary report using advanced Excel features.

Steps:

  1. Data Import: Import data from various sources using Power Query.
  2. Data Cleaning: Use data validation and conditional formatting to ensure accuracy.
  3. Analysis: Apply SUMIFS, VLOOKUP, and PivotTables to summarize financial data.
  4. Visualization: Create charts to represent key metrics like revenue, expenses, and profit.
  5. Automation: Use macros and VBA to automate report generation and distribution.

How to Prepare Financial Reports Using Excel Advanced Features

Downloadable Resources

Advanced Excel Formulas with Examples

Download our “Advanced Excel Formulas with Examples in Excel Sheet” for practical applications and examples.

Advanced Excel PDF

Access our “Advanced Excel PDF” for a complete guide on advanced features and their applications.

Why Choose getspsshelp.com?

For expert guidance on preparing financial reports using advanced Excel features, getspsshelp.com is your best resource. Here’s why:

  • Expert Support: Our team of professionals offers personalized assistance on all aspects of financial reporting.
  • Comprehensive Resources: Access a wealth of tutorials, case studies, and downloadable materials.
  • User-Friendly: Our website is designed to make learning easy, with step-by-step guides and interactive content.
  • Proven Track Record: Thousands of students and professionals trust getspsshelp.com for their academic and professional needs.

Conclusion

Mastering Excel’s advanced features is essential for preparing accurate and efficient financial reports. This guide has covered everything from organizing data to using advanced functions, automating tasks, and visualizing financial data. For further learning and expert help, visit getspsshelp.com—your ultimate resource for academic and professional success in data analysis and financial reporting.

GetSPSSHelp.com is the best website for learning how to prepare financial reports using Excel’s advanced features. Our expert guides provide step-by-step instructions on using PivotTables, advanced formulas, and data visualization tools to create detailed financial reports. We offer personalized support to ensure you understand the key concepts and apply them effectively in your assignments. With free templates and real-world examples, our platform simplifies complex financial reporting tasks. Choose GetSPSSHelp.com for reliable, comprehensive assistance that enhances your Excel skills and helps you succeed in your financial reporting projects!

Needs help with similar assignment?

We are available 24x7 to deliver the best services and assignment ready within 3-4 hours? Order a custom-written, plagiarism-free paper

Get Answer Over WhatsApp Order Paper Now

Using Power Query in Excel for Data Transformation and Analysis|2025

Master using Power Query in Excel for data transformation and analysis. Learn how to clean, merge, and shape data efficiently to streamline your analysis and enhance your Excel projects!

Microsoft Excel’s Power Query is a robust tool for data transformation and analysis. With its intuitive interface and powerful capabilities, Power Query simplifies the process of importing, cleaning, and analyzing data from various sources. In this comprehensive guide, we’ll cover how to use Power Query effectively, provide examples, and address common questions like “How to open Power Query in Excel” and “How to add Power Query in Excel.” For additional resources, explore PDFs like “Using Power Query in Excel for Data Transformation and Analysis PDF.”


Using Power Query in Excel for Data Transformation and Analysis

What Is Power Query?

Power Query is a data connectivity and transformation tool in Excel. It enables users to import data from multiple sources, clean and transform it, and load it into Excel for further analysis. With features tailored for repetitive tasks, Power Query can save time and enhance productivity.

Key Features

  • Connects to various data sources, including databases, web pages, and Excel files.
  • Offers powerful transformation capabilities without needing advanced coding skills.
  • Automates repetitive tasks using saved queries.

How to Add Power Query in Excel

Depending on your Excel version, Power Query may already be available. Here’s how to ensure it’s set up:

Excel 2016 and Later

  • Power Query is integrated into the Data tab under the Get & Transform section.

Excel 2013 and 2010

  • Download and install the Power Query add-in from the Microsoft website.
  • After installation, you’ll find it in the Power Query tab.

How to Open Power Query in Excel

To start using Power Query:

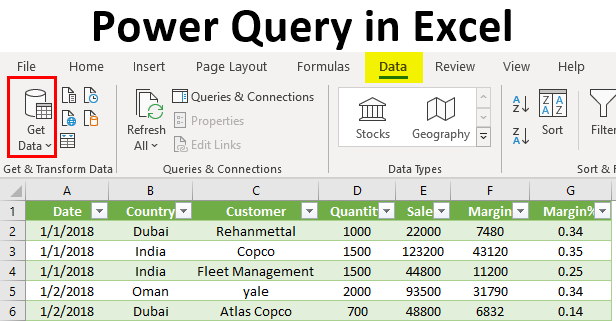
  1. Go to the Data tab.
  2. Click on Get Data to access various data sources.
  3. Select Launch Power Query Editor to open the interface for transformations.

Using Power Query in Excel for Data Transformation and Analysis

Using Power Query in Excel for Data Transformation and Analysis

Power Query simplifies complex data manipulation tasks. Here are key steps:

Import Data

  1. Click Get Data from the Data tab.
  2. Choose a source (e.g., Excel file, database, or web).
  3. Preview and select the data to load.

Transform Data

Use the Power Query Editor to:

  • Remove Duplicates: Eliminate redundant rows.
  • Split Columns: Divide data using delimiters like commas or spaces.
  • Merge Queries: Combine datasets from different sources.
  • Replace Values: Automatically clean erroneous or missing values.

Load Data

After transforming, load the data into Excel:

  • Click Close & Load to export it into a worksheet.

Using Power Query in Excel for Data Transformation and Analysis Examples

Example 1: Cleaning Sales Data

Scenario: A company’s sales data includes duplicates and missing values.

Steps:

  1. Import the sales dataset.
  2. Remove duplicates using the Remove Rows feature.
  3. Fill missing values using Fill Down or Replace Values.
  4. Load the cleaned data back into Excel.

Example 2: Combining Data from Multiple Files

Scenario: Monthly reports are stored in separate Excel files.

Steps:

  1. Use Get Data → From Folder to import all files.
  2. Combine files using the Combine & Transform option.
  3. Apply transformations and load the data into a new worksheet.

Using Power Query in Excel for Data Transformation and Analysis Formula

Power Query uses the M language for advanced transformations. Some commonly used formulas include:

Add Column Formula

  • To calculate a new column: = Table.AddColumn(Source, "NewColumn", each [Column1] + [Column2])

Replace Values

  • Replace errors: = Table.ReplaceErrorValues(Source, {"ColumnName", "ReplacementValue"})

Filter Rows

  • Filter data: = Table.SelectRows(Source, each [ColumnName] > 100)

Using Power Query in Excel for Data Transformation and Analysis

Power Query Excel Examples

Merging Customer Data

Scenario: Merge customer details from two tables. Steps:

  1. Load both tables into Power Query.
  2. Use the Merge Queries option, selecting a common column (e.g., Customer ID).
  3. Expand the merged data to include desired fields.

Creating a Sales Forecast

Scenario: Predict sales trends. Steps:

  1. Import historical sales data.
  2. Create a Custom Column for forecast calculations.
  3. Load the processed data for visualization in PivotTables.

Power Query Tutorial PDF

For offline learning, search for tutorials and guides like “Power Query Tutorial PDF.” These resources offer step-by-step instructions and practical examples to enhance your skills.


Benefits of Power Query for Data Transformation

Automation

Power Query saves time by automating repetitive tasks. Once a query is created, it can be reused with updated data.

Scalability

Handle large datasets with ease, leveraging Power Query’s efficiency to process millions of rows.

Integration

Seamlessly integrate data from multiple sources, creating a unified dataset for analysis.


How to Use Power Query in Excel for Business Insights

Data Consolidation

Combine sales, inventory, and customer feedback data for holistic business insights.

Trend Analysis

Transform raw data into actionable insights by visualizing trends over time.

Reporting

Prepare cleaned and consolidated datasets for dynamic reporting using PivotTables and dashboards.


Using Power Query in Excel for Data Transformation and Analysis

Final Thoughts

Power Query in Excel is a game-changer for data transformation and analysis. Whether you’re cleaning data, merging files, or creating advanced transformations, Power Query makes it intuitive and efficient. Enhance your skills further by exploring resources like “Using Power Query in Excel for Data Transformation and Analysis PDF” or “Power Query Tutorial PDF.”

For assistance with Excel assignments or case studies, visit GetSPSSHelp.com. Our experts are ready to guide you through complex tasks, ensuring you maximize Power Query’s potential.


Needs help with similar assignment?

We are available 24x7 to deliver the best services and assignment ready within 3-4 hours? Order a custom-written, plagiarism-free paper
Get Answer Over WhatsApp Order Paper Now